Estimated zip code population in 2022: 3,332 Zip code population in 2010: 3,393 Zip code population in 2000: 2,995
Houses and condos: 1,351 Renter-occupied apartments: 271
% of renters here:
21%
State:
33%
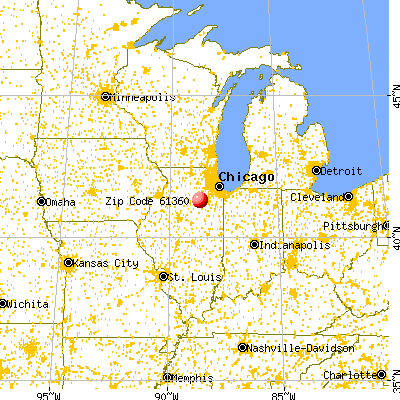
March 2022 cost of living index in zip code 61360: 85.8 (less than average, U.S. average is 100)
Land area: 49.7 sq. mi. Water area: 0.4 sq. mi.
Population density: 67 people per square mile
(very low).
OSM Map
General Map
Google Map
MSN Map
OSM Map
General Map
Google Map
MSN Map
OSM Map
General Map
Google Map
MSN Map
OSM Map
General Map
Google Map
MSN Map
Please wait while loading the map...
Real estate property taxes paid for housing units in 2022:
This zip code:
1.4% ($3,277)
Illinois:
2.0% ($4,912)
Median real estate property taxes paid for housing units with mortgages in 2022: $3,216 (1.5%) Median real estate property taxes paid for housing units with no mortgage in 2022: $3,367 (1.2%)
Business Search- 14 Million verified businesses
Males: 1,713
(51.4%)
Females: 1,618
(48.6%)
For population 25 years and over in 61360:
High school or higher: 94.5%
Bachelor's degree or higher: 14.9%
Graduate or professional degree: 2.5%
Unemployed: 4.1%
Mean travel time to work (commute): 25.1 minutes
For population 15 years and over in 61360:
Never married: 24.3%
Now married: 58.7%
Separated: 3.1%
Widowed: 2.7%
Divorced: 11.1%
Zip code 61360 compared to state average:
Black race population percentage significantly below state average.
Hispanic race population percentage significantly below state average.
Median age above state average.
Foreign-born population percentage significantly below state average.
Renting percentage below state average.
Length of stay since moving in significantly above state average.
Number of college students below state average.
Percentage of population with a bachelor's degree or higher significantly below state average.
Averages for the 2020 tax year for zip code 61360, filed in 2021:
Average Adjusted Gross Income (AGI) in 2020: $67,577 (Individual Income Tax Returns)
Here:
$67,577
State:
$82,626
Salary/wage: $57,828 (reported on 82.7% of returns)
Here:
$57,828
State:
$66,640
(% of AGI for various income ranges: 1138.1% for AGIs below $25k, 3264.1% for AGIs $25k-50k, 5596.2% for AGIs $50k-75k, 8715.4% for AGIs $75k-100k, 15058.8% for AGIs $100k-200k)
Taxable interest for individuals: $823 (reported on 29.0% of returns)
This zip code:
$823
Illinois:
$2,376
(% of AGI for various income ranges: 12.5% for AGIs below $25k, 27.2% for AGIs $25k-50k, 51.2% for AGIs $50k-75k, 40.8% for AGIs $75k-100k, 34.6% for AGIs $100k-200k)
Ordinary dividends: $2,724 (reported on 20.4% of returns)
Here:
$2,724
State:
$9,061
(% of AGI for various income ranges: 24.2% for AGIs below $25k, 15.5% for AGIs $25k-50k, 87.5% for AGIs $50k-75k, 49.2% for AGIs $75k-100k, 144.2% for AGIs $100k-200k)
Net capital gain/loss in AGI: +$7,614 (reported on 17.3% of returns)
Here:
+$7,614
State:
+$31,684
(% of AGI for various income ranges: 1.9% for AGIs below $25k, 25.9% for AGIs $25k-50k, 47.5% for AGIs $50k-75k, 95.4% for AGIs $75k-100k, 208.8% for AGIs $100k-200k)
Profit/loss from business: +$6,889 (reported on 11.7% of returns)
Here:
+$6,889
State:
+$12,175
(% of AGI for various income ranges: 57.8% for AGIs below $25k, 72.4% for AGIs $25k-50k, 139.4% for AGIs $50k-75k, 138.5% for AGIs $75k-100k, 203.3% for AGIs $100k-200k)
Taxable individual retirement arrangement distribution: $19,340 (reported on 9.3% of returns)
61360:
$19,340
Illinois:
$21,613
(% of AGI for various income ranges: 39.7% for AGIs below $25k, 150.7% for AGIs $25k-50k, 386.9% for AGIs $50k-75k, 709.2% for AGIs $100k-200k)
Total itemized deductions: $31,871 (reported on 4.3% of returns)
Here:
$31,871
State:
$34,948
(% of AGI for various income ranges: 556.2% for AGIs $50k-75k, 558.8% for AGIs $100k-200k)
Charity contributions: $9,350 (reported on 2.5% of returns)
Here:
$9,350
State:
$13,122
(% of AGI for various income ranges: 155.8% for AGIs $100k-200k)
Taxes paid: $6,400 (reported on 4.3% of returns)
61360:
$6,400
State:
$8,563
(% of AGI for various income ranges: 85.6% for AGIs $50k-75k, 129.6% for AGIs $100k-200k)
Earned income credit: $2,227 (reported on 13.6% of returns)
Here:
$2,227
State:
$2,311
(% of AGI for various income ranges: 79.2% for AGIs below $25k, 70.7% for AGIs $25k-50k)
Percentage of individuals using paid preparers for their 2020 taxes: 96.3%
Here:
96%
State:
93%
(% for various income ranges: 93.9% for AGIs below $25k, 97.1% for AGIs $25k-50k, 100.0% for AGIs $50k-75k, 94.4% for AGIs $75k-100k, 97.1% for AGIs $100k-200k, 100.0% for AGIs over 200k)
Averages for the 2012 tax year for zip code 61360, filed in 2013:
Average Adjusted Gross Income (AGI) in 2012: $55,882 (Individual Income Tax Returns)
Here:
$55,882
State:
$68,058
Salary/wage: $48,220 (reported on 83.1% of returns)
Here:
$48,220
State:
$55,396
(% of AGI for various income ranges: 68.8% for AGIs below $25k, 69.1% for AGIs $25k-50k, 73.0% for AGIs $50k-75k, 74.2% for AGIs $75k-100k, 81.5% for AGIs $100k-200k, 36.8% for AGIs over 200k)
Taxable interest for individuals: $784 (reported on 34.9% of returns)
This zip code:
$784
Illinois:
$1,969
(% of AGI for various income ranges: 1.2% for AGIs below $25k, 0.8% for AGIs $25k-50k, 0.3% for AGIs $50k-75k, 0.6% for AGIs $75k-100k, 0.2% for AGIs $100k-200k, 0.6% for AGIs over 200k)
Ordinary dividends: $2,078 (reported on 22.3% of returns)
Here:
$2,078
State:
$7,786
(% of AGI for various income ranges: 1.1% for AGIs below $25k, 1.4% for AGIs $25k-50k, 0.6% for AGIs $50k-75k, 0.6% for AGIs $75k-100k, 1.0% for AGIs $100k-200k)
Net capital gain/loss in AGI: +$3,395 (reported on 12.0% of returns)
Here:
+$3,395
State:
+$22,183
(% of AGI for various income ranges: 0.1% for AGIs $75k-100k, 2.0% for AGIs $100k-200k)
Profit/loss from business: +$6,362 (reported on 12.7% of returns)
Here:
+$6,362
State:
+$12,903
(% of AGI for various income ranges: 5.5% for AGIs below $25k, 1.7% for AGIs $25k-50k, 2.4% for AGIs $50k-75k, 0.7% for AGIs $75k-100k, 0.7% for AGIs $100k-200k)
Taxable individual retirement arrangement distribution: $11,974 (reported on 11.4% of returns)
61360:
$11,974
Illinois:
$17,929
(% of AGI for various income ranges: 2.8% for AGIs below $25k, 4.2% for AGIs $25k-50k, 1.7% for AGIs $50k-75k, 2.1% for AGIs $75k-100k, 2.9% for AGIs $100k-200k)
Total itemized deductions: $18,529 (20% of AGI, reported on 33.7% of returns)
Here:
$18,529
State:
$26,433
Here:
19.7% of AGI
State:
19.2% of AGI
(% of AGI for various income ranges: 5.6% for AGIs below $25k, 8.7% for AGIs $25k-50k, 12.6% for AGIs $50k-75k, 12.0% for AGIs $75k-100k, 13.1% for AGIs $100k-200k, 8.6% for AGIs over 200k)
Charity contributions: $1,978 (reported on 24.1% of returns)
Here:
$1,978
State:
$4,525
(% of AGI for various income ranges: 0.7% for AGIs $25k-50k, 0.8% for AGIs $50k-75k, 0.9% for AGIs $75k-100k, 1.3% for AGIs $100k-200k)
Taxes paid: $7,516 (reported on 33.7% of returns)
61360:
$7,516
State:
$11,968
(% of AGI for various income ranges: 1.3% for AGIs below $25k, 2.5% for AGIs $25k-50k, 4.7% for AGIs $50k-75k, 4.7% for AGIs $75k-100k, 5.9% for AGIs $100k-200k, 4.4% for AGIs over 200k)
Earned income credit: $2,045 (reported on 13.3% of returns)
Here:
$2,045
State:
$2,349
(% of AGI for various income ranges: 4.8% for AGIs below $25k, 0.8% for AGIs $25k-50k)
Percentage of individuals using paid preparers for their 2012 taxes: 59.6%
Here:
60%
State:
57%
(% for various income ranges: 51.7% for AGIs below $25k, 58.8% for AGIs $25k-50k, 65.4% for AGIs $50k-75k, 66.7% for AGIs $75k-100k, 64.0% for AGIs $100k-200k, 100.0% for AGIs over 200k)
Averages for the 2004 tax year for zip code 61360, filed in 2005:
Average Adjusted Gross Income (AGI) in 2004: $44,091 (Individual Income Tax Returns)
Here:
$44,091
State:
$54,625
Salary/wage: $39,963 (reported on 84.0% of returns)
Here:
$39,963
State:
$46,811
(% of AGI for various income ranges: 90.9% for AGIs below $10k, 64.7% for AGIs $10k-25k, 76.7% for AGIs $25k-50k, 79.7% for AGIs $50k-75k, 83.0% for AGIs $75k-100k, 67.9% for AGIs over 100k)
Taxable interest for individuals: $1,324 (reported on 50.6% of returns)
This zip code:
$1,324
Illinois:
$2,101
(% of AGI for various income ranges: 4.4% for AGIs below $10k, 3.4% for AGIs $10k-25k, 1.5% for AGIs $25k-50k, 0.9% for AGIs $50k-75k, 1.0% for AGIs $75k-100k, 1.8% for AGIs over 100k)
Taxable dividends: $1,498 (reported on 26.1% of returns)
Here:
$1,498
State:
$4,306
(% of AGI for various income ranges: 0.6% for AGIs below $10k, 1.5% for AGIs $10k-25k, 1.1% for AGIs $25k-50k, 0.8% for AGIs $50k-75k, 0.6% for AGIs $75k-100k, 1.0% for AGIs over 100k)
Net capital gain/loss: +$4,078 (reported on 18.6% of returns)
Here:
+$4,078
State:
+$17,321
(% of AGI for various income ranges: -2.3% for AGIs below $10k, 0.5% for AGIs $10k-25k, 1.4% for AGIs $25k-50k, 0.2% for AGIs $50k-75k, 2.1% for AGIs $75k-100k, 4.1% for AGIs over 100k)
Profit/loss from business: +$6,377 (reported on 13.5% of returns)
Here:
+$6,377
State:
+$11,771
(% of AGI for various income ranges: -1.3% for AGIs below $10k, 2.1% for AGIs $10k-25k, 2.1% for AGIs $25k-50k, 2.8% for AGIs $50k-75k, 0.1% for AGIs $75k-100k, 2.8% for AGIs over 100k)
IRA payment deduction: $3,370 (reported on 1.6% of returns)
61360:
$3,370
Illinois:
$3,087
Total itemized deductions: $16,165 (23% of AGI, reported on 33.1% of returns)
Here:
$16,165
State:
$20,239
Here:
23.2% of AGI
State:
19.5% of AGI
(% of AGI for various income ranges: 13.8% for AGIs below $10k, 12.4% for AGIs $10k-25k, 10.8% for AGIs $25k-50k, 13.5% for AGIs $50k-75k, 14.5% for AGIs $75k-100k, 9.4% for AGIs over 100k)
Charity contributions deductions: $1,943 (3% of AGI, reported on 26.8% of returns)
Here:
$1,943
State:
$3,719
Here:
2.6% of AGI
State:
3.4% of AGI
(% of AGI for various income ranges: 0.8% for AGIs $10k-25k, 1.0% for AGIs $25k-50k, 1.0% for AGIs $50k-75k, 1.5% for AGIs $75k-100k, 1.4% for AGIs over 100k)
Total tax: $5,971 (reported on 76.3% of returns)
61360:
$5,971
State:
$9,882
(% of AGI for various income ranges: 2.4% for AGIs below $10k, 4.0% for AGIs $10k-25k, 7.1% for AGIs $25k-50k, 8.4% for AGIs $50k-75k, 9.6% for AGIs $75k-100k, 18.3% for AGIs over 100k)
Earned income credit: $1,702 (reported on 11.4% of returns)
Here:
$1,702
State:
$1,788
Percentage of individuals using paid preparers for their 2004 taxes: 65.9%
Here:
66%
State:
61%
(% for various income ranges: 50.0% for AGIs below $10k, 65.1% for AGIs $10k-25k, 69.6% for AGIs $25k-50k, 74.1% for AGIs $50k-75k, 70.7% for AGIs $75k-100k, 74.6% for AGIs over 100k)
Likely homosexual households (counted as self-reported same-sex unmarried-partner households)
Lesbian couples: 0.3% of all households
Gay men: 0.0% of all households
Household received Food Stamps/SNAP in the past 12 months: 179 Household did not receive Food Stamps/SNAP in the past 12 months: 1,131
Women who had a birth in the past 12 months: 33 (22 now married, 11 unmarried) Women who did not have a birth in the past 12 months: 531 (233 now married, 297 unmarried)
Housing units in zip code 61360 with a mortgage: 529 (25 second mortgage, 25 both second mortgage and home equity loan) Houses without a mortgage: 58
Median monthly owner costs for units with a mortgage: $1,481 Median monthly owner costs for units without a mortgage: $717
Residents with income below the poverty level in 2022:
This zip code:
15.2%
Whole state:
11.9%
Residents with income below 50% of the poverty level in 2022:
This zip code:
11.8%
Whole state:
5.7%
Median number of rooms in houses and condos:
Here:
6.4
State:
6.4
Median number of rooms in apartments:
Here:
5.4
State:
4.1
Notable locations in this zip code not listed on our city pages
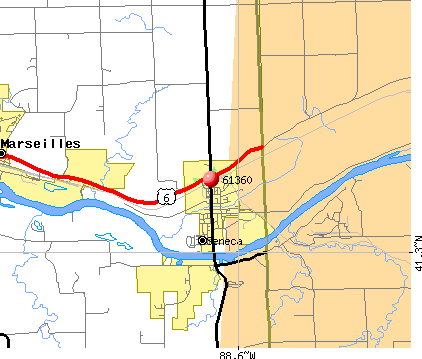
Churches in zip code 61360 include: First United Methodist Church (A), Holiness Methodist Church (B), Our Saviours Lutheran Church (C), Saint Patricks Catholic Church (D), Stavanger Lutheran Church (E). Display/hide their locations on the map
Cemeteries: Holderman and Hoge Cemetery (1), Maxton and Woodside Cemetery (2), Hegland Cemetery (3), Mount Calvary Catholic Cemetery (4), Mount Hope Cemetery (5), Fox River Cemetery (6), Stavanger Lutheran Cemetery (7). Display/hide their locations on the map
Streams, rivers, and creeks: North Kickapoo Creek (A), Armstrong Run (B), Deadly Run (C), Rat Run (D), Hog Run (E), Crotty Creek (F). Display/hide their locations on the map
Size of family households: 583 2-persons, 131 3-persons, 157 4-persons, 107 5-persons, 28 6-persons, 23 7-or-more-persons
Size of nonfamily households: 184 1-person, 85 2-persons, 4 3-persons
464 married couples with children.
288 single-parent households (88 men, 200 women).
97.4% of residents of 61360 zip code speak English at home.
1.3% of residents speak Spanish at home (64% very well, 19% well, 17% not well).
0.5% of residents speak other language at home (100% not well).
Foreign born population: 41 (1.2%) (100.0% of them are naturalized citizens)
This zip code:
1.2%
Whole state:
14.4%
85%Honduras
15%Brazil
22%Irish
13%English
12%American
10%Polish
10%German
5%Norwegian
5%Italian
Year of entry for the foreign-born population
72010 or later
02000 to 2009
11990 to 1999
37Before 1990
Facilities with environmental interests located in this zip code:
JOHN A. BIEWER CO OF ILLINOIS (524 E. UNION ST. in SENECA, IL)
STATE MASTER (Illinois EPA Project) - SOLID WASTE PROGRAM, AIR PROGRAM AIR MINOR (AIRS/AFS) CRITERIA AND HAZARDOUS AIR POLLUTANT INVENTORY (Inventory of air pollution sources) National Pollutant Discharge Elimination System NON-MAJOR (Tracking pollutant discharge elimination systems) - permit Large Quantity Generators, more that 1000 kg of hazardous waste/month (Resource Conservation and Recovery Act (tracking hazardous waste)) - notification - ICIS-, ENFORCEMENT/COMPLIANCE ACTIVITY TRI REPORTER (Tracking of toxic chemicals releasing facilities) Business SIC classification: WOOD PRESERVING Business NAICS classification: WOOD PRESERVATION. Organizations: BIEWER COMPANY OF ILLINOIS?JOH (CONTACT/OWNER)
Alternative names: BIEWER COMPANY OF ILLINOIS?JOH, BIEWER JOHN A CO OF ILL, BIEWER, JOHN COMPANY OF IL, JOHN A BIEWER OF ILLINOIS
MARTIN OPERATING PARTNERSHIP, L.P. (580 E. SHIPYARD RD. in SENECA, IL)
STATE MASTER (Illinois EPA Project) - AIR PROGRAM AIR MINOR (AIRS/AFS) CRITERIA AND HAZARDOUS AIR POLLUTANT INVENTORY (Inventory of air pollution sources) National Pollutant Discharge Elimination System NON-MAJOR (Tracking pollutant discharge elimination systems) - permit Business SIC classification: INDUSTRIAL INORGANIC CHEMICALS; FERTILIZERS, MIXING ONLY; CHEMICALS AND ALLIED PRODUCTS Alternative names: MARTIN RESOURCES INC
AT&T (2869 NORTH 3501 ROAD in SENECA, IL)
STATE MASTER (Illinois EPA Project) - AIR PROGRAM, HAZARDOUS WASTE PROGRAM, National Pollutant Discharge Elimination System Permit National Pollutant Discharge Elimination System NON-MAJOR (Tracking pollutant discharge elimination systems) - permit Small Quantity Generators, between 100 kg and 1000 kg of hazardous waste/month (Resource Conservation and Recovery Act (tracking hazardous waste)) - notification Business SIC classification: TELEPHONE COMMUNICATIONS, EXCEPT RADIOTELEPHONE Organizations: AT & T (CONTACT/OWNER)
Alternative names: AT&T COMMUNICATIONS, AT&T SENECA NORWAY
LIFETIME ROOFTILE CO (RIVER RD in SENECA, IL)
STATE MASTER (Illinois EPA Project) - AIR PROGRAM AIR MINOR (AIRS/AFS) CRITERIA AND HAZARDOUS AIR POLLUTANT INVENTORY (Inventory of air pollution sources) Business SIC classification: SPECIAL INDUSTRY MACHINERY
NOVA BIOFUELS-SENECA LLC (614 SHIPYARD RD in SENECA, IL)
STATE MASTER (Illinois EPA Project) - AIR PROGRAM AIR MINOR (AIRS/AFS) Business SIC classification: INDUSTRIAL ORGANIC CHEMICALS
COUNTRY ACRES ESTATES MHP (2464 EAST 29TH ROAD in SENECA, IL)
STATE MASTER (Illinois EPA Project) - National Pollutant Discharge Elimination System Permit National Pollutant Discharge Elimination System NON-MAJOR (Tracking pollutant discharge elimination systems) - permit Business SIC classification: LAND SUBDIVIDERS AND DEVELOPERS, EXCEPT CEMETERIES
CIRCUIT BREAKER SCHOOL (PO BOX 530 in SENECA, IL)
COMPLIANCE ACTIVITY (Tracking inspections of insecticide, fungicide, and rodenticide, and toxic substances) (National Center for Education Statistics) - STATE ID-3505000006001 Organizations: LASALLE PUTNAM ALLIANCE (SCHOOL DISTRICT)
ILL BELL TEL CO SENECA C D O (NW CORNER MAIN & WILLIAMS in SENECA, IL)
(Resource Conservation and Recovery Act (tracking hazardous waste))
LOTZ TRUCKING (RR 1 2770 NORTH 20TH ROAD in SENECA, IL)
National Pollutant Discharge Elimination System NON-MAJOR (Tracking pollutant discharge elimination systems) - permit Organizations: LOTZ TRUCKING, INC (CONTACT/OWNER)
LOUISIANA DOCK CO LLC (OLD STAGE RD in SENECA, IL)
Large Quantity Generators, more that 1000 kg of hazardous waste/month (Resource Conservation and Recovery Act (tracking hazardous waste)) - notification
ANCHOR-IN MARINA (1 E DU PONT RD in SENECA, IL)
National Pollutant Discharge Elimination System NON-MAJOR (Tracking pollutant discharge elimination systems) - permit
ILDOT FAP 786 OVER IL RIVER (SN 050 0070 in SENECA, IL)
Conditionally Exempt Small Quantity Generators, less than 100 kg/month of hazardous waste (Resource Conservation and Recovery Act (tracking hazardous waste)) - notification
Housing units lacking complete plumbing facilities: 0.6% Housing units lacking complete kitchen facilities: 1.8%
68.6%Utility gas
19.7%Bottled, tank, or LP gas
11.3%Electricity
Population in 1990: 2,246. Population change in the 1990s: +749 (+33.3%).
Place of birth for U.S.-born residents:
This state: 2,749
Northeast: 89
Midwest: 193
South: 139
West: 100
68% of the 61360 zip code residents lived in the same house 5 years ago. Out of people who lived in different houses, 52% lived in this county. Out of people who lived in different counties, 50% lived in Illinois.
96% of the 61360 zip code residents lived in the same house 1 year ago. Out of people who lived in different houses, 24% moved from this county. Out of people who lived in different houses, 76% moved from different county within same state. Out of people who lived in different houses, 4% moved from different state.
Private vs. public school enrollment:
Students in private schools in grades 1 to 8 (elementary and middle school): 54
Here:
15.8%
Illinois:
13.3%
Students in private schools in grades 9 to 12 (high school): 16
Here:
10.4%
Illinois:
9.9%
Students in private undergraduate colleges: 14
Here:
16.2%
Illinois:
27.4%
Occupation by median earnings in the past 12 months ($)
118,993Construction and extraction occupations
117,845Business and financial operations occupations
72,092Fire fighting and prevention, and other protective service workers including supervisors
71,477Transportation occupations
63,597Production occupations
60,361Computer and mathematical occupations
Top industries in this zip code by the number of employees in 2005:
Construction: Oil and Gas Pipeline and Related Structures Construction (20-49 employees: 1 establishment)
Other Services (except Public Administration): Other Similar Organizations (except Business, Professional, Labor, and Political Organizations) (10-19: 1)
Fatal accident statistics in 2013:
Fatal accident count: 1
Vehicles involved in fatal accidents: 1
Fatal accidents caused by drunken drivers: 0
Fatalities: 1
Persons involved in fatal accidents: 1
Pedestrians involved in fatal accidents: 0
Fatal accident statistics in 2012:
Fatal accident count: 1
Vehicles involved in fatal accidents: 4
Fatal accidents caused by drunken drivers: 0
Fatalities: 1
Persons involved in fatal accidents: 4
Pedestrians involved in fatal accidents: 0
2003 - 2018 National Fire Incident Reporting System (NFIRS) incidents
According to the data from the years 2003 - 2018 the average number of fire incidents per year is 33. The highest number of reported fires - 74 took place in 2012, and the least - 0 in 2005. The data has a growing trend.
When looking into fire subcategories, the most reports belonged to: Structure Fires (39.5%), and Outside Fires (37.7%).
Fire incident types reported to NFIRS in Zip Code 61360


 Nearest zip codes: 61341, 60479, 60470, 60437, 60450, 60541.


 According to the data from the years 2003 - 2018 the average number of fire incidents per year is 33. The highest number of reported fires - 74 took place in 2012, and the least - 0 in 2005. The data has a growing trend.
 When looking into fire subcategories, the most reports belonged to: Structure Fires (39.5%), and Outside Fires (37.7%).