Estimated zip code population in 2022: 1,330 Zip code population in 2010: 1,345 Zip code population in 2000: 1,337
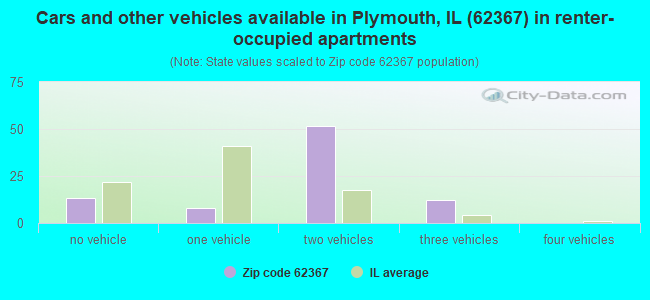
Houses and condos: 782 Renter-occupied apartments: 88
% of renters here:
13%
State:
33%
March 2022 cost of living index in zip code 62367: 84.3 (less than average, U.S. average is 100)
Land area: 114.2 sq. mi. Water area: 0.0 sq. mi.
Population density: 12 people per square mile
(very low).
OSM Map
General Map
Google Map
MSN Map
OSM Map
General Map
Google Map
MSN Map
OSM Map
General Map
Google Map
MSN Map
OSM Map
General Map
Google Map
MSN Map
Please wait while loading the map...
Real estate property taxes paid for housing units in 2022:
This zip code:
0.7% ($749)
Illinois:
2.0% ($4,912)
Median real estate property taxes paid for housing units with mortgages in 2022: $985 (0.9%) Median real estate property taxes paid for housing units with no mortgage in 2022: $556 (0.7%)
Business Search- 14 Million verified businesses
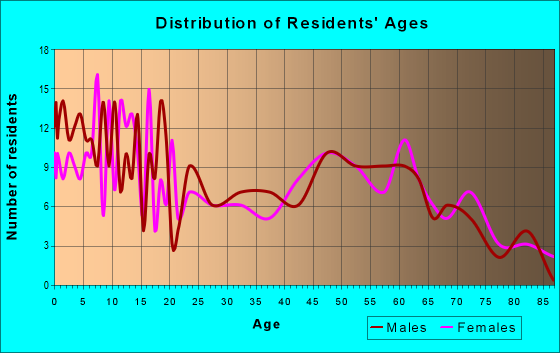
Males: 744
(56.0%)
Females: 585
(44.0%)
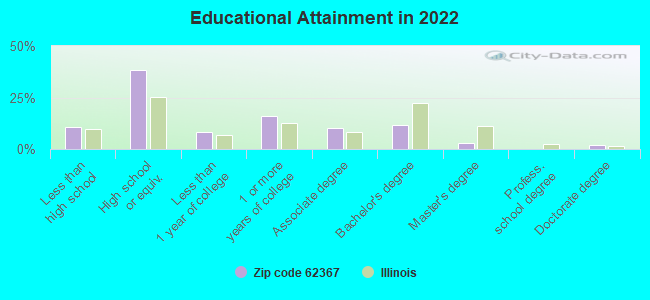
For population 25 years and over in 62367:
High school or higher: 87.5%
Bachelor's degree or higher: 16.5%
Graduate or professional degree: 5.1%
Unemployed: 9.5%
Mean travel time to work (commute): 38.9 minutes
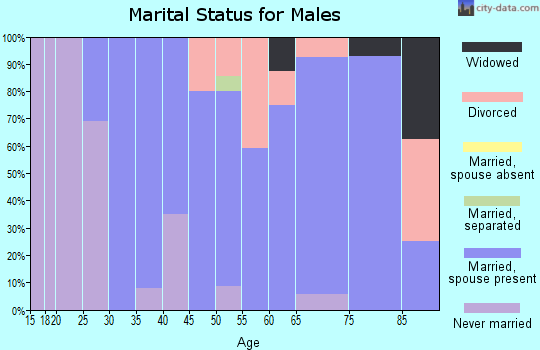
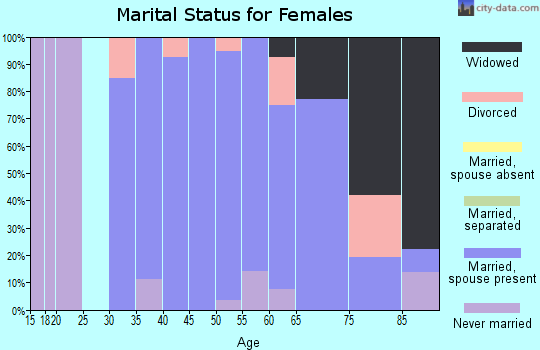
For population 15 years and over in 62367:
Never married: 21.5%
Now married: 64.2%
Separated: 0.3%
Widowed: 5.4%
Divorced: 8.5%
Zip code 62367 compared to state average:
Median household income below state average.
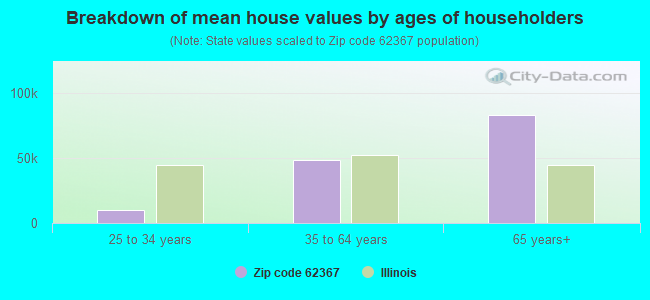
Median house value significantly below state average.
Unemployed percentage above state average.
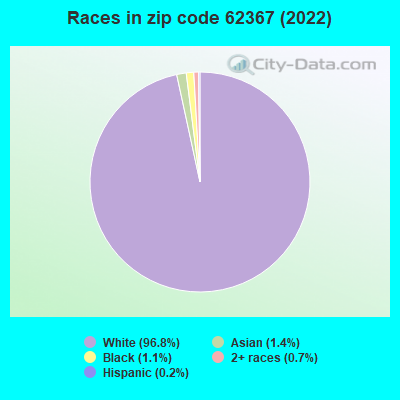
Black race population percentage significantly below state average.
Hispanic race population percentage significantly below state average.
Median age significantly above state average.
Foreign-born population percentage significantly below state average.
Renting percentage significantly below state average.
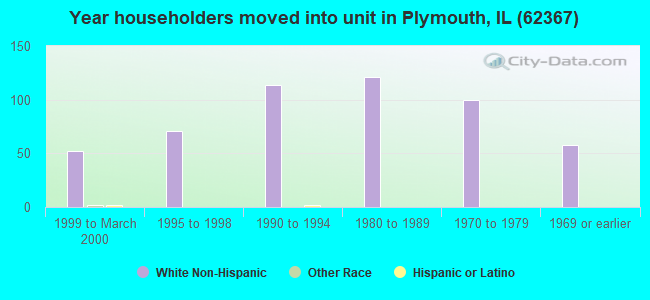
Length of stay since moving in above state average.
Percentage of population with a bachelor's degree or higher significantly below state average.
Averages for the 2020 tax year for zip code 62367, filed in 2021:
Average Adjusted Gross Income (AGI) in 2020: $44,117 (Individual Income Tax Returns)
Here:
$44,117
State:
$82,626
Salary/wage: $39,408 (reported on 73.1% of returns)
Here:
$39,408
State:
$66,640
(% of AGI for various income ranges: 1127.5% for AGIs below $25k, 3431.0% for AGIs $25k-50k, 7286.0% for AGIs $50k-75k, 10843.3% for AGIs $75k-100k, 16475.0% for AGIs $100k-200k)
Taxable interest for individuals: $1,372 (reported on 34.6% of returns)
This zip code:
$1,372
Illinois:
$2,376
(% of AGI for various income ranges: 43.3% for AGIs below $25k, 60.0% for AGIs $25k-50k, 156.0% for AGIs $50k-75k, 73.3% for AGIs $75k-100k, 175.0% for AGIs $100k-200k)
Ordinary dividends: $2,600 (reported on 15.4% of returns)
Here:
$2,600
State:
$9,061
(% of AGI for various income ranges: 107.0% for AGIs $25k-50k, 336.7% for AGIs $75k-100k)
Net capital gain/loss in AGI: +$5,043 (reported on 13.5% of returns)
Here:
+$5,043
State:
+$31,684
(% of AGI for various income ranges: 116.0% for AGIs $25k-50k, 790.0% for AGIs $75k-100k)
Profit/loss from business: +$14,812 (reported on 15.4% of returns)
Here:
+$14,812
State:
+$12,175
(% of AGI for various income ranges: 242.5% for AGIs below $25k, 571.0% for AGIs $25k-50k, 1076.7% for AGIs $75k-100k)
Taxable individual retirement arrangement distribution: $7,920 (reported on 9.6% of returns)
62367:
$7,920
Illinois:
$21,613
(% of AGI for various income ranges: 170.0% for AGIs below $25k, 384.0% for AGIs $50k-75k)
Earned income credit: $2,325 (reported on 15.4% of returns)
Here:
$2,325
State:
$2,311
(% of AGI for various income ranges: 109.2% for AGIs below $25k, 55.0% for AGIs $25k-50k)
Percentage of individuals using paid preparers for their 2020 taxes: 86.5%
Here:
87%
State:
93%
(% for various income ranges: 84.2% for AGIs below $25k, 85.7% for AGIs $25k-50k, 88.9% for AGIs $50k-75k, 83.3% for AGIs $75k-100k, 100.0% for AGIs $100k-200k)
Averages for the 2012 tax year for zip code 62367, filed in 2013:
Average Adjusted Gross Income (AGI) in 2012: $35,396 (Individual Income Tax Returns)
Here:
$35,396
State:
$68,058
Salary/wage: $31,515 (reported on 73.6% of returns)
Here:
$31,515
State:
$55,396
(% of AGI for various income ranges: 64.6% for AGIs below $25k, 72.2% for AGIs $25k-50k, 65.7% for AGIs $50k-75k, 106.8% for AGIs $75k-100k)
Taxable interest for individuals: $1,324 (reported on 39.6% of returns)
This zip code:
$1,324
Illinois:
$1,969
(% of AGI for various income ranges: 2.2% for AGIs below $25k, 1.9% for AGIs $25k-50k, 1.8% for AGIs $50k-75k, 0.9% for AGIs $75k-100k)
Ordinary dividends: $978 (reported on 17.0% of returns)
Here:
$978
State:
$7,786
(% of AGI for various income ranges: 0.5% for AGIs below $25k, 0.5% for AGIs $25k-50k, 1.3% for AGIs $75k-100k)
Net capital gain/loss in AGI: +$571 (reported on 13.2% of returns)
Here:
+$571
State:
+$22,183
Profit/loss from business: +$7,267 (reported on 17.0% of returns)
Here:
+$7,267
State:
+$12,903
Taxable individual retirement arrangement distribution: $6,480 (reported on 9.4% of returns)
62367:
$6,480
Illinois:
$17,929
Total itemized deductions: $16,380 (25% of AGI, reported on 9.4% of returns)
Here:
$16,380
State:
$26,433
Here:
25.1% of AGI
State:
19.2% of AGI
Charity contributions: $2,633 (reported on 5.7% of returns)
Here:
$2,633
State:
$4,525
Taxes paid: $4,320 (reported on 9.4% of returns)
62367:
$4,320
State:
$11,968
Earned income credit: $2,233 (reported on 22.6% of returns)
Here:
$2,233
State:
$2,349
(% of AGI for various income ranges: 6.1% for AGIs below $25k, 1.4% for AGIs $25k-50k)
Percentage of individuals using paid preparers for their 2012 taxes: 75.5%
Here:
75%
State:
57%
(% for various income ranges: 69.2% for AGIs below $25k, 78.6% for AGIs $25k-50k, 85.7% for AGIs $50k-75k, 125.0% for AGIs $75k-100k)
Averages for the 2004 tax year for zip code 62367, filed in 2005:
Average Adjusted Gross Income (AGI) in 2004: $27,281 (Individual Income Tax Returns)
Here:
$27,281
State:
$54,625
Salary/wage: $24,691 (reported on 76.6% of returns)
Here:
$24,691
State:
$46,811
(% of AGI for various income ranges: 147.1% for AGIs below $10k, 68.8% for AGIs $10k-25k, 77.4% for AGIs $25k-50k, 72.8% for AGIs $50k-75k, 40.3% for AGIs $75k-100k)
Taxable interest for individuals: $1,476 (reported on 48.7% of returns)
This zip code:
$1,476
Illinois:
$2,101
(% of AGI for various income ranges: 17.4% for AGIs below $10k, 3.5% for AGIs $10k-25k, 2.1% for AGIs $25k-50k, 2.0% for AGIs $50k-75k, 1.7% for AGIs $75k-100k)
Taxable dividends: $1,814 (reported on 18.1% of returns)
Here:
$1,814
State:
$4,306
(% of AGI for various income ranges: 3.2% for AGIs below $10k, 0.3% for AGIs $10k-25k, 1.9% for AGIs $25k-50k, 0.8% for AGIs $50k-75k, 1.2% for AGIs $75k-100k)
Net capital gain/loss: +$3,448 (reported on 17.0% of returns)
Here:
+$3,448
State:
+$17,321
(% of AGI for various income ranges: -1.5% for AGIs below $10k, 3.1% for AGIs $10k-25k, 0.6% for AGIs $25k-50k, 5.9% for AGIs $50k-75k)
Profit/loss from business: +$6,318 (reported on 15.6% of returns)
Here:
+$6,318
State:
+$11,771
(% of AGI for various income ranges: 14.2% for AGIs below $10k, 8.5% for AGIs $10k-25k, 3.8% for AGIs $25k-50k, 0.5% for AGIs $50k-75k)
Profit/loss from farming: +$1,592 (reported on 21.2% of returns)
Here:
+$1,592
State:
+$2,327
(% of AGI for various income ranges: -54.9% for AGIs below $10k, 2.6% for AGIs $10k-25k, 1.4% for AGIs $25k-50k, 6.3% for AGIs $50k-75k)
IRA payment deduction: $3,000 (reported on 2.5% of returns)
62367:
$3,000
Illinois:
$3,087
Total itemized deductions: $12,359 (29% of AGI, reported on 6.9% of returns)
Here:
$12,359
State:
$20,239
Here:
28.7% of AGI
State:
19.5% of AGI
Charity contributions deductions: $2,600 (5% of AGI, reported on 4.4% of returns)
Here:
$2,600
State:
$3,719
Here:
5.4% of AGI
State:
3.4% of AGI
Total tax: $3,152 (reported on 67.4% of returns)
62367:
$3,152
State:
$9,882
(% of AGI for various income ranges: 4.7% for AGIs below $10k, 4.2% for AGIs $10k-25k, 6.3% for AGIs $25k-50k, 9.4% for AGIs $50k-75k, 13.3% for AGIs $75k-100k)
Earned income credit: $1,770 (reported on 20.0% of returns)
Here:
$1,770
State:
$1,788
Percentage of individuals using paid preparers for their 2004 taxes: 74.3%
Here:
74%
State:
61%
(% for various income ranges: 69.8% for AGIs below $10k, 74.5% for AGIs $10k-25k, 74.8% for AGIs $25k-50k, 82.5% for AGIs $50k-75k, 76.9% for AGIs $75k-100k)
Household received Food Stamps/SNAP in the past 12 months: 76 Household did not receive Food Stamps/SNAP in the past 12 months: 585
Women who had a birth in the past 12 months: 4 (4 now married, 0 unmarried) Women who did not have a birth in the past 12 months: 181 (88 now married, 92 unmarried)
Housing units in zip code 62367 with a mortgage: 320 (4 second mortgage) Median monthly owner costs for units with a mortgage: $637 Median monthly owner costs for units without a mortgage: $410
Residents with income below the poverty level in 2022:
This zip code:
13.7%
Whole state:
11.9%
Residents with income below 50% of the poverty level in 2022:
This zip code:
4.0%
Whole state:
5.7%
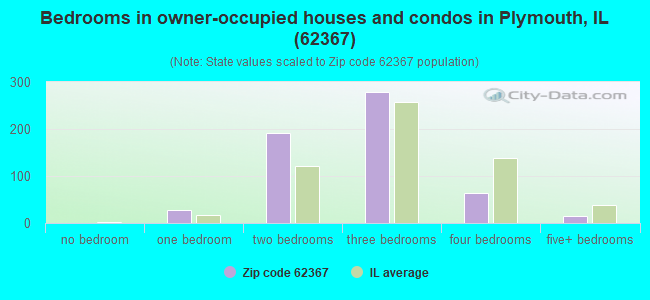
Median number of rooms in houses and condos:
Here:
5.6
State:
6.4
Median number of rooms in apartments:
Here:
4.2
State:
4.1
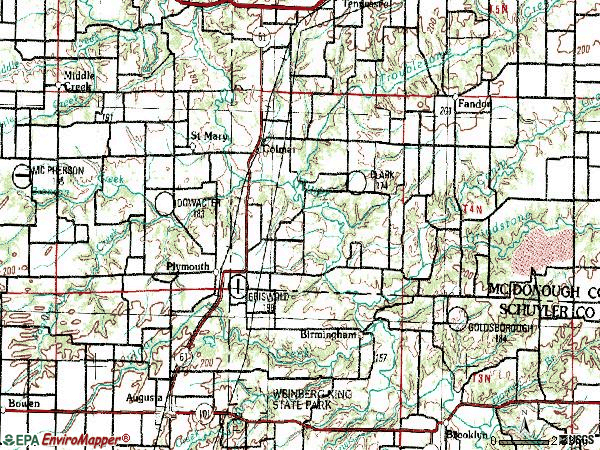
Notable locations in this zip code not listed on our city pages
Cemeteries: Blackburn Cemetery (1), Irwin Cemetery (2), Holland Cemetery (3), Markee Cemetery (4), Brooklyn Cemetery (5), Oak Grove Cemetery (6), Noel Cemetery (7). Display/hide their locations on the map
Streams, rivers, and creeks: Camp Creek (A), East Fork La Moine River (B), Beckford Branch (C), Middle Creek (D), Lewis Creek (E), Bronson Creek (F), Troublesome Creek (G), Hogwallow Branch (H), Harrison Branch (I). Display/hide their locations on the map
Size of family households: 324 2-persons, 84 3-persons, 50 4-persons, 12 5-persons
Size of nonfamily households: 128 1-person, 68 2-persons
109 married couples with children.
45 single-parent households (23 men, 22 women).
99.5% of residents of 62367 zip code speak English at home.
0.2% of residents speak Spanish at home (100% very well).
0.2% of residents speak other language at home (100% very well).
Foreign born population: 0 (0.0%)
:
0.0%
Whole state:
14.4%
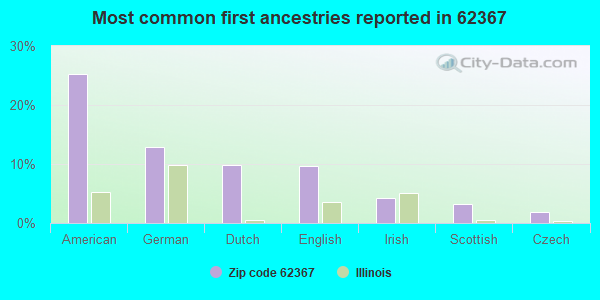
25%American
13%German
10%Dutch
10%English
4%Irish
3%Scottish
2%Czech
Year of entry for the foreign-born population
02010 or later
02000 to 2009
01990 to 1999
2Before 1990
Facilities with environmental interests located in this zip code:
PLYMOUTH ELEVATOR CO (CITY OF PLYMOUTH in PLYMOUTH, IL)
STATE MASTER (Illinois EPA Project) - AIR PROGRAM AIR MINOR (AIRS/AFS) Business SIC classification: GRAIN AND FIELD BEANS
R L ONEAL AND SONS INCORPORATED (819 NORTH COUNTY ROAD 3050 in PLYMOUTH, IL)
AIR MINOR (AIRS/AFS) CRITERIA AND HAZARDOUS AIR POLLUTANT INVENTORY (Inventory of air pollution sources) National Pollutant Discharge Elimination System NON-MAJOR (Tracking pollutant discharge elimination systems) - permit Business SIC classification: DIMENSION STONE; CRUSHED AND BROKEN LIMESTONE Alternative names: PLYMOUTH QUARRY, PLYMOUTH QUARRY, R.L. O'NEAL
ONEAL & SONS, INC.?R. L. (SECT. 24, TWN. 4N, RGE. 5W in PLYMOUTH, IL)
National Pollutant Discharge Elimination System NON-MAJOR (Tracking pollutant discharge elimination systems) - permit Alternative names: ONEAL, R.L. & SONS, INC.
PLYMOUTH WWTF, VILLAGE OF (PO BOX 283 in PLYMOUTH, IL)
National Pollutant Discharge Elimination System NON-MAJOR (Tracking pollutant discharge elimination systems) - permit Business SIC classification: SEWERAGE SYSTEMS
HOBOS QUICK TRIP (HWY 61 in PLYMOUTH, IL)
Conditionally Exempt Small Quantity Generators, less than 100 kg/month of hazardous waste (Resource Conservation and Recovery Act (tracking hazardous waste)) - notification Organizations: HOLMES ALAN AND NANCY (CONTACT/OWNER)
ALLENS FEED AND GRAIN INC (BOX 81 in COLMAR, IL)
COMPLIANCE ACTIVITY (Tracking inspections of insecticide, fungicide, and rodenticide, and toxic substances)
Housing units lacking complete plumbing facilities: 6.8% Housing units lacking complete kitchen facilities: 15.2%
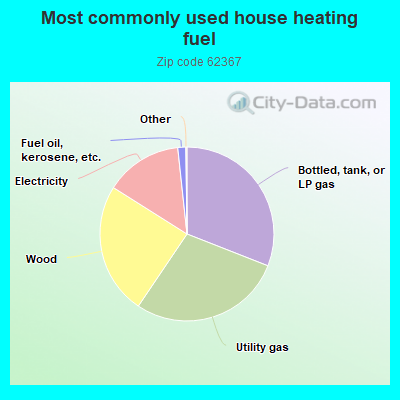
31.1%Bottled, tank, or LP gas
28.6%Utility gas
24.6%Wood
14.4%Electricity
1.5%Fuel oil, kerosene, etc.
Population in 1990: 1,425.
Place of birth for U.S.-born residents:
This state: 1,025
Northeast: 2
Midwest: 195
South: 57
West: 43
67% of the 62367 zip code residents lived in the same house 5 years ago. Out of people who lived in different houses, 29% lived in this county. Out of people who lived in different counties, 50% lived in Illinois.
93% of the 62367 zip code residents lived in the same house 1 year ago. Out of people who lived in different houses, 44% moved from this county. Out of people who lived in different houses, 42% moved from different county within same state. Out of people who lived in different houses, 12% moved from different state.
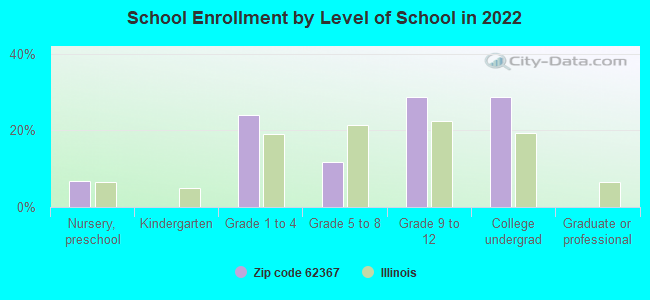
Private vs. public school enrollment:
Students in private schools in grades 1 to 8 (elementary and middle school):
Here:
0.0%
Illinois:
13.3%
Students in private schools in grades 9 to 12 (high school):
Here:
0.0%
Illinois:
9.9%
Students in private undergraduate colleges: 16
Here:
30.4%
Illinois:
27.4%
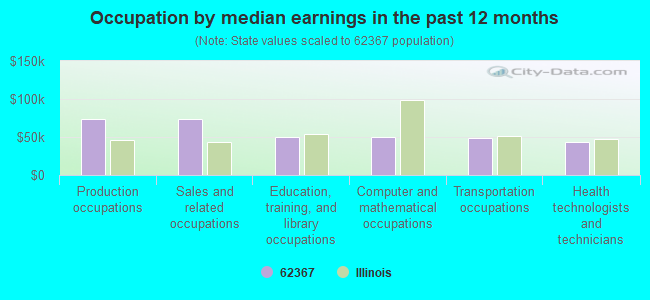
Occupation by median earnings in the past 12 months ($)
74,267Production occupations
74,044Sales and related occupations
50,066Education, training, and library occupations
49,890Computer and mathematical occupations
48,706Transportation occupations
43,791Health technologists and technicians
Companies with federal contracts located in this zip code:
D & M EARTHMOVING, INC (2770 E COUNTY ROAD 1250 in PLYMOUTH, IL; small business) : $4,471,063 in 23 contractsfrom 1999 to 2005
Contracts for Maintenance, Repair or Alteration of Real Property -- Other Non-Building Facilities, Construction of Structures and Facilities -- Dams by U.S. Army Corps of Engineers - civil program financing only, Army Signed by year:2000: $410,812; 2001: $1,278,803; 2002: $212,704; 2003: $279,323; 2004: $0; 2005: $289,421; 2006: $0.
Biggest contracts:
$2,000,000 with U.S. Army Corps of Engineers - civil program financing only for Maintenance, Repair or Alteration of Real Property -- Other Non-Building Facilities. Signed on 1999-11-22. Completion date: 1999-07-27.
$568,991, same as above.Signed on 2001-08-29. Completion date: 1999-07-27.
$550,000, same as above.Signed on 2000-10-20. Completion date: 1999-07-27.
$301,301, same as above.Signed on 2001-04-30. Completion date: 1999-07-27.
Top industries in this zip code by the number of employees in 2005:
Mining: Crushed and Broken Limestone Mining and Quarrying (10-19 employees: 1 establishment)
Construction: Water and Sewer Line and Related Structures Construction (5-9: 1)
Finance and Insurance: Commercial Banking (5-9: 1)
Other Services (except Public Administration): Religious Organizations (1-4: 1)
Accommodation and Food Services: Drinking Places (Alcoholic Beverages) (1-4: 1)
2002 - 2018 National Fire Incident Reporting System (NFIRS) incidents
According to the data from the years 2002 - 2018 the average number of fire incidents per year is 6. The highest number of reported fires - 15 took place in 2017, and the least - 2 in 2005. The data has a rising trend.
When looking into fire subcategories, the most incidents belonged to: Outside Fires (48.2%), and Structure Fires (23.6%).
Fire incident types reported to NFIRS in Zip Code 62367


 Nearest zip codes: 62311, 62374, 62326, 62344, 62346, 62316.
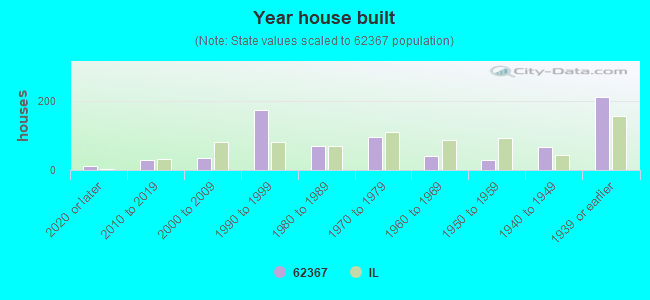


 According to the data from the years 2002 - 2018 the average number of fire incidents per year is 6. The highest number of reported fires - 15 took place in 2017, and the least - 2 in 2005. The data has a rising trend.
 When looking into fire subcategories, the most incidents belonged to: Outside Fires (48.2%), and Structure Fires (23.6%).