Estimated zip code population in 2022: 1,306 Zip code population in 2010: 1,152 Zip code population in 2000: 1,342
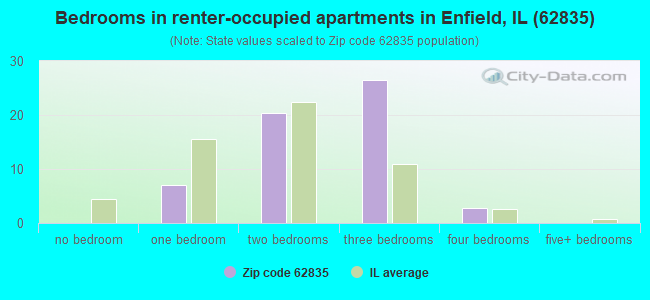
Houses and condos: 616 Renter-occupied apartments: 58
% of renters here:
11%
State:
33%
March 2022 cost of living index in zip code 62835: 84.3 (less than average, U.S. average is 100)
Land area: 72.9 sq. mi. Water area: 0.1 sq. mi.
Population density: 18 people per square mile
(very low).
OSM Map
General Map
Google Map
MSN Map
OSM Map
General Map
Google Map
MSN Map
OSM Map
General Map
Google Map
MSN Map
OSM Map
General Map
Google Map
MSN Map
Please wait while loading the map...
Real estate property taxes paid for housing units in 2022:
This zip code:
1.1% ($1,095)
Illinois:
2.0% ($4,912)
Median real estate property taxes paid for housing units with mortgages in 2022: $1,336 (1.6%) Median real estate property taxes paid for housing units with no mortgage in 2022: $921 (0.8%)
Business Search- 14 Million verified businesses
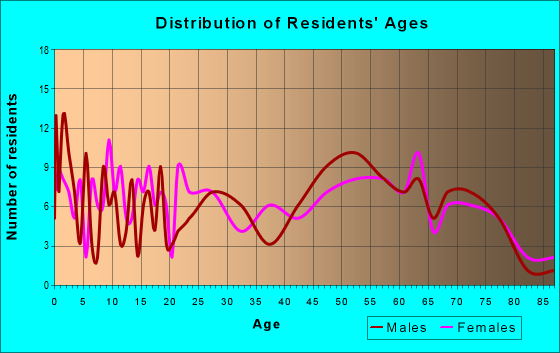
Males: 569
(43.6%)
Females: 737
(56.4%)
For population 25 years and over in 62835:
High school or higher: 86.6%
Bachelor's degree or higher: 13.8%
Graduate or professional degree: 3.4%
Unemployed: 2.2%
Mean travel time to work (commute): 27.8 minutes
For population 15 years and over in 62835:
Never married: 25.2%
Now married: 53.0%
Separated: 0.7%
Widowed: 8.8%
Divorced: 12.3%
Zip code 62835 compared to state average:
Median household income below state average.
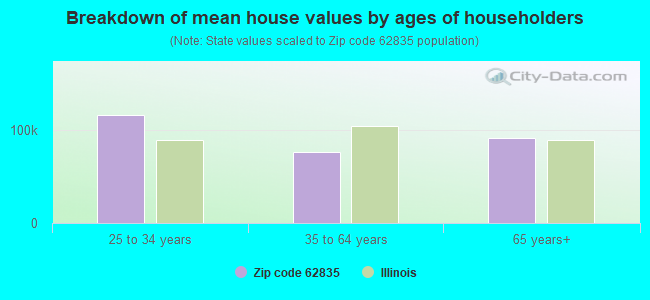
Median house value significantly below state average.
Unemployed percentage below state average.
Black race population percentage significantly below state average.
Hispanic race population percentage significantly below state average.
Median age above state average.
Foreign-born population percentage significantly below state average.
Renting percentage significantly below state average.
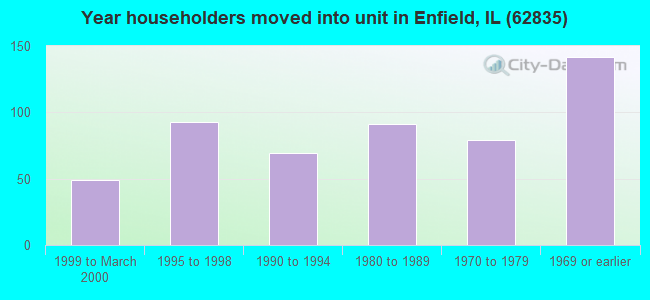
Length of stay since moving in significantly above state average.
Percentage of population with a bachelor's degree or higher significantly below state average.
Averages for the 2020 tax year for zip code 62835, filed in 2021:
Average Adjusted Gross Income (AGI) in 2020: $51,810 (Individual Income Tax Returns)
Here:
$51,810
State:
$82,626
Salary/wage: $42,903 (reported on 74.0% of returns)
Here:
$42,903
State:
$66,640
(% of AGI for various income ranges: 1109.2% for AGIs below $25k, 3114.4% for AGIs $25k-50k, 5450.0% for AGIs $50k-75k, 8802.5% for AGIs $75k-100k, 16126.7% for AGIs $100k-200k)
Taxable interest for individuals: $1,018 (reported on 34.0% of returns)
This zip code:
$1,018
Illinois:
$2,376
(% of AGI for various income ranges: 16.9% for AGIs below $25k, 17.8% for AGIs $25k-50k, 91.7% for AGIs $50k-75k, 35.0% for AGIs $75k-100k, 220.0% for AGIs $100k-200k)
Ordinary dividends: $3,825 (reported on 16.0% of returns)
Here:
$3,825
State:
$9,061
(% of AGI for various income ranges: 5.4% for AGIs below $25k, 141.7% for AGIs $50k-75k, 713.3% for AGIs $100k-200k)
Net capital gain/loss in AGI: +$5,129 (reported on 14.0% of returns)
Here:
+$5,129
State:
+$31,684
(% of AGI for various income ranges: 1250.0% for AGIs $100k-200k)
Profit/loss from business: +$5,160 (reported on 10.0% of returns)
Here:
+$5,160
State:
+$12,175
(% of AGI for various income ranges: 105.4% for AGIs below $25k, 302.5% for AGIs $75k-100k)
Taxable individual retirement arrangement distribution: $11,175 (reported on 8.0% of returns)
62835:
$11,175
Illinois:
$21,613
(% of AGI for various income ranges: 745.0% for AGIs $50k-75k)
Earned income credit: $2,586 (reported on 14.0% of returns)
Here:
$2,586
State:
$2,311
(% of AGI for various income ranges: 101.5% for AGIs below $25k, 54.4% for AGIs $25k-50k)
Percentage of individuals using paid preparers for their 2020 taxes: 94.0%
Here:
94%
State:
93%
(% for various income ranges: 94.4% for AGIs below $25k, 100.0% for AGIs $25k-50k, 87.5% for AGIs $50k-75k, 100.0% for AGIs $75k-100k, 85.7% for AGIs $100k-200k)
Averages for the 2012 tax year for zip code 62835, filed in 2013:
Average Adjusted Gross Income (AGI) in 2012: $55,696 (Individual Income Tax Returns)
Here:
$55,696
State:
$68,058
Salary/wage: $37,733 (reported on 78.0% of returns)
Here:
$37,733
State:
$55,396
(% of AGI for various income ranges: 66.8% for AGIs below $25k, 74.3% for AGIs $25k-50k, 59.7% for AGIs $50k-75k, 75.9% for AGIs $75k-100k, 29.9% for AGIs $100k-200k)
Taxable interest for individuals: $1,310 (reported on 40.0% of returns)
This zip code:
$1,310
Illinois:
$1,969
(% of AGI for various income ranges: 2.0% for AGIs below $25k, 0.7% for AGIs $25k-50k, 1.1% for AGIs $50k-75k, 0.2% for AGIs $75k-100k, 1.0% for AGIs $100k-200k)
Ordinary dividends: $2,955 (reported on 22.0% of returns)
Here:
$2,955
State:
$7,786
(% of AGI for various income ranges: 0.4% for AGIs below $25k, 1.5% for AGIs $50k-75k, 2.1% for AGIs $100k-200k)
Profit/loss from business: +$13,562 (reported on 16.0% of returns)
Here:
+$13,562
State:
+$12,903
(% of AGI for various income ranges: 8.5% for AGIs below $25k, 3.8% for AGIs $50k-75k, 5.9% for AGIs $100k-200k)
Taxable individual retirement arrangement distribution: $8,767 (reported on 6.0% of returns)
62835:
$8,767
Illinois:
$17,929
Total itemized deductions: $23,457 (20% of AGI, reported on 14.0% of returns)
Here:
$23,457
State:
$26,433
Here:
19.9% of AGI
State:
19.2% of AGI
Charity contributions: $8,480 (reported on 10.0% of returns)
Here:
$8,480
State:
$4,525
Taxes paid: $6,657 (reported on 14.0% of returns)
62835:
$6,657
State:
$11,968
Earned income credit: $2,478 (reported on 18.0% of returns)
Here:
$2,478
State:
$2,349
(% of AGI for various income ranges: 9.1% for AGIs below $25k)
Percentage of individuals using paid preparers for their 2012 taxes: 70.0%
Here:
70%
State:
57%
(% for various income ranges: 63.2% for AGIs below $25k, 72.7% for AGIs $25k-50k, 66.7% for AGIs $50k-75k, 80.0% for AGIs $75k-100k, 83.3% for AGIs $100k-200k)
Averages for the 2004 tax year for zip code 62835, filed in 2005:
Average Adjusted Gross Income (AGI) in 2004: $32,271 (Individual Income Tax Returns)
Here:
$32,271
State:
$54,625
Salary/wage: $28,411 (reported on 80.6% of returns)
Here:
$28,411
State:
$46,811
(% of AGI for various income ranges: 96.8% for AGIs below $10k, 69.0% for AGIs $10k-25k, 78.7% for AGIs $25k-50k, 83.7% for AGIs $50k-75k, 65.1% for AGIs $75k-100k, 31.9% for AGIs over 100k)
Taxable interest for individuals: $1,871 (reported on 50.0% of returns)
This zip code:
$1,871
Illinois:
$2,101
(% of AGI for various income ranges: 9.7% for AGIs below $10k, 4.4% for AGIs $10k-25k, 3.8% for AGIs $25k-50k, 1.4% for AGIs $50k-75k, 2.0% for AGIs $75k-100k, 1.6% for AGIs over 100k)
Taxable dividends: $1,391 (reported on 22.9% of returns)
Here:
$1,391
State:
$4,306
(% of AGI for various income ranges: 3.4% for AGIs below $10k, 0.7% for AGIs $10k-25k, 0.5% for AGIs $25k-50k, 0.7% for AGIs $50k-75k, 3.1% for AGIs $75k-100k)
Net capital gain/loss: +$765 (reported on 12.2% of returns)
Here:
+$765
State:
+$17,321
(% of AGI for various income ranges: 7.5% for AGIs below $10k, 0.2% for AGIs $10k-25k, 0.2% for AGIs $25k-50k, 0.0% for AGIs $50k-75k)
Profit/loss from business: +$4,827 (reported on 13.4% of returns)
Here:
+$4,827
State:
+$11,771
(% of AGI for various income ranges: 8.4% for AGIs below $10k, 2.7% for AGIs $10k-25k, 2.9% for AGIs $25k-50k, 1.3% for AGIs $50k-75k, 1.3% for AGIs $75k-100k)
IRA payment deduction: $2,900 (reported on 1.8% of returns)
62835:
$2,900
Illinois:
$3,087
Total itemized deductions: $13,923 (22% of AGI, reported on 9.3% of returns)
Here:
$13,923
State:
$20,239
Here:
22.3% of AGI
State:
19.5% of AGI
Charity contributions deductions: $2,722 (4% of AGI, reported on 6.5% of returns)
Here:
$2,722
State:
$3,719
Here:
4.0% of AGI
State:
3.4% of AGI
Total tax: $3,940 (reported on 71.3% of returns)
62835:
$3,940
State:
$9,882
(% of AGI for various income ranges: 3.4% for AGIs below $10k, 3.7% for AGIs $10k-25k, 6.9% for AGIs $25k-50k, 9.9% for AGIs $50k-75k, 12.1% for AGIs $75k-100k, 13.8% for AGIs over 100k)
Earned income credit: $1,744 (reported on 16.1% of returns)
Here:
$1,744
State:
$1,788
Percentage of individuals using paid preparers for their 2004 taxes: 69.7%
Here:
70%
State:
61%
(% for various income ranges: 64.9% for AGIs below $10k, 68.9% for AGIs $10k-25k, 69.9% for AGIs $25k-50k, 80.5% for AGIs $50k-75k, 100.0% for AGIs $75k-100k)
Household received Food Stamps/SNAP in the past 12 months: 137 Household did not receive Food Stamps/SNAP in the past 12 months: 406
Women who had a birth in the past 12 months: 10 (8 now married, 1 unmarried) Women who did not have a birth in the past 12 months: 310 (82 now married, 229 unmarried)
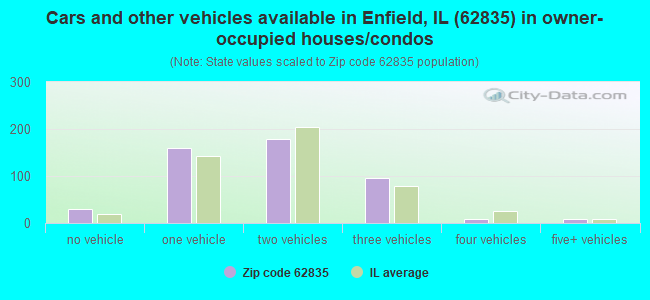
Housing units in zip code 62835 with a mortgage: 164 (3 second mortgage, 2 both second mortgage and home equity loan) Median monthly owner costs for units with a mortgage: $1,138 Median monthly owner costs for units without a mortgage: $510
Residents with income below the poverty level in 2022:
This zip code:
7.4%
Whole state:
11.9%
Residents with income below 50% of the poverty level in 2022:
This zip code:
5.0%
Whole state:
5.7%
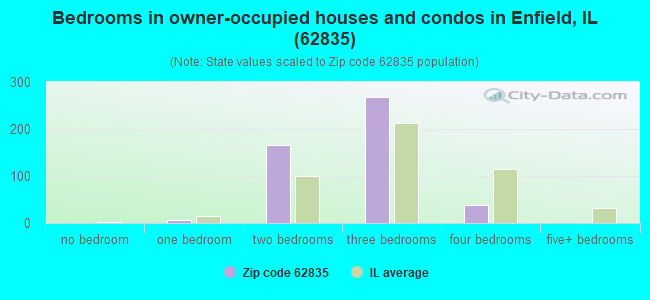
Median number of rooms in houses and condos:
Here:
5.5
State:
6.4
Median number of rooms in apartments:
Here:
4.7
State:
4.1
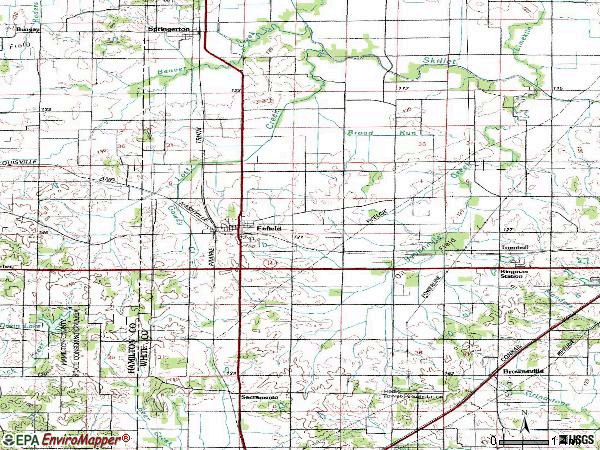
Notable locations in this zip code not listed on our city pages
Churches in zip code 62835 include: Asbury Church (A), Bethel Church (B), Burnt Prairie Church (C), Saint Patricks Church (D), Sharon Church (E), Wesley Chapel (F), West Union Church (G). Display/hide their locations on the map
Cemeteries: Johnson Cemetery (1), Little Zion Cemetery (2), Hopkins Cemetery (3), McLntosh Cemetery (4), Munsell Cemetery (5), Prince Cemetery (6), Kitty Sweeten Cemetery (7). Display/hide their locations on the map
In group quarters: 28 (-1 institutionalized population)
Size of family households: 239 2-persons, 69 3-persons, 20 4-persons, 48 5-persons, 3 7-or-more-persons
Size of nonfamily households: 127 1-person, 18 2-persons, 6 3-persons
183 married couples with children.
45 single-parent households (2 men, 43 women).
99.2% of residents of 62835 zip code speak English at home.
1.0% of residents speak Spanish at home (67% very well, 33% not at all).
0.1% of residents speak other Indo-European language at home (100% very well).
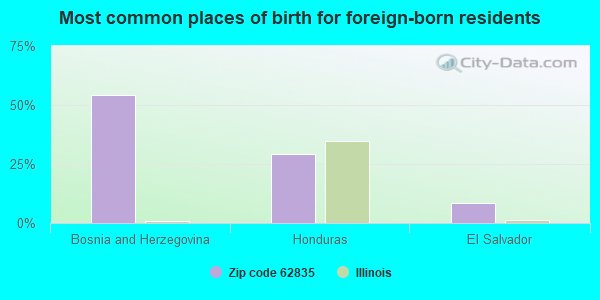
Foreign born population: 24 (1.8%) (75.2% of them are naturalized citizens)
This zip code:
1.8%
Whole state:
14.4%
54%Bosnia and Herzegovina
29%Honduras
8%El Salvador
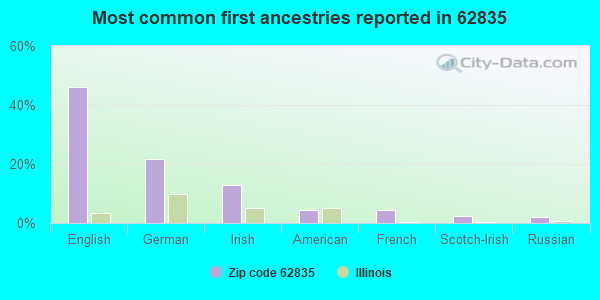
46%English
22%German
13%Irish
5%American
4%French
3%Scotch-Irish
2%Russian
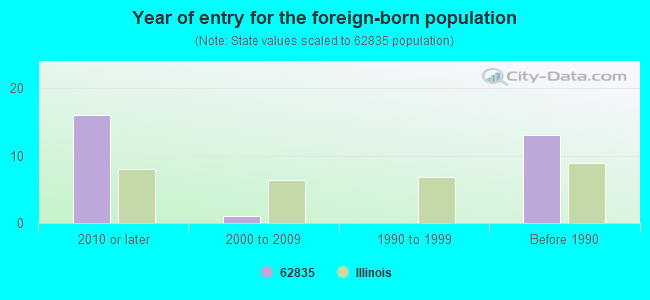
Year of entry for the foreign-born population
162010 or later
12000 to 2009
01990 to 1999
13Before 1990
Facilities with environmental interests located in this zip code:
PLAINS PIPELINE LP (RURAL in ENFIELD, IL)
STATE MASTER (Illinois EPA Project) - AIR PROGRAM AIR MINOR (AIRS/AFS) CRITERIA AND HAZARDOUS AIR POLLUTANT INVENTORY (Inventory of air pollution sources) Business SIC classification: CRUDE PETROLEUM PIPELINES Business NAICS classification: PIPELINE TRANSPORTATION OF CRUDE OIL. Alternative names: PLAINS MARKETING L.P.
COUNTRYMARK COOPERATIVE, LLP (SECTION 29 in ENFIELD TWP., IL)
STATE MASTER (Illinois EPA Project) - AIR PROGRAM AIR MINOR (AIRS/AFS) CRITERIA AND HAZARDOUS AIR POLLUTANT INVENTORY (Inventory of air pollution sources) Business SIC classification: CRUDE PETROLEUM PIPELINES Business NAICS classification: PIPELINE TRANSPORTATION OF CRUDE OIL. Alternative names: FARM BUREAU OIL COMPANY
IDOT (611 1ST ST in ENFIELD, IL)
STATE MASTER (Illinois EPA Project) - HAZARDOUS WASTE PROGRAM Conditionally Exempt Small Quantity Generators, less than 100 kg/month of hazardous waste (Resource Conservation and Recovery Act (tracking hazardous waste))
MARATHON PIPELINE CO (SEC 29 T5S-R8E in ENFIELD, IL)
STATE MASTER (Illinois EPA Project) - SOLID WASTE PROGRAM, AIR PROGRAM AIR MINOR (AIRS/AFS) Business SIC classification: REFINED PETROLEUM PIPELINES
BOOTH ELEMENTARY SCHOOL (PO BOX 39 in ENFIELD, IL)
(Geographic Names Information System) (National Center for Education Statistics) - STATE ID-2009700302003 Organizations: NORRIS CITY-OMAHA-ENFIELD CUSD 3 (SCHOOL DISTRICT)
IDOT (BRIDGE 097-0024 in ENFIELD, IL)
Small Quantity Generators, between 100 kg and 1000 kg of hazardous waste/month (Resource Conservation and Recovery Act (tracking hazardous waste)) - notification
Housing units lacking complete plumbing facilities: 3.7% Housing units lacking complete kitchen facilities: 5.8%
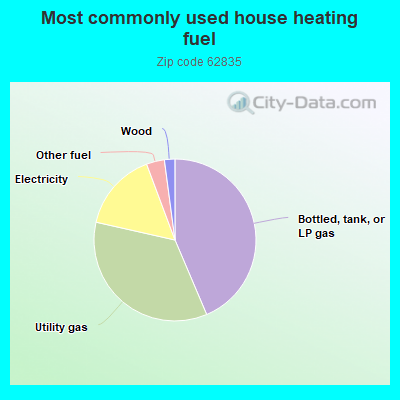
43.7%Bottled, tank, or LP gas
35.0%Utility gas
15.8%Electricity
3.6%Other fuel
2.1%Wood
Population in 1990: 1,145. Population change in the 1990s: +197 (+17.2%).
Place of birth for U.S.-born residents:
This state: 929
Northeast: 4
Midwest: 279
South: 52
West: 9
81% of the 62835 zip code residents lived in the same house 5 years ago. Out of people who lived in different houses, 52% lived in this county. Out of people who lived in different counties, 50% lived in Illinois.
98% of the 62835 zip code residents lived in the same house 1 year ago. Out of people who lived in different houses, 78% moved from this county. Out of people who lived in different houses, 22% moved from different county within same state.
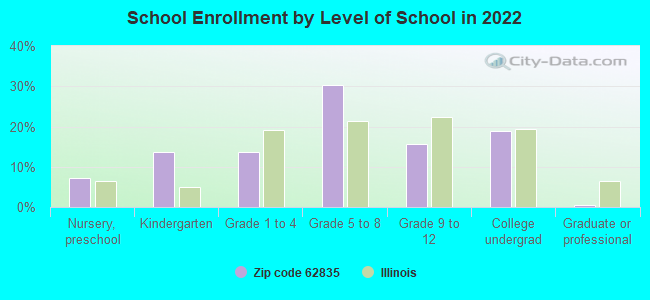
Private vs. public school enrollment:
Students in private schools in grades 1 to 8 (elementary and middle school): 3
Here:
3.4%
Illinois:
13.3%
Students in private schools in grades 9 to 12 (high school):
Here:
0.0%
Illinois:
9.9%
Students in private undergraduate colleges:
Here:
0.0%
Illinois:
27.4%
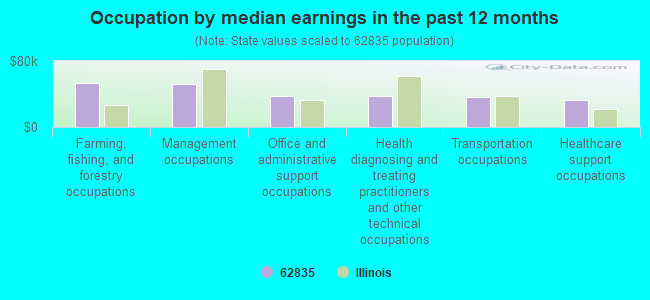
Occupation by median earnings in the past 12 months ($)
52,936Farming, fishing, and forestry occupations
52,597Management occupations
38,002Office and administrative support occupations
37,436Health diagnosing and treating practitioners and other technical occupations
36,905Transportation occupations
32,847Healthcare support occupations
Top industries in this zip code by the number of employees in 2005:
Health Care and Social Assistance: Other Individual and Family Services (20-49 employees: 1 establishment)
Health Care and Social Assistance: Nursing Care Facilities (20-49: 1)
Accommodation and Food Services: Full-Service Restaurants (10-19: 1)
Accommodation and Food Services: Limited-Service Restaurants (5-9: 1)
Wholesale Trade: Grain and Field Bean Merchant Wholesalers (5-9: 1)
Mining: Crude Petroleum and Natural Gas Extraction (5-9: 1)
People in group quarters in 2010:
30 people in nursing facilities/skilled-nursing facilities
14 people in residential treatment centers for adults
People in group quarters in 2000:
39 people in nursing homes
18 people in homes or halfway houses for drug/alcohol abuse
2003 - 2018 National Fire Incident Reporting System (NFIRS) incidents
According to the data from the years 2003 - 2018 the average number of fires per year is 9. The highest number of reported fires - 18 took place in 2012, and the least - 0 in 2004. The data has a rising trend.
When looking into fire subcategories, the most reports belonged to: Outside Fires (43.7%), and Structure Fires (43.0%).
Fire incident types reported to NFIRS in Zip Code 62835


 Nearest zip codes: 62887, 62862, 62869, 62820, 62809, 62821.


 According to the data from the years 2003 - 2018 the average number of fires per year is 9. The highest number of reported fires - 18 took place in 2012, and the least - 0 in 2004. The data has a rising trend.
 When looking into fire subcategories, the most reports belonged to: Outside Fires (43.7%), and Structure Fires (43.0%).