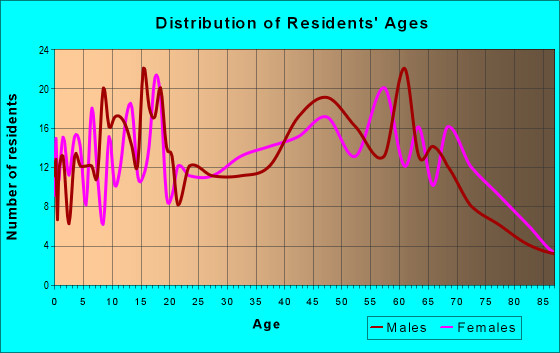
Estimated zip code population in 2022: 2,481 Zip code population in 2010: 2,305 Zip code population in 2000: 2,639
Houses and condos: 1,224 Renter-occupied apartments: 195
% of renters here:
19%
State:
33%
March 2022 cost of living index in zip code 62917: 83.4 (less than average, U.S. average is 100)
Land area: 32.1 sq. mi. Water area: 1.3 sq. mi.
Population density: 77 people per square mile
(very low).
OSM Map
General Map
Google Map
MSN Map
OSM Map
General Map
Google Map
MSN Map
OSM Map
General Map
Google Map
MSN Map
OSM Map
General Map
Google Map
MSN Map
Please wait while loading the map...
Real estate property taxes paid for housing units in 2022:
This zip code:
1.2% ($941)
Illinois:
2.0% ($4,912)
Median real estate property taxes paid for housing units with mortgages in 2022: $1,878 (2.0%) Median real estate property taxes paid for housing units with no mortgage in 2022: $409 (0.7%)
Averages for the 2020 tax year for zip code 62917, filed in 2021:
Average Adjusted Gross Income (AGI) in 2020: $56,845 (Individual Income Tax Returns)
Here:
$56,845
State:
$82,626
Salary/wage: $42,825 (reported on 79.2% of returns)
Here:
$42,825
State:
$66,640
(% of AGI for various income ranges: 1104.6% for AGIs below $25k, 3168.4% for AGIs $25k-50k, 5782.7% for AGIs $50k-75k, 8368.6% for AGIs $75k-100k, 14018.8% for AGIs $100k-200k)
Taxable interest for individuals: $1,046 (reported on 29.2% of returns)
This zip code:
$1,046
Illinois:
$2,376
(% of AGI for various income ranges: 11.1% for AGIs below $25k, 27.9% for AGIs $25k-50k, 12.7% for AGIs $50k-75k, 40.0% for AGIs $75k-100k, 208.8% for AGIs $100k-200k)
Ordinary dividends: $2,527 (reported on 11.5% of returns)
Here:
$2,527
State:
$9,061
(% of AGI for various income ranges: 31.4% for AGIs below $25k, 59.1% for AGIs $50k-75k, 156.2% for AGIs $100k-200k)
Net capital gain/loss in AGI: +$2,990 (reported on 10.4% of returns)
Here:
+$2,990
State:
+$31,684
(% of AGI for various income ranges: 11.1% for AGIs below $25k, 23.6% for AGIs $50k-75k, 302.5% for AGIs $100k-200k)
Profit/loss from business: +$6,336 (reported on 11.5% of returns)
Here:
+$6,336
State:
+$12,175
(% of AGI for various income ranges: 63.6% for AGIs below $25k, 108.9% for AGIs $25k-50k, 154.5% for AGIs $50k-75k, 177.5% for AGIs $100k-200k)
Taxable individual retirement arrangement distribution: $12,989 (reported on 9.4% of returns)
62917:
$12,989
Illinois:
$21,613
(% of AGI for various income ranges: 116.1% for AGIs below $25k, 410.9% for AGIs $50k-75k, 490.0% for AGIs $100k-200k)
Earned income credit: $2,400 (reported on 20.8% of returns)
Here:
$2,400
State:
$2,311
(% of AGI for various income ranges: 113.9% for AGIs below $25k, 84.7% for AGIs $25k-50k)
Percentage of individuals using paid preparers for their 2020 taxes: 97.9%
Here:
98%
State:
93%
(% for various income ranges: 97.2% for AGIs below $25k, 100.0% for AGIs $25k-50k, 100.0% for AGIs $50k-75k, 100.0% for AGIs $75k-100k, 91.7% for AGIs $100k-200k)
Averages for the 2012 tax year for zip code 62917, filed in 2013:
Average Adjusted Gross Income (AGI) in 2012: $39,597 (Individual Income Tax Returns)
Here:
$39,597
State:
$68,058
Salary/wage: $36,798 (reported on 79.6% of returns)
Here:
$36,798
State:
$55,396
(% of AGI for various income ranges: 68.1% for AGIs below $25k, 74.1% for AGIs $25k-50k, 73.4% for AGIs $50k-75k, 77.4% for AGIs $75k-100k, 74.7% for AGIs $100k-200k)
Taxable interest for individuals: $1,048 (reported on 30.1% of returns)
This zip code:
$1,048
Illinois:
$1,969
(% of AGI for various income ranges: 1.8% for AGIs below $25k, 1.1% for AGIs $25k-50k, 0.4% for AGIs $50k-75k, 0.2% for AGIs $75k-100k, 0.9% for AGIs $100k-200k)
Ordinary dividends: $1,757 (reported on 13.6% of returns)
Here:
$1,757
State:
$7,786
(% of AGI for various income ranges: 1.2% for AGIs below $25k, 0.8% for AGIs $25k-50k, 0.2% for AGIs $50k-75k, 0.9% for AGIs $75k-100k)
Net capital gain/loss in AGI: +$912 (reported on 7.8% of returns)
Here:
+$912
State:
+$22,183
Profit/loss from business: +$6,671 (reported on 13.6% of returns)
Here:
+$6,671
State:
+$12,903
(% of AGI for various income ranges: 7.5% for AGIs below $25k, 6.2% for AGIs $25k-50k)
Taxable individual retirement arrangement distribution: $11,167 (reported on 8.7% of returns)
62917:
$11,167
Illinois:
$17,929
(% of AGI for various income ranges: 3.0% for AGIs below $25k, 5.0% for AGIs $25k-50k, 4.2% for AGIs $75k-100k)
Total itemized deductions: $17,050 (24% of AGI, reported on 13.6% of returns)
Here:
$17,050
State:
$26,433
Here:
23.7% of AGI
State:
19.2% of AGI
(% of AGI for various income ranges: 7.3% for AGIs $25k-50k, 6.1% for AGIs $50k-75k, 5.9% for AGIs $75k-100k, 7.8% for AGIs $100k-200k)
Charity contributions: $5,350 (reported on 9.7% of returns)
Here:
$5,350
State:
$4,525
(% of AGI for various income ranges: 2.2% for AGIs below $25k, 1.3% for AGIs $50k-75k, 1.2% for AGIs $75k-100k, 2.2% for AGIs $100k-200k)
Taxes paid: $4,914 (reported on 13.6% of returns)
62917:
$4,914
State:
$11,968
(% of AGI for various income ranges: 1.0% for AGIs $25k-50k, 1.8% for AGIs $50k-75k, 1.8% for AGIs $75k-100k, 3.2% for AGIs $100k-200k)
Earned income credit: $2,419 (reported on 25.2% of returns)
Here:
$2,419
State:
$2,349
(% of AGI for various income ranges: 9.0% for AGIs below $25k, 1.4% for AGIs $25k-50k)
Percentage of individuals using paid preparers for their 2012 taxes: 67.0%
Here:
67%
State:
57%
(% for various income ranges: 65.2% for AGIs below $25k, 64.0% for AGIs $25k-50k, 71.4% for AGIs $50k-75k, 72.7% for AGIs $75k-100k, 71.4% for AGIs $100k-200k)
Averages for the 2004 tax year for zip code 62917, filed in 2005:
Average Adjusted Gross Income (AGI) in 2004: $28,914 (Individual Income Tax Returns)
Here:
$28,914
State:
$54,625
Salary/wage: $27,088 (reported on 84.0% of returns)
Here:
$27,088
State:
$46,811
(% of AGI for various income ranges: 108.0% for AGIs below $10k, 69.5% for AGIs $10k-25k, 80.1% for AGIs $25k-50k, 85.0% for AGIs $50k-75k, 84.6% for AGIs $75k-100k, 48.5% for AGIs over 100k)
Taxable interest for individuals: $1,453 (reported on 33.8% of returns)
This zip code:
$1,453
Illinois:
$2,101
(% of AGI for various income ranges: 6.2% for AGIs below $10k, 2.9% for AGIs $10k-25k, 2.2% for AGIs $25k-50k, 0.7% for AGIs $50k-75k, 0.7% for AGIs $75k-100k, 0.3% for AGIs over 100k)
Taxable dividends: $839 (reported on 13.3% of returns)
Here:
$839
State:
$4,306
(% of AGI for various income ranges: 1.5% for AGIs below $10k, 0.6% for AGIs $10k-25k, 0.3% for AGIs $25k-50k, 0.4% for AGIs $50k-75k, 0.3% for AGIs $75k-100k)
Net capital gain/loss: +$567 (reported on 8.7% of returns)
Here:
+$567
State:
+$17,321
(% of AGI for various income ranges: 2.8% for AGIs below $10k, 0.2% for AGIs $10k-25k, 0.2% for AGIs $25k-50k, -0.0% for AGIs $50k-75k)
Profit/loss from business: +$3,460 (reported on 13.3% of returns)
Here:
+$3,460
State:
+$11,771
(% of AGI for various income ranges: 9.3% for AGIs below $10k, 2.0% for AGIs $10k-25k, 1.9% for AGIs $25k-50k, 1.3% for AGIs $50k-75k)
IRA payment deduction: $3,048 (reported on 2.0% of returns)
62917:
$3,048
Illinois:
$3,087
Total itemized deductions: $13,697 (26% of AGI, reported on 10.6% of returns)
Here:
$13,697
State:
$20,239
Here:
25.7% of AGI
State:
19.5% of AGI
(% of AGI for various income ranges: 4.9% for AGIs $10k-25k, 5.9% for AGIs $25k-50k, 3.7% for AGIs $50k-75k, 4.0% for AGIs $75k-100k, 9.6% for AGIs over 100k)
Charity contributions deductions: $3,250 (6% of AGI, reported on 8.1% of returns)
Here:
$3,250
State:
$3,719
Here:
5.9% of AGI
State:
3.4% of AGI
(% of AGI for various income ranges: 0.8% for AGIs $10k-25k, 1.1% for AGIs $25k-50k, 1.0% for AGIs $50k-75k, 2.2% for AGIs over 100k)
Total tax: $3,244 (reported on 67.0% of returns)
62917:
$3,244
State:
$9,882
(% of AGI for various income ranges: 2.5% for AGIs below $10k, 3.3% for AGIs $10k-25k, 6.0% for AGIs $25k-50k, 8.6% for AGIs $50k-75k, 10.5% for AGIs $75k-100k, 16.4% for AGIs over 100k)
Earned income credit: $1,685 (reported on 24.9% of returns)
Here:
$1,685
State:
$1,788
Percentage of individuals using paid preparers for their 2004 taxes: 72.2%
Here:
72%
State:
61%
(% for various income ranges: 68.4% for AGIs below $10k, 73.2% for AGIs $10k-25k, 76.8% for AGIs $25k-50k, 71.4% for AGIs $50k-75k, 55.8% for AGIs $75k-100k, 86.7% for AGIs over 100k)
Household received Food Stamps/SNAP in the past 12 months: 245 Household did not receive Food Stamps/SNAP in the past 12 months: 787
Women who had a birth in the past 12 months: 24 (10 now married, 13 unmarried) Women who did not have a birth in the past 12 months: 387 (213 now married, 172 unmarried)
Housing units in zip code 62917 with a mortgage: 358 (9 second mortgage, 8 both second mortgage and home equity loan) Median monthly owner costs for units with a mortgage: $960 Median monthly owner costs for units without a mortgage: $385
Residents with income below the poverty level in 2022:
This zip code:
19.0%
Whole state:
11.9%
Residents with income below 50% of the poverty level in 2022:
This zip code:
11.4%
Whole state:
5.7%
Median number of rooms in houses and condos:
Here:
5.9
State:
6.4
Median number of rooms in apartments:
Here:
4.7
State:
4.1
Notable locations in this zip code not listed on our city pages
Churches in zip code 62917 include: Bethel Church (A), Providence Church (B), South America Church (C), Spring Grove Church (D), Lakeview Church (E), Macedonia Church (F), Mount Zion Church (G). Display/hide their locations on the map
In group quarters: 24 (-1 institutionalized population)
Size of family households: 482 2-persons, 87 3-persons, 65 4-persons, 36 5-persons, 9 6-persons, 34 7-or-more-persons
Size of nonfamily households: 277 1-person, 24 2-persons, 4 3-persons
296 married couples with children.
60 single-parent households (30 men, 30 women).
91.0% of residents of 62917 zip code speak English at home.
1.7% of residents speak Spanish at home (74% very well, 26% well).
5.6% of residents speak other Indo-European language at home (100% very well).
1.6% of residents speak Asian or Pacific Island language at home (100% very well).
Foreign born population: 51 (2.1%) (72.7% of them are naturalized citizens)
This zip code:
2.1%
Whole state:
14.4%
67%Malaysia
18%Honduras
16%Irish
9%Italian
8%American
7%German
7%English
3%Dutch
1%Polish
Year of entry for the foreign-born population
162010 or later
02000 to 2009
201990 to 1999
15Before 1990
Facilities with environmental interests located in this zip code:
OLD DELTA TIPPLE (RTE 13 & DYKERSVILLE RD S in CARRIER MILLS, IL)
STATE MASTER (Illinois EPA Project) - HAZARDOUS WASTE PROGRAM (Resource Conservation and Recovery Act (tracking hazardous waste)) Organizations: MCCUAN JOHN K (CONTACT/OWNER)
DAVE ANGELLY AUTO BODY (8675 RTE 13 W in CARRIER MILLS, IL)
STATE MASTER (Illinois EPA Project) - HAZARDOUS WASTE PROGRAM Conditionally Exempt Small Quantity Generators, less than 100 kg/month of hazardous waste (Resource Conservation and Recovery Act (tracking hazardous waste)) Organizations: DAVE ANGELLY AUTOBODY (CONTACT/OPERATOR)
Alternative names: DAVE ANGELLY AUTOBODY
SAHARA COAL CO INC (SAHARA MINE # 6 in CARRIER MILLS TWP, IL)
STATE MASTER (Illinois EPA Project) - SOLID WASTE PROGRAM, AIR PROGRAM AIR MINOR (AIRS/AFS) Business SIC classification: NONCLASSIFIABLE ESTABLISHMENTS
Housing units lacking complete plumbing facilities: 0.1% Housing units lacking complete kitchen facilities: 1.1%
44.2%Utility gas
40.2%Electricity
12.6%Bottled, tank, or LP gas
2.1%Wood
1.0%No fuel used
Population in 1990: 3,355.
Place of birth for U.S.-born residents:
This state: 1,834
Northeast: 4
Midwest: 254
South: 256
West: 68
62% of the 62917 zip code residents lived in the same house 5 years ago. Out of people who lived in different houses, 75% lived in this county. Out of people who lived in different counties, 50% lived in Illinois.
90% of the 62917 zip code residents lived in the same house 1 year ago. Out of people who lived in different houses, 51% moved from this county. Out of people who lived in different houses, 13% moved from different county within same state. Out of people who lived in different houses, 37% moved from different state.
Private vs. public school enrollment:
Students in private schools in grades 1 to 8 (elementary and middle school): 5
Here:
3.0%
Illinois:
13.3%
Students in private schools in grades 9 to 12 (high school): 5
Here:
6.7%
Illinois:
9.9%
Students in private undergraduate colleges: 16
Here:
33.4%
Illinois:
27.4%
Occupation by median earnings in the past 12 months ($)
89,093Installation, maintenance, and repair occupations
86,148Health technologists and technicians
66,420Management occupations
64,746Health diagnosing and treating practitioners and other technical occupations
44,523Computer and mathematical occupations
38,643Healthcare support occupations
Top industries in this zip code by the number of employees in 2005:
Health Care and Social Assistance: Nursing Care Facilities (50-99 employees: 1 establishment)
Construction: New Single-Family Housing Construction (except Operative Builders) (10-19: 1, 1-4: 1)
Construction: Plumbing, Heating, and Air-Conditioning Contractors (10-19: 1, 1-4: 1)
Finance and Insurance: Commercial Banking (10-19: 1)
Wholesale Trade: Construction and Mining (except Oil Well) Machinery and Equipment Merchant Wholesalers (10-19: 1)
Information: Cable and Other Program Distribution (5-9: 2)
Other Services (except Public Administration): Religious Organizations (5-9: 1, 1-4: 3)
People in group quarters in 2000:
91 people in nursing homes
6 people in other noninstitutional group quarters
Fatal accident statistics in 2014:
Fatal accident count: 2
Vehicles involved in fatal accidents: 3
Fatal accidents caused by drunken drivers: 1
Fatalities: 2
Persons involved in fatal accidents: 4
Pedestrians involved in fatal accidents: 0
2002 - 2018 National Fire Incident Reporting System (NFIRS) incidents
Based on the data from the years 2002 - 2018 the average number of fires per year is 23. The highest number of reported fires - 41 took place in 2012, and the least - 12 in 2008. The data has a decreasing trend.
When looking into fire subcategories, the most incidents belonged to: Outside Fires (43.7%), and Structure Fires (42.6%).
Fire incident types reported to NFIRS in Zip Code 62917


 Nearest zip codes: 62987, 62946, 62967, 62935, 62965, 62974.


 Based on the data from the years 2002 - 2018 the average number of fires per year is 23. The highest number of reported fires - 41 took place in 2012, and the least - 12 in 2008. The data has a decreasing trend.
 When looking into fire subcategories, the most incidents belonged to: Outside Fires (43.7%), and Structure Fires (42.6%).