Estimated zip code population in 2022: 1,527 Zip code population in 2010: 1,663 Zip code population in 2000: 1,386
Houses and condos: 687 Renter-occupied apartments: 63
% of renters here:
11%
State:
32%
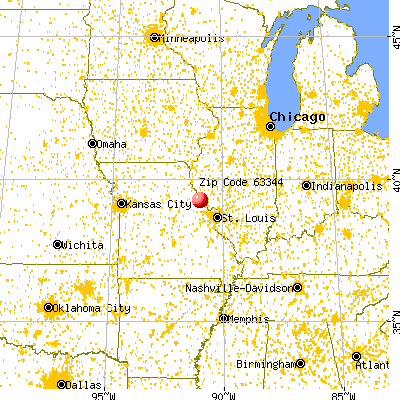
March 2022 cost of living index in zip code 63344: 76.7 (low, U.S. average is 100)
Land area: 78.5 sq. mi. Water area: 0.3 sq. mi.
Population density: 19 people per square mile
(very low).
OSM Map
General Map
Google Map
MSN Map
OSM Map
General Map
Google Map
MSN Map
OSM Map
General Map
Google Map
MSN Map
OSM Map
General Map
Google Map
MSN Map
Please wait while loading the map...
Real estate property taxes paid for housing units in 2022:
This zip code:
0.7% ($1,327)
Missouri:
0.8% ($1,810)
Median real estate property taxes paid for housing units with mortgages in 2022: $1,722 (0.8%) Median real estate property taxes paid for housing units with no mortgage in 2022: $1,074 (0.8%)
Business Search- 14 Million verified businesses
Males: 736
(48.2%)
Females: 791
(51.8%)
For population 25 years and over in 63344:
High school or higher: 94.1%
Bachelor's degree or higher: 23.6%
Graduate or professional degree: 6.2%
Unemployed: 2.9%
Mean travel time to work (commute): 25.4 minutes
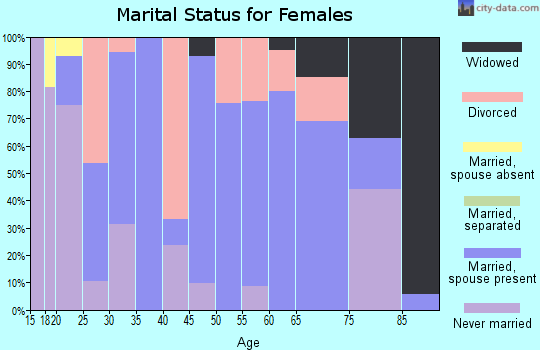
For population 15 years and over in 63344:
Never married: 22.9%
Now married: 62.8%
Separated: 0.2%
Widowed: 4.6%
Divorced: 9.4%
Zip code 63344 compared to state average:
Black race population percentage significantly below state average.
Hispanic race population percentage significantly below state average.
Median age above state average.
Foreign-born population percentage significantly below state average.
Renting percentage significantly below state average.
Length of stay since moving in significantly above state average.
Estimated median house/condo value in 2022: $180,488
63344:
$180,488
Missouri:
$221,200
According to our research of Missouri and other state lists, there were 5 registered sex offenders living in 63344 zip code as of June 19, 2024. The ratio of all residents to sex offenders in zip code 63344 is 284 to 1. The ratio of registered sex offenders to all residents in this zip code is near the state average.
Median resident age:
This zip code:
43.2 years
Missouri median age:
39.1 years
Average household size:
This zip code:
2.6 people
Missouri:
2.4 people
Averages for the 2020 tax year for zip code 63344, filed in 2021:
Average Adjusted Gross Income (AGI) in 2020: $59,404 (Individual Income Tax Returns)
Here:
$59,404
State:
$68,151
Salary/wage: $54,225 (reported on 76.6% of returns)
Here:
$54,225
State:
$56,131
(% of AGI for various income ranges: 1202.7% for AGIs below $25k, 3300.0% for AGIs $25k-50k, 6011.2% for AGIs $50k-75k, 8870.0% for AGIs $75k-100k, 19013.8% for AGIs $100k-200k)
Taxable interest for individuals: $967 (reported on 39.0% of returns)
This zip code:
$967
Missouri:
$1,586
(% of AGI for various income ranges: 26.7% for AGIs below $25k, 28.3% for AGIs $25k-50k, 62.5% for AGIs $50k-75k, 50.0% for AGIs $75k-100k, 163.8% for AGIs $100k-200k)
Ordinary dividends: $3,161 (reported on 23.4% of returns)
Here:
$3,161
State:
$10,947
(% of AGI for various income ranges: 42.7% for AGIs below $25k, 115.0% for AGIs $25k-50k, 71.2% for AGIs $50k-75k, 97.1% for AGIs $75k-100k, 302.5% for AGIs $100k-200k)
Net capital gain/loss in AGI: +$4,768 (reported on 24.7% of returns)
Here:
+$4,768
State:
+$18,453
(% of AGI for various income ranges: 25.3% for AGIs below $25k, 93.3% for AGIs $25k-50k, 83.8% for AGIs $50k-75k, 78.6% for AGIs $75k-100k, 792.5% for AGIs $100k-200k)
Profit/loss from business: +$14,038 (reported on 16.9% of returns)
Here:
+$14,038
State:
+$12,260
(% of AGI for various income ranges: 164.7% for AGIs below $25k, 293.3% for AGIs $25k-50k, 407.5% for AGIs $50k-75k, 320.0% for AGIs $75k-100k, 845.0% for AGIs $100k-200k)
Taxable individual retirement arrangement distribution: $17,738 (reported on 10.4% of returns)
63344:
$17,738
Missouri:
$19,719
(% of AGI for various income ranges: 59.3% for AGIs below $25k, 337.5% for AGIs $25k-50k, 1321.4% for AGIs $75k-100k)
Total itemized deductions: $28,400 (reported on 5.2% of returns)
Here:
$28,400
State:
$36,651
(% of AGI for various income ranges: 1420.0% for AGIs $100k-200k)
Charity contributions: $8,033 (reported on 3.9% of returns)
Here:
$8,033
State:
$15,671
(% of AGI for various income ranges: 344.3% for AGIs $75k-100k)
Taxes paid: $9,300 (reported on 3.9% of returns)
63344:
$9,300
State:
$7,608
(% of AGI for various income ranges: 348.8% for AGIs $100k-200k)
Earned income credit: $2,291 (reported on 14.3% of returns)
Here:
$2,291
State:
$2,315
(% of AGI for various income ranges: 100.7% for AGIs below $25k, 84.2% for AGIs $25k-50k)
Percentage of individuals using paid preparers for their 2020 taxes: 89.6%
Here:
90%
State:
93%
(% for various income ranges: 91.7% for AGIs below $25k, 88.2% for AGIs $25k-50k, 83.3% for AGIs $50k-75k, 90.0% for AGIs $75k-100k, 92.9% for AGIs $100k-200k)
Averages for the 2012 tax year for zip code 63344, filed in 2013:
Average Adjusted Gross Income (AGI) in 2012: $50,303 (Individual Income Tax Returns)
Here:
$50,303
State:
$55,896
Salary/wage: $42,678 (reported on 80.9% of returns)
Here:
$42,678
State:
$46,205
(% of AGI for various income ranges: 69.7% for AGIs below $25k, 72.4% for AGIs $25k-50k, 80.3% for AGIs $50k-75k, 70.0% for AGIs $75k-100k, 59.0% for AGIs $100k-200k)
Taxable interest for individuals: $921 (reported on 41.2% of returns)
This zip code:
$921
Missouri:
$1,559
(% of AGI for various income ranges: 1.1% for AGIs below $25k, 1.1% for AGIs $25k-50k, 0.5% for AGIs $50k-75k, 0.7% for AGIs $75k-100k, 0.7% for AGIs $100k-200k)
Ordinary dividends: $3,625 (reported on 23.5% of returns)
Here:
$3,625
State:
$7,410
(% of AGI for various income ranges: 3.6% for AGIs below $25k, 2.7% for AGIs $25k-50k, 0.6% for AGIs $50k-75k, 2.6% for AGIs $75k-100k, 0.9% for AGIs $100k-200k)
Net capital gain/loss in AGI: +$2,600 (reported on 20.6% of returns)
Here:
+$2,600
State:
+$11,579
(% of AGI for various income ranges: 2.4% for AGIs below $25k, 0.5% for AGIs $25k-50k, 0.2% for AGIs $50k-75k, 1.5% for AGIs $75k-100k, 1.9% for AGIs $100k-200k)
Profit/loss from business: +$6,970 (reported on 14.7% of returns)
Here:
+$6,970
State:
+$11,688
(% of AGI for various income ranges: 5.9% for AGIs below $25k, 4.2% for AGIs $25k-50k, 2.0% for AGIs $50k-75k, 1.2% for AGIs $100k-200k)
Taxable individual retirement arrangement distribution: $12,138 (reported on 11.8% of returns)
63344:
$12,138
Missouri:
$14,773
(% of AGI for various income ranges: 4.2% for AGIs below $25k, 8.6% for AGIs $25k-50k, 6.0% for AGIs $75k-100k)
Total itemized deductions: $19,680 (22% of AGI, reported on 29.4% of returns)
Here:
$19,680
State:
$22,730
Here:
22.4% of AGI
State:
19.2% of AGI
(% of AGI for various income ranges: 14.3% for AGIs $25k-50k, 10.7% for AGIs $50k-75k, 12.1% for AGIs $75k-100k, 13.5% for AGIs $100k-200k)
Charity contributions: $3,138 (reported on 19.1% of returns)
Here:
$3,138
State:
$4,745
(% of AGI for various income ranges: 0.9% for AGIs $25k-50k, 0.8% for AGIs $50k-75k, 1.9% for AGIs $75k-100k, 1.5% for AGIs $100k-200k)
Taxes paid: $6,785 (reported on 29.4% of returns)
63344:
$6,785
State:
$8,399
(% of AGI for various income ranges: 2.5% for AGIs $25k-50k, 2.7% for AGIs $50k-75k, 3.2% for AGIs $75k-100k, 6.8% for AGIs $100k-200k)
Earned income credit: $2,110 (reported on 14.7% of returns)
Here:
$2,110
State:
$2,288
(% of AGI for various income ranges: 4.8% for AGIs below $25k, 1.1% for AGIs $25k-50k)
Percentage of individuals using paid preparers for their 2012 taxes: 67.6%
Here:
68%
State:
55%
(% for various income ranges: 59.3% for AGIs below $25k, 66.7% for AGIs $25k-50k, 75.0% for AGIs $50k-75k, 71.4% for AGIs $75k-100k, 85.7% for AGIs $100k-200k)
Averages for the 2004 tax year for zip code 63344, filed in 2005:
Average Adjusted Gross Income (AGI) in 2004: $46,767 (Individual Income Tax Returns)
Here:
$46,767
State:
$44,591
Salary/wage: $39,252 (reported on 85.5% of returns)
Here:
$39,252
State:
$38,941
(% of AGI for various income ranges: 134.8% for AGIs below $10k, 82.2% for AGIs $10k-25k, 84.6% for AGIs $25k-50k, 84.2% for AGIs $50k-75k, 85.2% for AGIs $75k-100k, 43.1% for AGIs over 100k)
Taxable interest for individuals: $1,409 (reported on 49.9% of returns)
This zip code:
$1,409
Missouri:
$1,801
(% of AGI for various income ranges: 14.6% for AGIs below $10k, 2.2% for AGIs $10k-25k, 1.8% for AGIs $25k-50k, 0.4% for AGIs $50k-75k, 0.7% for AGIs $75k-100k, 2.0% for AGIs over 100k)
Taxable dividends: $1,433 (reported on 23.7% of returns)
Here:
$1,433
State:
$3,677
(% of AGI for various income ranges: 10.5% for AGIs below $10k, 0.3% for AGIs $10k-25k, 1.5% for AGIs $25k-50k, 0.8% for AGIs $50k-75k, 0.2% for AGIs $75k-100k, 0.2% for AGIs over 100k)
Net capital gain/loss: +$4,580 (reported on 19.0% of returns)
Here:
+$4,580
State:
+$8,915
(% of AGI for various income ranges: -4.4% for AGIs below $10k, 1.0% for AGIs $10k-25k, 0.8% for AGIs $25k-50k, 0.3% for AGIs $50k-75k, 2.7% for AGIs $75k-100k, 3.9% for AGIs over 100k)
Profit/loss from business: +$4,197 (reported on 16.9% of returns)
Here:
+$4,197
State:
+$9,793
(% of AGI for various income ranges: 9.4% for AGIs below $10k, 2.6% for AGIs $10k-25k, 3.2% for AGIs $25k-50k, 1.9% for AGIs $50k-75k, 0.6% for AGIs $75k-100k)
IRA payment deduction: $1,545 (reported on 1.6% of returns)
63344:
$1,545
Missouri:
$2,972
Total itemized deductions: $16,277 (19% of AGI, reported on 28.2% of returns)
Here:
$16,277
State:
$18,261
Here:
18.6% of AGI
State:
20.5% of AGI
(% of AGI for various income ranges: 13.1% for AGIs $10k-25k, 8.8% for AGIs $25k-50k, 10.5% for AGIs $50k-75k, 10.6% for AGIs $75k-100k, 9.2% for AGIs over 100k)
Charity contributions deductions: $3,560 (4% of AGI, reported on 23.0% of returns)
Here:
$3,560
State:
$3,665
Here:
4.3% of AGI
State:
3.9% of AGI
(% of AGI for various income ranges: 1.1% for AGIs $10k-25k, 1.4% for AGIs $25k-50k, 1.6% for AGIs $50k-75k, 1.5% for AGIs $75k-100k, 2.5% for AGIs over 100k)
Total tax: $5,711 (reported on 76.6% of returns)
63344:
$5,711
State:
$6,999
(% of AGI for various income ranges: 3.8% for AGIs below $10k, 3.9% for AGIs $10k-25k, 6.9% for AGIs $25k-50k, 8.4% for AGIs $50k-75k, 9.6% for AGIs $75k-100k, 13.0% for AGIs over 100k)
Earned income credit: $1,716 (reported on 11.7% of returns)
Here:
$1,716
State:
$1,728
Percentage of individuals using paid preparers for their 2004 taxes: 72.8%
Here:
73%
State:
62%
(% for various income ranges: 62.2% for AGIs below $10k, 71.0% for AGIs $10k-25k, 76.8% for AGIs $25k-50k, 75.0% for AGIs $50k-75k, 76.9% for AGIs $75k-100k, 83.3% for AGIs over 100k)
Likely homosexual households (counted as self-reported same-sex unmarried-partner households)
Lesbian couples: 0.0% of all households
Gay men: 0.3% of all households
Household received Food Stamps/SNAP in the past 12 months: 18 Household did not receive Food Stamps/SNAP in the past 12 months: 577
Women who had a birth in the past 12 months: 11 (11 now married, 0 unmarried) Women who did not have a birth in the past 12 months: 310 (181 now married, 127 unmarried)
Housing units in zip code 63344 with a mortgage: 230 (38 second mortgage, 20 both second mortgage and home equity loan) Median monthly owner costs for units with a mortgage: $1,700 Median monthly owner costs for units without a mortgage: $377
Residents with income below the poverty level in 2022:
This zip code:
14.7%
Whole state:
13.2%
Residents with income below 50% of the poverty level in 2022:
This zip code:
2.6%
Whole state:
6.8%
Median number of rooms in houses and condos:
Here:
6.7
State:
6.4
Median number of rooms in apartments:
Here:
5.4
State:
4.4
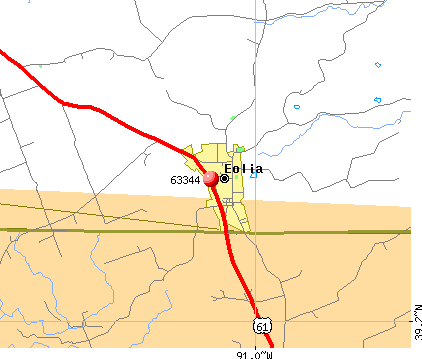
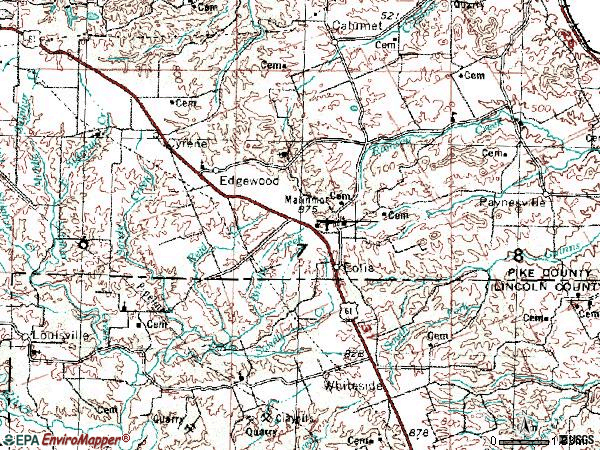
Notable locations in this zip code not listed on our city pages
Churches in zip code 63344 include: Saint Johns Church (A), Oak Grove Church (B), Corner Stone Church (C), Mount Ayre Church (D). Display/hide their locations on the map
Cemeteries: Oak Grove Cemetery (1), Corner Stone Cemetery (2), Jamieson Cemetery (3), Halley Cemetery (4), Halley-Liles Cemetery (5), Eolia Cemetery (6), Lewis-Meriwether Cemetery (7). Display/hide their locations on the map
Creeks: Shelton Creek (A), North Fork Guinns Creek (B), Brushy Creek (C), South Fork Guinns Creek (D), Killdergen Creek (E), Reid Creek (F), Sandy Creek (G). Display/hide their locations on the map
Size of family households: 235 2-persons, 89 3-persons, 92 4-persons, 18 5-persons, 4 6-persons, 12 7-or-more-persons
Size of nonfamily households: 128 1-person, 9 2-persons
239 married couples with children.
82 single-parent households (62 men, 20 women).
98.3% of residents of 63344 zip code speak English at home.
1.3% of residents speak Spanish at home (95% very well, 5% well).
0.2% of residents speak other language at home (100% very well).
Foreign born population: 0 (0.1%) (100.0% of them are naturalized citizens)
This zip code:
0.1%
Whole state:
4.1%
37%German
18%American
15%English
10%Irish
4%Dutch
3%Swedish
2%Polish
Year of entry for the foreign-born population
02010 or later
02000 to 2009
01990 to 1999
7Before 1990
Facilities with environmental interests located in this zip code:
PIKE LINCOLN TECHNICAL CTR (430 VOTECH RD in EOLIA, MO)
STATE MASTER (Missouri monitoring and compilance) - RCRAINFO-MOP000043273, NOT IN A UNIVERSE (National Center for Education Statistics) - STATE ID-1100082101 (Resource Conservation and Recovery Act (tracking hazardous waste)) Organizations: PIKE COUNTY R-3 SCHOOL DISTRICT (CONTACT/OWNER)
, PIKE CO. R-III (SCHOOL DISTRICT)
ALLTEL (HWY D in EOLIA, MO)
(Integrated Compliance Information System) - ICIS-HQ-2000-6004, FORMAL ENFORCEMENT ACTION STATE MASTER (Missouri monitoring and compilance) - ICIS-5872161, ENFORCEMENT/COMPLIANCE ACTIVITY Business SIC classification: RADIOTELEPHONE COMMUNICATIONS; TELEPHONE COMMUNICATIONS, EXCEPT RADIOTELEPHONE
ALVIN ADAMS JR (23309 HWY 61 in EOLIA, MO)
STATE MASTER (Missouri monitoring and compilance) - PCS-MOR240522, NPDES NON-MAJOR National Pollutant Discharge Elimination System NON-MAJOR (Tracking pollutant discharge elimination systems) - permit Business SIC classification: FARM SUPPLIES Alternative names: ALVIA ADAMS JR, EOLIA FERTILIZER
NORVELL HALL FARM (RT1 BOX 191 in EOLIA, MO)
STATE MASTER (Missouri monitoring and compilance) - RCRAINFO-MOP000003533, NOT IN A UNIVERSE (Resource Conservation and Recovery Act (tracking hazardous waste)) Organizations: DAVID ORTHWEIN (CONTACT/OWNER)
Housing units lacking complete plumbing facilities: 1.7%
57.3%Electricity
28.7%Bottled, tank, or LP gas
12.6%Wood
1.7%Other fuel
Population in 1990: 533. Population change in the 1990s: +853 (+160.0%).
Place of birth for U.S.-born residents:
This state: 1,221
Northeast: 1
Midwest: 182
South: 100
West: 10
55% of the 63344 zip code residents lived in the same house 5 years ago. Out of people who lived in different houses, 47% lived in this county. Out of people who lived in different counties, 50% lived in Missouri.
95% of the 63344 zip code residents lived in the same house 1 year ago. Out of people who lived in different houses, 25% moved from this county. Out of people who lived in different houses, 79% moved from different county within same state.
Private vs. public school enrollment:
Students in private schools in grades 1 to 8 (elementary and middle school): 2
Here:
1.4%
Missouri:
15.4%
Students in private schools in grades 9 to 12 (high school): 5
Here:
5.7%
Missouri:
13.9%
Students in private undergraduate colleges:
Here:
0.0%
Missouri:
22.6%
Occupation by median earnings in the past 12 months ($)
96,304Health diagnosing and treating practitioners and other technical occupations
74,187Building and grounds cleaning and maintenance occupations
73,101Installation, maintenance, and repair occupations
71,597Production occupations
62,028Business and financial operations occupations
59,436Management occupations
Companies with federal contracts located in this zip code:
MAGRUDER CONSTRUCTION CO INC (243 WEST OUTER RD in EOLIA, MO; small business) : $17,417,013 in 80 contractsfrom 2001 to 2006
Contracts for Maintenance, Repair or Alteration of Real Property -- Other Conservation and Development Facilities, Maintenance, Repair or Alteration of Real Property -- Other Non-Building Facilities, Maintenance, Repair or Alteration of Real Property -- Restoration of real property, Construction of Structures and Facilities -- Other Conservation and Development Facilities, and moreby Army, U.S. Army Corps of Engineers - civil program financing only, U.S. Fish and Wildlife Service Signed by year:2000: $0; 2001: $6,185,533; 2002: $3,132,720; 2003: $107,109; 2004: $559,052; 2005: $4,966,512; 2006: $2,466,087.
Biggest contracts:
$1,781,000 with Army for Maintenance, Repair or Alteration of Real Property -- Other Conservation and Development Facilities. Signed on 2006-01-05. Completion date: 2004-09-30.
$1,600,000 with U.S. Army Corps of Engineers - civil program financing only for Maintenance, Repair or Alteration of Real Property -- Other Non-Building Facilities. Taking place in IL. Signed on 2001-03-08. Completion date: 2004-03-15.
$1,000,000 with U.S. Army Corps of Engineers - civil program financing only for Maintenance, Repair or Alteration of Real Property -- Restoration of real property. Taking place in IL. Signed on 2001-11-30. Completion date: 2002-10-15.
$900,000 with U.S. Army Corps of Engineers - civil program financing only for Maintenance, Repair or Alteration of Real Property -- Other Non-Building Facilities. Taking place in IL. Signed on 2001-07-31. Completion date: 2004-09-15.
A & W COMMUNICATIONS, INC. (100 N MAIN ST in EOLIA, MO; small business) 17 employees, $1665920 revenue.
$16,489 with Forest Service for Construction of Structures and Facilities -- Electronic and Communications Facilities. Signed on 2003-08-15. Completion date: 2003-10-15.
Top industries in this zip code by the number of employees in 2005:
Construction: Highway, Street, and Bridge Construction (100-249 employees: 1 establishment)
Administrative and Support and Waste Management and Remediation Services: Solid Waste Landfill (10-19: 1)
Wholesale Trade: Drugs and Druggists' Sundries Merchant Wholesalers (10-19: 1)
Construction: All Other Specialty Trade Contractors (5-9: 1, 1-4: 1)
Arts, Entertainment, and Recreation: All Other Amusement and Recreation Industries (5-9: 1)
Accommodation and Food Services: Full-Service Restaurants (5-9: 1)
People in group quarters in 2010:
4 people in group homes intended for adults
3 people in group homes for juveniles (non-correctional)
2 people in nursing facilities/skilled-nursing facilities
Fatal accident statistics in 2011:
Fatal accident count: 2
Vehicles involved in fatal accidents: 2
Fatal accidents caused by drunken drivers: 0
Fatalities: 2
Persons involved in fatal accidents: 4
Pedestrians involved in fatal accidents: 1
Home Mortgage Disclosure Act Aggregated Statistics For Year 2009 (Based on 2 partial tracts)
A) FHA, FSA/RHS & VA Home Purchase Loans
B) Conventional Home Purchase Loans
C) Refinancings
D) Home Improvement Loans
F) Non-occupant Loans on < 5 Family Dwellings (A B C & D)
G) Loans On Manufactured Home Dwelling (A B C & D)
Number
Average Value
Number
Average Value
Number
Average Value
Number
Average Value
Number
Average Value
Number
Average Value
LOANS ORIGINATED
11
$143,286
17
$143,690
101
$162,163
5
$80,868
8
$87,442
8
$73,399
APPLICATIONS APPROVED, NOT ACCEPTED
1
$203,990
1
$87,790
5
$192,710
1
$21,360
0
$0
1
$47,630
APPLICATIONS DENIED
2
$122,605
1
$273,840
28
$168,958
1
$84,370
0
$0
2
$90,565
APPLICATIONS WITHDRAWN
2
$125,915
2
$302,885
15
$156,740
1
$130,510
1
$62,370
1
$79,030
FILES CLOSED FOR INCOMPLETENESS
1
$101,460
0
$0
3
$145,747
0
$0
0
$0
0
$0
Aggregated Statistics For Year 2008 (Based on 2 partial tracts)
A) FHA, FSA/RHS & VA Home Purchase Loans
B) Conventional Home Purchase Loans
C) Refinancings
D) Home Improvement Loans
F) Non-occupant Loans on < 5 Family Dwellings (A B C & D)
G) Loans On Manufactured Home Dwelling (A B C & D)
Number
Average Value
Number
Average Value
Number
Average Value
Number
Average Value
Number
Average Value
Number
Average Value
LOANS ORIGINATED
8
$128,454
24
$157,005
62
$172,723
3
$73,050
6
$121,717
10
$65,981
APPLICATIONS APPROVED, NOT ACCEPTED
0
$0
1
$134,780
6
$144,785
0
$0
0
$0
1
$43,570
APPLICATIONS DENIED
3
$122,393
5
$160,884
32
$169,638
5
$44,258
1
$46,140
5
$74,590
APPLICATIONS WITHDRAWN
2
$130,615
2
$206,980
12
$204,647
1
$129,440
0
$0
0
$0
FILES CLOSED FOR INCOMPLETENESS
1
$92,920
1
$46,560
3
$203,847
0
$0
0
$0
0
$0
Aggregated Statistics For Year 2007 (Based on 2 partial tracts)
A) FHA, FSA/RHS & VA Home Purchase Loans
B) Conventional Home Purchase Loans
C) Refinancings
D) Home Improvement Loans
F) Non-occupant Loans on < 5 Family Dwellings (A B C & D)
G) Loans On Manufactured Home Dwelling (A B C & D)
Number
Average Value
Number
Average Value
Number
Average Value
Number
Average Value
Number
Average Value
Number
Average Value
LOANS ORIGINATED
5
$122,990
38
$145,490
60
$158,829
8
$48,540
8
$133,606
13
$88,923
APPLICATIONS APPROVED, NOT ACCEPTED
0
$0
3
$144,323
11
$174,473
1
$52,550
0
$0
1
$49,130
APPLICATIONS DENIED
1
$187,750
9
$115,961
41
$169,734
6
$60,698
2
$140,440
7
$101,307
APPLICATIONS WITHDRAWN
1
$118,980
3
$142,970
16
$162,883
1
$134,140
0
$0
0
$0
FILES CLOSED FOR INCOMPLETENESS
0
$0
1
$185,620
6
$172,447
0
$0
0
$0
0
$0
Aggregated Statistics For Year 2006 (Based on 2 partial tracts)
A) FHA, FSA/RHS & VA Home Purchase Loans
B) Conventional Home Purchase Loans
C) Refinancings
D) Home Improvement Loans
F) Non-occupant Loans on < 5 Family Dwellings (A B C & D)
G) Loans On Manufactured Home Dwelling (A B C & D)
Number
Average Value
Number
Average Value
Number
Average Value
Number
Average Value
Number
Average Value
Number
Average Value
LOANS ORIGINATED
4
$148,292
59
$136,885
67
$147,263
7
$61,181
8
$145,729
12
$94,376
APPLICATIONS APPROVED, NOT ACCEPTED
1
$64,930
6
$138,342
15
$148,794
1
$98,260
1
$257,600
2
$81,915
APPLICATIONS DENIED
2
$97,830
15
$98,512
45
$142,476
9
$55,157
2
$220,010
8
$88,484
APPLICATIONS WITHDRAWN
0
$0
6
$131,613
22
$155,996
2
$38,020
1
$247,990
3
$74,333
FILES CLOSED FOR INCOMPLETENESS
0
$0
1
$217,440
6
$182,663
0
$0
0
$0
0
$0
Aggregated Statistics For Year 2005 (Based on 2 partial tracts)
A) FHA, FSA/RHS & VA Home Purchase Loans
B) Conventional Home Purchase Loans
C) Refinancings
D) Home Improvement Loans
F) Non-occupant Loans on < 5 Family Dwellings (A B C & D)
G) Loans On Manufactured Home Dwelling (A B C & D)
Number
Average Value
Number
Average Value
Number
Average Value
Number
Average Value
Number
Average Value
Number
Average Value
LOANS ORIGINATED
5
$132,390
53
$127,092
76
$144,835
6
$82,378
7
$96,730
10
$77,067
APPLICATIONS APPROVED, NOT ACCEPTED
0
$0
7
$92,459
10
$140,399
2
$42,295
0
$0
3
$66,857
APPLICATIONS DENIED
1
$122,610
12
$92,738
38
$123,388
5
$48,360
1
$67,070
12
$75,935
APPLICATIONS WITHDRAWN
0
$0
6
$119,687
24
$138,226
2
$162,015
1
$61,090
2
$108,400
FILES CLOSED FOR INCOMPLETENESS
0
$0
3
$112,497
5
$137,900
0
$0
0
$0
0
$0
Aggregated Statistics For Year 2004 (Based on 2 partial tracts)
A) FHA, FSA/RHS & VA Home Purchase Loans
B) Conventional Home Purchase Loans
C) Refinancings
D) Home Improvement Loans
F) Non-occupant Loans on < 5 Family Dwellings (A B C & D)
G) Loans On Manufactured Home Dwelling (A B C & D)
Number
Average Value
Number
Average Value
Number
Average Value
Number
Average Value
Number
Average Value
Number
Average Value
LOANS ORIGINATED
4
$125,115
40
$124,401
70
$127,904
6
$45,853
4
$127,145
13
$80,971
APPLICATIONS APPROVED, NOT ACCEPTED
0
$0
5
$101,502
13
$129,359
1
$49,770
0
$0
3
$71,700
APPLICATIONS DENIED
2
$118,760
12
$82,503
32
$131,898
3
$33,180
1
$54,680
13
$85,145
APPLICATIONS WITHDRAWN
1
$161,270
4
$102,260
24
$133,491
1
$64,080
1
$47,850
4
$80,208
FILES CLOSED FOR INCOMPLETENESS
1
$68,140
2
$70,060
3
$160,343
0
$0
0
$0
1
$79,250
Aggregated Statistics For Year 2003 (Based on 2 partial tracts)
A) FHA, FSA/RHS & VA Home Purchase Loans
B) Conventional Home Purchase Loans
C) Refinancings
D) Home Improvement Loans
F) Non-occupant Loans on < 5 Family Dwellings (A B C & D)
Detailed PMIC statistics for the following Tracts:8102.00
2002 - 2017 National Fire Incident Reporting System (NFIRS) incidents
Based on the data from the years 2002 - 2017 the average number of fires per year is 18. The highest number of fires - 37 took place in 2009, and the least - 8 in 2003. The data has a dropping trend.
When looking into fire subcategories, the most incidents belonged to: Outside Fires (43.2%), and Structure Fires (34.4%).
Fire incident types reported to NFIRS in Zip Code 63344


 Nearest zip codes: 63387, 63336, 63377, 63343, 63334, 63330.


 Based on the data from the years 2002 - 2017 the average number of fires per year is 18. The highest number of fires - 37 took place in 2009, and the least - 8 in 2003. The data has a dropping trend.
 When looking into fire subcategories, the most incidents belonged to: Outside Fires (43.2%), and Structure Fires (34.4%).