Estimated zip code population in 2022: 1,483 Zip code population in 2010: 1,673 Zip code population in 2000: 1,564
Houses and condos: 662 Renter-occupied apartments: 77
% of renters here:
15%
State:
32%
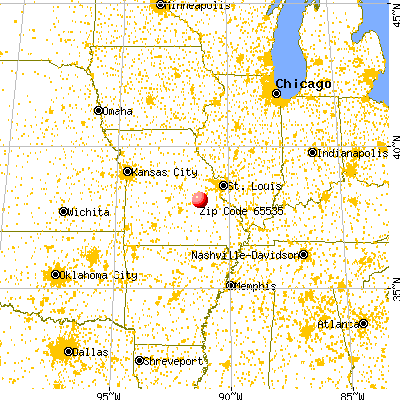
March 2022 cost of living index in zip code 65535: 84.4 (less than average, U.S. average is 100)
Land area: 43.3 sq. mi. Water area: 0.0 sq. mi.
Population density: 34 people per square mile
(very low).
OSM Map
General Map
Google Map
MSN Map
OSM Map
General Map
Google Map
MSN Map
OSM Map
General Map
Google Map
MSN Map
OSM Map
General Map
Google Map
MSN Map
Please wait while loading the map...
Real estate property taxes paid for housing units in 2022:
This zip code:
0.6% ($595)
Missouri:
0.8% ($1,810)
Median real estate property taxes paid for housing units with mortgages in 2022: $1,074 (1.0%) Median real estate property taxes paid for housing units with no mortgage in 2022: $555 (0.7%)
Business Search- 14 Million verified businesses
Males: 686
(46.3%)
Females: 797
(53.7%)
For population 25 years and over in 65535:
High school or higher: 75.8%
Bachelor's degree or higher: 11.9%
Graduate or professional degree: 1.1%
Unemployed: 16.9%
Mean travel time to work (commute): 27.3 minutes
For population 15 years and over in 65535:
Never married: 32.2%
Now married: 50.4%
Separated: 0.0%
Widowed: 4.9%
Divorced: 12.6%
Zip code 65535 compared to state average:
Median house value below state average.
Unemployed percentage significantly above state average.
Black race population percentage significantly below state average.
Median age significantly below state average.
Foreign-born population percentage significantly below state average.
Renting percentage below state average.
Length of stay since moving in above state average.
Percentage of population with a bachelor's degree or higher significantly below state average.
Averages for the 2020 tax year for zip code 65535, filed in 2021:
Average Adjusted Gross Income (AGI) in 2020: $47,614 (Individual Income Tax Returns)
Here:
$47,614
State:
$68,151
Salary/wage: $38,437 (reported on 81.4% of returns)
Here:
$38,437
State:
$56,131
(% of AGI for various income ranges: 1208.9% for AGIs below $25k, 3342.5% for AGIs $25k-50k, 5662.5% for AGIs $50k-75k, 9992.5% for AGIs $75k-100k, 19123.3% for AGIs $100k-200k)
Taxable interest for individuals: $613 (reported on 21.4% of returns)
This zip code:
$613
Missouri:
$1,586
(% of AGI for various income ranges: 5.8% for AGIs below $25k, 18.1% for AGIs $25k-50k, 25.0% for AGIs $75k-100k, 140.0% for AGIs $100k-200k)
Ordinary dividends: $1,600 (reported on 11.4% of returns)
Here:
$1,600
State:
$10,947
(% of AGI for various income ranges: 21.1% for AGIs below $25k, 25.0% for AGIs $50k-75k, 226.7% for AGIs $100k-200k)
Net capital gain/loss in AGI: +$6,200 (reported on 8.6% of returns)
Here:
+$6,200
State:
+$18,453
(% of AGI for various income ranges: 37.5% for AGIs $25k-50k, 780.0% for AGIs $75k-100k)
Profit/loss from business: +$7,267 (reported on 12.9% of returns)
Here:
+$7,267
State:
+$12,260
(% of AGI for various income ranges: 261.6% for AGIs below $25k, 196.2% for AGIs $50k-75k)
Taxable individual retirement arrangement distribution: $12,867 (reported on 4.3% of returns)
65535:
$12,867
Missouri:
$19,719
(% of AGI for various income ranges: 241.2% for AGIs $25k-50k)
Earned income credit: $2,344 (reported on 22.9% of returns)
Here:
$2,344
State:
$2,315
(% of AGI for various income ranges: 136.8% for AGIs below $25k, 71.9% for AGIs $25k-50k)
Percentage of individuals using paid preparers for their 2020 taxes: 97.1%
Here:
97%
State:
93%
(% for various income ranges: 96.3% for AGIs below $25k, 95.2% for AGIs $25k-50k, 100.0% for AGIs $50k-75k, 100.0% for AGIs $75k-100k, 100.0% for AGIs $100k-200k)
Averages for the 2012 tax year for zip code 65535, filed in 2013:
Average Adjusted Gross Income (AGI) in 2012: $34,817 (Individual Income Tax Returns)
Here:
$34,817
State:
$55,896
Salary/wage: $30,776 (reported on 84.6% of returns)
Here:
$30,776
State:
$46,205
(% of AGI for various income ranges: 72.8% for AGIs below $25k, 82.4% for AGIs $25k-50k, 78.2% for AGIs $50k-75k, 66.6% for AGIs $75k-100k)
Taxable interest for individuals: $300 (reported on 26.2% of returns)
This zip code:
$300
Missouri:
$1,559
(% of AGI for various income ranges: 0.4% for AGIs below $25k, 0.1% for AGIs $25k-50k, 0.4% for AGIs $50k-75k, 0.1% for AGIs $75k-100k)
Ordinary dividends: $750 (reported on 12.3% of returns)
Here:
$750
State:
$7,410
Net capital gain/loss in AGI: +$1,800 (reported on 9.2% of returns)
Here:
+$1,800
State:
+$11,579
Profit/loss from business: +$5,922 (reported on 13.8% of returns)
Here:
+$5,922
State:
+$11,688
Taxable individual retirement arrangement distribution: $9,933 (reported on 4.6% of returns)
65535:
$9,933
Missouri:
$14,773
Total itemized deductions: $21,125 (26% of AGI, reported on 12.3% of returns)
Here:
$21,125
State:
$22,730
Here:
26.1% of AGI
State:
19.2% of AGI
(% of AGI for various income ranges: 11.8% for AGIs below $25k, 7.1% for AGIs $50k-75k, 11.8% for AGIs $75k-100k)
Charity contributions: $3,400 (reported on 6.2% of returns)
Here:
$3,400
State:
$4,745
Taxes paid: $5,000 (reported on 12.3% of returns)
65535:
$5,000
State:
$8,399
(% of AGI for various income ranges: 1.3% for AGIs below $25k, 1.4% for AGIs $50k-75k, 3.9% for AGIs $75k-100k)
Earned income credit: $2,710 (reported on 30.8% of returns)
Here:
$2,710
State:
$2,288
(% of AGI for various income ranges: 9.8% for AGIs below $25k, 2.5% for AGIs $25k-50k)
Percentage of individuals using paid preparers for their 2012 taxes: 64.6%
Here:
65%
State:
55%
(% for various income ranges: 59.4% for AGIs below $25k, 70.6% for AGIs $25k-50k, 77.8% for AGIs $50k-75k, 57.1% for AGIs $75k-100k)
Averages for the 2004 tax year for zip code 65535, filed in 2005:
Average Adjusted Gross Income (AGI) in 2004: $29,669 (Individual Income Tax Returns)
Here:
$29,669
State:
$44,591
Salary/wage: $27,104 (reported on 88.7% of returns)
Here:
$27,104
State:
$38,941
(% of AGI for various income ranges: 81.4% for AGIs below $10k, 78.7% for AGIs $10k-25k, 84.5% for AGIs $25k-50k, 91.3% for AGIs $50k-75k, 90.6% for AGIs $75k-100k, 44.3% for AGIs over 100k)
Taxable interest for individuals: $629 (reported on 28.5% of returns)
This zip code:
$629
Missouri:
$1,801
(% of AGI for various income ranges: 1.5% for AGIs below $10k, 1.4% for AGIs $10k-25k, 0.6% for AGIs $25k-50k, 0.1% for AGIs $50k-75k, 0.2% for AGIs $75k-100k, 0.3% for AGIs over 100k)
Taxable dividends: $613 (reported on 9.5% of returns)
Here:
$613
State:
$3,677
(% of AGI for various income ranges: 0.2% for AGIs $10k-25k, 0.5% for AGIs $25k-50k, 0.0% for AGIs $50k-75k, 0.1% for AGIs $75k-100k)
Net capital gain/loss: +$8,411 (reported on 8.6% of returns)
Here:
+$8,411
State:
+$8,915
(% of AGI for various income ranges: 0.3% for AGIs $10k-25k, 0.7% for AGIs $25k-50k, 0.0% for AGIs $50k-75k, 24.0% for AGIs $75k-100k)
Profit/loss from business: +$2,975 (reported on 12.4% of returns)
Here:
+$2,975
State:
+$9,793
(% of AGI for various income ranges: 6.5% for AGIs below $10k, 6.5% for AGIs $10k-25k, -0.4% for AGIs $25k-50k, -0.3% for AGIs $50k-75k)
Total itemized deductions: $15,048 (23% of AGI, reported on 15.9% of returns)
Here:
$15,048
State:
$18,261
Here:
23.0% of AGI
State:
20.5% of AGI
(% of AGI for various income ranges: 3.4% for AGIs $10k-25k, 6.9% for AGIs $25k-50k, 11.3% for AGIs $50k-75k, 13.8% for AGIs $75k-100k, 9.3% for AGIs over 100k)
Charity contributions deductions: $3,086 (4% of AGI, reported on 12.4% of returns)
Here:
$3,086
State:
$3,665
Here:
4.5% of AGI
State:
3.9% of AGI
Total tax: $3,199 (reported on 66.2% of returns)
65535:
$3,199
State:
$6,999
(% of AGI for various income ranges: 1.6% for AGIs below $10k, 3.5% for AGIs $10k-25k, 5.3% for AGIs $25k-50k, 8.0% for AGIs $50k-75k, 8.9% for AGIs $75k-100k, 16.1% for AGIs over 100k)
Earned income credit: $1,713 (reported on 25.1% of returns)
Here:
$1,713
State:
$1,728
Percentage of individuals using paid preparers for their 2004 taxes: 75.0%
Here:
75%
State:
62%
(% for various income ranges: 68.5% for AGIs below $10k, 75.7% for AGIs $10k-25k, 75.2% for AGIs $25k-50k, 81.4% for AGIs $50k-75k, 80.0% for AGIs $75k-100k, 92.9% for AGIs over 100k)
Household received Food Stamps/SNAP in the past 12 months: 120 Household did not receive Food Stamps/SNAP in the past 12 months: 383
Women who had a birth in the past 12 months: 75 (26 now married, 52 unmarried) Women who did not have a birth in the past 12 months: 309 (120 now married, 189 unmarried)
Housing units in zip code 65535 with a mortgage: 160 (37 second mortgage, 39 both second mortgage and home equity loan) Median monthly owner costs for units with a mortgage: $1,073 Median monthly owner costs for units without a mortgage: $328
Residents with income below the poverty level in 2022:
This zip code:
14.1%
Whole state:
13.2%
Residents with income below 50% of the poverty level in 2022:
This zip code:
9.1%
Whole state:
6.8%
Median number of rooms in houses and condos:
Here:
5.6
State:
6.4
Median number of rooms in apartments:
Here:
4.0
State:
4.4
Notable locations in this zip code not listed on our city pages
Streams, rivers, and creeks: Huzzah Creek (A), Lick Creek (B), Bessen River (C), Kelly Branch (D), Blairs Creek (E), Bobs Creek (F). Display/hide their locations on the map
Size of family households: 154 2-persons, 28 3-persons, 105 4-persons, 50 5-persons, 14 7-or-more-persons
Size of nonfamily households: 120 1-person, 26 2-persons
217 married couples with children.
90 single-parent households (4 men, 86 women).
99.8% of residents of 65535 zip code speak English at home.
Foreign born population: 4 (0.3%) (100.0% of them are naturalized citizens)
This zip code:
0.3%
Whole state:
4.1%
75%France
25%Denmark
25%German
15%American
13%Irish
10%English
1%European
Year of entry for the foreign-born population
02010 or later
02000 to 2009
01990 to 1999
6Before 1990
Facilities with environmental interests located in this zip code:
RICHARD SCHELESKI (247 HIGHWAY H in LEASBURG, MO)
STATE MASTER (Missouri monitoring and compilance) - PCS-MO0127990, NPDES NON-MAJOR National Pollutant Discharge Elimination System NON-MAJOR (Tracking pollutant discharge elimination systems) - permit Business SIC classification: DRINKING PLACES (ALCOHOLIC BEVERAGES) Alternative names: ROUTE 66 INN
OAKS MOBILE HOME PARK (HWY H in LEASBURG, MO)
National Pollutant Discharge Elimination System NON-MAJOR (Tracking pollutant discharge elimination systems) - permit Business SIC classification: SEWERAGE SYSTEMS Organizations: OAKS OF LEASBURG, LLC., (CONTACT/OWNER)
Housing units lacking complete plumbing facilities: 9.9% Housing units lacking complete kitchen facilities: 14.6%
48.5%Electricity
33.4%Bottled, tank, or LP gas
11.0%Wood
5.9%Utility gas
1.4%Fuel oil, kerosene, etc.
Population in 1990: 1,061. Population change in the 1990s: +503 (+47.4%).
Place of birth for U.S.-born residents:
This state: 1,243
Midwest: 86
South: 34
West: 112
47% of the 65535 zip code residents lived in the same house 5 years ago. Out of people who lived in different houses, 49% lived in this county. Out of people who lived in different counties, 50% lived in Missouri.
100% of the 65535 zip code residents lived in the same house 1 year ago. Out of people who lived in different houses, 67% moved from this county. Out of people who lived in different houses, 133% moved from different county within same state.
Private vs. public school enrollment:
Students in private schools in grades 1 to 8 (elementary and middle school):
Here:
0.0%
Missouri:
15.4%
Students in private schools in grades 9 to 12 (high school):
Here:
0.0%
Missouri:
13.9%
Students in private undergraduate colleges: 38
Here:
100.0%
Missouri:
22.6%
Occupation by median earnings in the past 12 months ($)
63,956Management occupations
43,039Production occupations
38,133Construction and extraction occupations
33,565Material moving occupations
29,237Office and administrative support occupations
25,336Food preparation and serving related occupations
Companies with federal contracts located in this zip code:
S AND S DRILLING PUMP COMPANY LIMITED LIABILITY COMPANY (3857 COUNTY RD H in LEASBURG, MO; small business) 3 employees, $200000 revenue. : $850,230 in 23 contractsfrom 1999 to 2006
Contracts for Well Drilling/Exploratory Services by Geological Survey Signed by year:2000: $320,000; 2001: $99,000; 2002: $191,000; 2003: $35,931; 2004: $125,080; 2005: -$5,152; 2006: $39,371.
Biggest contracts:
$156,000 with Geological Survey for Well Drilling/Exploratory Services. Signed on 2000-05-15. Completion date: 2000-12-15.
$131,000, same as above.Signed on 2002-09-15. Completion date: 2003-01-15.
$109,480, same as above.Signed on 2004-05-25. Completion date: 2005-02-28.
$95,000, same as above.Signed on 2000-08-15. Completion date: 2000-12-15.
Top industries in this zip code by the number of employees in 2005:
Real Estate and Rental and Leasing: Recreational Goods Rental (20-49 employees: 1 establishment)
Wholesale Trade: Other Electronic Parts and Equipment Merchant Wholesalers (5-9: 1)
Construction: Flooring Contractors (5-9: 1)
Construction: Electrical Contractors (5-9: 1)
Accommodation and Food Services: Full-Service Restaurants (1-4: 2)
Construction: New Single-Family Housing Construction (except Operative Builders) (1-4: 1)
Real Estate and Rental and Leasing: Lessors of Residential Buildings and Dwellings (1-4: 1)
Construction: Plumbing, Heating, and Air-Conditioning Contractors (1-4: 1)
Construction: Painting and Wall Covering Contractors (1-4: 1)
Fatal accident statistics in 2014:
Fatal accident count: 1
Vehicles involved in fatal accidents: 1
Fatal accidents caused by drunken drivers: 1
Fatalities: 1
Persons involved in fatal accidents: 1
Pedestrians involved in fatal accidents: 0
Fatal accident statistics in 2012:
Fatal accident count: 2
Vehicles involved in fatal accidents: 3
Fatal accidents caused by drunken drivers: 1
Fatalities: 2
Persons involved in fatal accidents: 4
Pedestrians involved in fatal accidents: 0
2002 - 2018 National Fire Incident Reporting System (NFIRS) incidents
According to the data from the years 2002 - 2018 the average number of fire incidents per year is 10. The highest number of fires - 30 took place in 2007, and the least - 2 in 2013. The data has a constant trend.
When looking into fire subcategories, the most incidents belonged to: Structure Fires (35.8%), and Outside Fires (32.1%).
Fire incident types reported to NFIRS in Zip Code 65535


 Nearest zip codes: 65441, 65453, 65565, 63080, 63079, 65586.


 According to the data from the years 2002 - 2018 the average number of fire incidents per year is 10. The highest number of fires - 30 took place in 2007, and the least - 2 in 2013. The data has a constant trend.
 When looking into fire subcategories, the most incidents belonged to: Structure Fires (35.8%), and Outside Fires (32.1%).