Estimated zip code population in 2022: 29,369 Zip code population in 2010: 30,503 Zip code population in 2000: 27,405
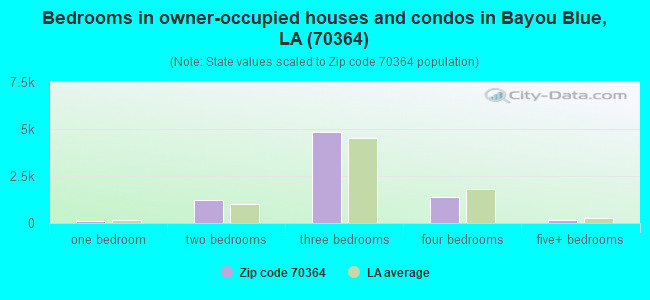
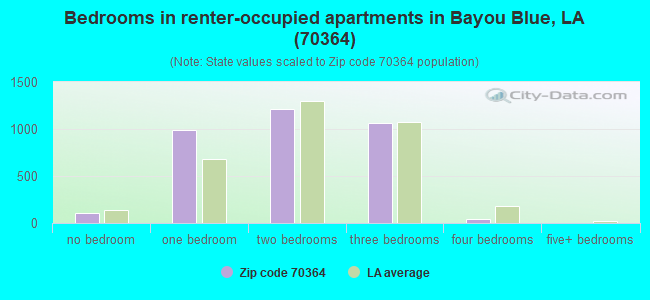
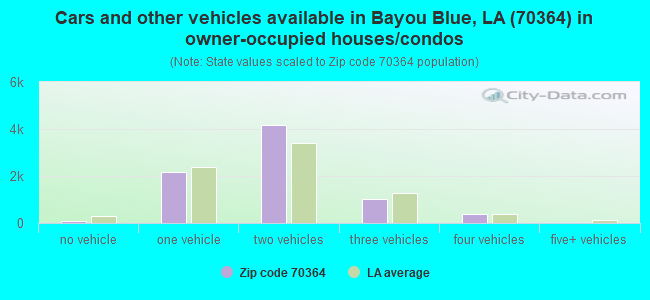
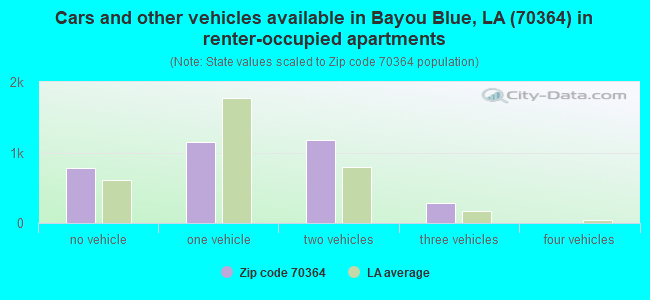
Houses and condos: 12,888 Renter-occupied apartments: 3,430
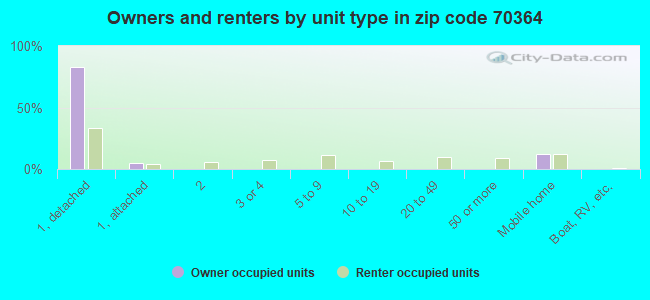
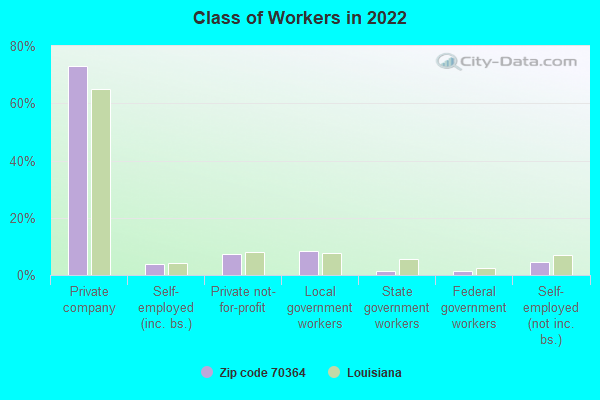
% of renters here:
30%
State:
32%
March 2022 cost of living index in zip code 70364: 84.0 (less than average, U.S. average is 100)
Land area: 42.4 sq. mi. Water area: 0.4 sq. mi.
Population density: 693 people per square mile
(low).
OSM Map
General Map
Google Map
MSN Map
OSM Map
General Map
Google Map
MSN Map
OSM Map
General Map
Google Map
MSN Map
OSM Map
General Map
Google Map
MSN Map
Please wait while loading the map...
Real estate property taxes paid for housing units in 2022:
This zip code:
0.3% ($675)
Louisiana:
0.5% ($1,127)
Median real estate property taxes paid for housing units with mortgages in 2022: $748 (0.4%) Median real estate property taxes paid for housing units with no mortgage in 2022: $448 (0.2%)
Business Search- 14 Million verified businesses
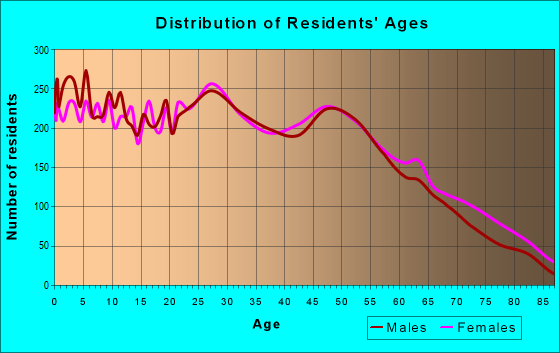
Males: 14,220
(48.4%)
Females: 15,148
(51.6%)
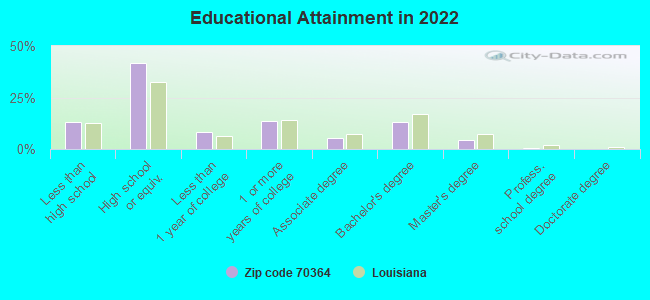
For population 25 years and over in 70364:
High school or higher: 86.4%
Bachelor's degree or higher: 17.9%
Graduate or professional degree: 5.0%
Unemployed: 6.1%
Mean travel time to work (commute): 24.2 minutes
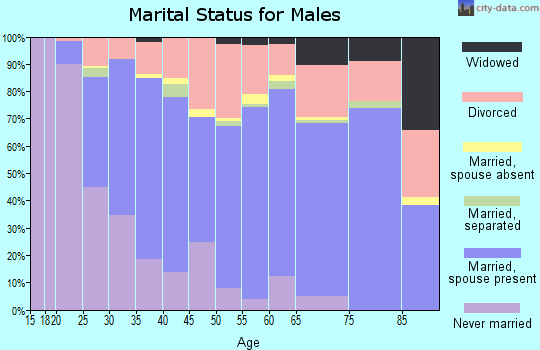
For population 15 years and over in 70364:
Never married: 35.1%
Now married: 45.4%
Separated: 1.4%
Widowed: 6.0%
Divorced: 12.1%
Zip code 70364 compared to state average:
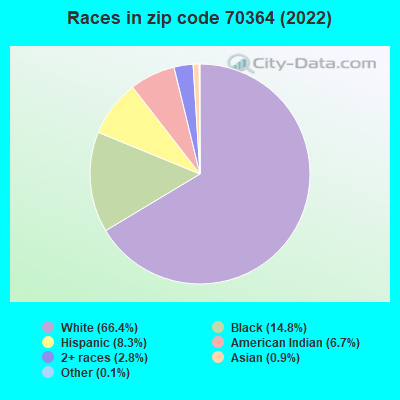
Black race population percentage below state average.
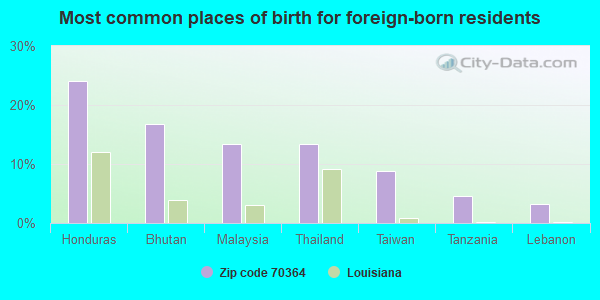
Foreign-born population percentage below state average.
Percentage of population with a bachelor's degree or higher below state average.
Estimated median house/condo value in 2022: $199,389
70364:
$199,389
Louisiana:
$209,200
According to our research of Louisiana and other state lists, there were 97 registered sex offenders living in 70364 zip code as of May 22, 2024. The ratio of all residents to sex offenders in zip code 70364 is 319 to 1. The ratio of registered sex offenders to all residents in this zip code is near the state average.
Median resident age:
This zip code:
35.9 years
Louisiana median age:
38.2 years
Average household size:
This zip code:
2.6 people
Louisiana:
2.5 people
Averages for the 2020 tax year for zip code 70364, filed in 2021:
Average Adjusted Gross Income (AGI) in 2020: $49,128 (Individual Income Tax Returns)
Here:
$49,128
State:
$60,757
Salary/wage: $45,820 (reported on 84.7% of returns)
Here:
$45,820
State:
$50,882
(% of AGI for various income ranges: 1055.4% for AGIs below $25k, 3417.5% for AGIs $25k-50k, 6396.5% for AGIs $50k-75k, 9131.9% for AGIs $75k-100k, 15385.3% for AGIs $100k-200k, 40078.6% for AGIs over 200k)
Taxable interest for individuals: $682 (reported on 21.4% of returns)
This zip code:
$682
Louisiana:
$1,576
(% of AGI for various income ranges: 9.6% for AGIs below $25k, 10.6% for AGIs $25k-50k, 21.4% for AGIs $50k-75k, 20.2% for AGIs $75k-100k, 45.6% for AGIs $100k-200k, 312.9% for AGIs over 200k)
Ordinary dividends: $2,765 (reported on 10.3% of returns)
Here:
$2,765
State:
$7,743
(% of AGI for various income ranges: 12.4% for AGIs below $25k, 19.4% for AGIs $25k-50k, 40.7% for AGIs $50k-75k, 56.5% for AGIs $75k-100k, 87.2% for AGIs $100k-200k, 831.4% for AGIs over 200k)
Net capital gain/loss in AGI: +$6,276 (reported on 9.4% of returns)
Here:
+$6,276
State:
+$16,917
(% of AGI for various income ranges: 4.7% for AGIs below $25k, 11.2% for AGIs $25k-50k, 52.8% for AGIs $50k-75k, 61.9% for AGIs $75k-100k, 174.2% for AGIs $100k-200k, 5364.3% for AGIs over 200k)
Profit/loss from business: +$6,572 (reported on 15.4% of returns)
Here:
+$6,572
State:
+$7,679
(% of AGI for various income ranges: 103.9% for AGIs below $25k, 45.6% for AGIs $25k-50k, 87.9% for AGIs $50k-75k, 125.8% for AGIs $75k-100k, 355.8% for AGIs $100k-200k, 1974.3% for AGIs over 200k)
Taxable individual retirement arrangement distribution: $18,757 (reported on 7.1% of returns)
70364:
$18,757
Louisiana:
$20,716
(% of AGI for various income ranges: 55.6% for AGIs below $25k, 103.6% for AGIs $25k-50k, 177.9% for AGIs $50k-75k, 340.0% for AGIs $75k-100k, 455.6% for AGIs $100k-200k, 2452.9% for AGIs over 200k)
Total itemized deductions: $30,213 (reported on 2.5% of returns)
Here:
$30,213
State:
$36,265
(% of AGI for various income ranges: 65.3% for AGIs $25k-50k, 136.6% for AGIs $50k-75k, 148.9% for AGIs $75k-100k, 283.8% for AGIs $100k-200k, 2508.6% for AGIs over 200k)
Charity contributions: $8,989 (reported on 1.6% of returns)
Here:
$8,989
State:
$13,106
(% of AGI for various income ranges: 8.4% for AGIs $25k-50k, 23.8% for AGIs $50k-75k, 20.5% for AGIs $75k-100k, 70.7% for AGIs $100k-200k, 437.1% for AGIs over 200k)
Taxes paid: $5,614 (reported on 2.3% of returns)
70364:
$5,614
State:
$6,643
(% of AGI for various income ranges: 6.5% for AGIs $25k-50k, 17.9% for AGIs $50k-75k, 25.8% for AGIs $75k-100k, 64.4% for AGIs $100k-200k, 452.9% for AGIs over 200k)
Earned income credit: $2,665 (reported on 23.6% of returns)
Here:
$2,665
State:
$2,671
(% of AGI for various income ranges: 137.3% for AGIs below $25k, 87.1% for AGIs $25k-50k, 1.1% for AGIs $50k-75k)
Percentage of individuals using paid preparers for their 2020 taxes: 93.8%
Here:
94%
State:
92%
(% for various income ranges: 92.8% for AGIs below $25k, 94.2% for AGIs $25k-50k, 93.8% for AGIs $50k-75k, 94.4% for AGIs $75k-100k, 96.3% for AGIs $100k-200k, 93.8% for AGIs over 200k)
Averages for the 2012 tax year for zip code 70364, filed in 2013:
Average Adjusted Gross Income (AGI) in 2012: $50,714 (Individual Income Tax Returns)
Here:
$50,714
State:
$56,730
Salary/wage: $45,742 (reported on 89.0% of returns)
Here:
$45,742
State:
$45,545
(% of AGI for various income ranges: 79.9% for AGIs below $25k, 86.4% for AGIs $25k-50k, 86.0% for AGIs $50k-75k, 88.3% for AGIs $75k-100k, 84.9% for AGIs $100k-200k, 40.1% for AGIs over 200k)
Taxable interest for individuals: $880 (reported on 23.6% of returns)
This zip code:
$880
Louisiana:
$1,804
(% of AGI for various income ranges: 0.6% for AGIs below $25k, 0.3% for AGIs $25k-50k, 0.4% for AGIs $50k-75k, 0.2% for AGIs $75k-100k, 0.3% for AGIs $100k-200k, 1.0% for AGIs over 200k)
Ordinary dividends: $3,110 (reported on 11.1% of returns)
Here:
$3,110
State:
$7,610
(% of AGI for various income ranges: 0.7% for AGIs below $25k, 0.3% for AGIs $25k-50k, 0.6% for AGIs $50k-75k, 0.4% for AGIs $75k-100k, 0.5% for AGIs $100k-200k, 2.3% for AGIs over 200k)
Net capital gain/loss in AGI: +$11,886 (reported on 7.9% of returns)
Here:
+$11,886
State:
+$17,096
(% of AGI for various income ranges: 0.1% for AGIs below $25k, 0.2% for AGIs $25k-50k, 0.3% for AGIs $50k-75k, 0.3% for AGIs $75k-100k, 0.9% for AGIs $100k-200k, 12.7% for AGIs over 200k)
Profit/loss from business: +$12,251 (reported on 13.1% of returns)
Here:
+$12,251
State:
+$12,088
(% of AGI for various income ranges: 8.5% for AGIs below $25k, 3.1% for AGIs $25k-50k, 1.8% for AGIs $50k-75k, 2.6% for AGIs $75k-100k, 2.4% for AGIs $100k-200k, 3.5% for AGIs over 200k)
Taxable individual retirement arrangement distribution: $14,724 (reported on 6.3% of returns)
70364:
$14,724
Louisiana:
$16,085
(% of AGI for various income ranges: 2.4% for AGIs below $25k, 1.8% for AGIs $25k-50k, 2.0% for AGIs $50k-75k, 1.7% for AGIs $75k-100k, 1.6% for AGIs $100k-200k, 2.0% for AGIs over 200k)
Self-employment retirement plans: $14,700 (reported on 0.2% of returns)
70364:
$14,700
Louisiana:
$25,119
Total itemized deductions: $18,359 (17% of AGI, reported on 17.4% of returns)
Here:
$18,359
State:
$23,585
Here:
17.1% of AGI
State:
18.1% of AGI
(% of AGI for various income ranges: 4.0% for AGIs below $25k, 4.4% for AGIs $25k-50k, 6.1% for AGIs $50k-75k, 6.3% for AGIs $75k-100k, 8.0% for AGIs $100k-200k, 7.4% for AGIs over 200k)
Charity contributions: $3,323 (reported on 10.3% of returns)
Here:
$3,323
State:
$5,533
(% of AGI for various income ranges: 0.2% for AGIs below $25k, 0.4% for AGIs $25k-50k, 0.6% for AGIs $50k-75k, 0.7% for AGIs $75k-100k, 0.8% for AGIs $100k-200k, 1.1% for AGIs over 200k)
Taxes paid: $4,644 (reported on 17.3% of returns)
70364:
$4,644
State:
$6,282
(% of AGI for various income ranges: 0.5% for AGIs below $25k, 0.6% for AGIs $25k-50k, 1.1% for AGIs $50k-75k, 1.4% for AGIs $75k-100k, 2.4% for AGIs $100k-200k, 3.2% for AGIs over 200k)
Earned income credit: $2,464 (reported on 22.5% of returns)
Here:
$2,464
State:
$2,633
(% of AGI for various income ranges: 9.4% for AGIs below $25k, 1.1% for AGIs $25k-50k)
Percentage of individuals using paid preparers for their 2012 taxes: 54.7%
Here:
55%
State:
57%
(% for various income ranges: 50.6% for AGIs below $25k, 53.0% for AGIs $25k-50k, 56.2% for AGIs $50k-75k, 59.2% for AGIs $75k-100k, 63.1% for AGIs $100k-200k, 88.9% for AGIs over 200k)
Averages for the 2004 tax year for zip code 70364, filed in 2005:
Average Adjusted Gross Income (AGI) in 2004: $36,553 (Individual Income Tax Returns)
Here:
$36,553
State:
$39,411
Salary/wage: $34,274 (reported on 89.1% of returns)
Here:
$34,274
State:
$34,434
(% of AGI for various income ranges: 95.5% for AGIs below $10k, 81.7% for AGIs $10k-25k, 87.7% for AGIs $25k-50k, 89.3% for AGIs $50k-75k, 88.4% for AGIs $75k-100k, 64.9% for AGIs over 100k)
Taxable interest for individuals: $1,074 (reported on 30.4% of returns)
This zip code:
$1,074
Louisiana:
$1,606
(% of AGI for various income ranges: 2.5% for AGIs below $10k, 1.6% for AGIs $10k-25k, 0.7% for AGIs $25k-50k, 0.5% for AGIs $50k-75k, 0.5% for AGIs $75k-100k, 1.4% for AGIs over 100k)
Taxable dividends: $1,978 (reported on 14.3% of returns)
Here:
$1,978
State:
$3,235
(% of AGI for various income ranges: 1.8% for AGIs below $10k, 0.8% for AGIs $10k-25k, 0.5% for AGIs $25k-50k, 0.3% for AGIs $50k-75k, 0.5% for AGIs $75k-100k, 1.8% for AGIs over 100k)
Net capital gain/loss: +$4,223 (reported on 11.1% of returns)
Here:
+$4,223
State:
+$8,531
(% of AGI for various income ranges: -0.2% for AGIs below $10k, 0.2% for AGIs $10k-25k, 0.4% for AGIs $25k-50k, 0.4% for AGIs $50k-75k, 0.5% for AGIs $75k-100k, 5.3% for AGIs over 100k)
Profit/loss from business: +$6,885 (reported on 12.5% of returns)
Here:
+$6,885
State:
+$9,128
(% of AGI for various income ranges: 4.2% for AGIs below $10k, 4.6% for AGIs $10k-25k, 2.0% for AGIs $25k-50k, 1.7% for AGIs $50k-75k, 1.8% for AGIs $75k-100k, 2.4% for AGIs over 100k)
IRA payment deduction: $3,069 (reported on 1.8% of returns)
70364:
$3,069
Louisiana:
$3,055
(% of AGI for various income ranges: 0.1% for AGIs $10k-25k, 0.2% for AGIs $25k-50k, 0.1% for AGIs $50k-75k, 0.2% for AGIs $75k-100k, 0.1% for AGIs over 100k)
Self-employed pension: $13,389 (reported on 0.2% of returns)
Here:
$13,389
Louisiana:
$17,274
Total itemized deductions: $15,279 (20% of AGI, reported on 13.9% of returns)
Here:
$15,279
State:
$18,222
Here:
19.9% of AGI
State:
20.3% of AGI
(% of AGI for various income ranges: 2.5% for AGIs below $10k, 3.3% for AGIs $10k-25k, 4.5% for AGIs $25k-50k, 5.3% for AGIs $50k-75k, 7.0% for AGIs $75k-100k, 9.5% for AGIs over 100k)
Charity contributions deductions: $2,604 (3% of AGI, reported on 10.7% of returns)
Here:
$2,604
State:
$4,190
Here:
3.2% of AGI
State:
4.4% of AGI
(% of AGI for various income ranges: 0.1% for AGIs below $10k, 0.3% for AGIs $10k-25k, 0.5% for AGIs $25k-50k, 0.6% for AGIs $50k-75k, 0.9% for AGIs $75k-100k, 1.8% for AGIs over 100k)
Total tax: $4,760 (reported on 70.9% of returns)
70364:
$4,760
State:
$6,529
(% of AGI for various income ranges: 2.3% for AGIs below $10k, 3.6% for AGIs $10k-25k, 6.5% for AGIs $25k-50k, 8.6% for AGIs $50k-75k, 10.9% for AGIs $75k-100k, 17.4% for AGIs over 100k)
Earned income credit: $1,874 (reported on 22.9% of returns)
Here:
$1,874
State:
$2,103
Percentage of individuals using paid preparers for their 2004 taxes: 55.7%
Here:
56%
State:
61%
(% for various income ranges: 50.1% for AGIs below $10k, 56.4% for AGIs $10k-25k, 54.5% for AGIs $25k-50k, 58.7% for AGIs $50k-75k, 57.3% for AGIs $75k-100k, 72.3% for AGIs over 100k)
Likely homosexual households (counted as self-reported same-sex unmarried-partner households)
Lesbian couples: 0.5% of all households
Gay men: 0.3% of all households
Household received Food Stamps/SNAP in the past 12 months: 2,203 Household did not receive Food Stamps/SNAP in the past 12 months: 9,087
Women who had a birth in the past 12 months: 688 (355 now married, 333 unmarried) Women who did not have a birth in the past 12 months: 6,983 (2,659 now married, 4,321 unmarried)
Housing units in zip code 70364 with a mortgage: 4,862 (355 second mortgage, 315 both second mortgage and home equity loan) Houses without a mortgage: 86
Median monthly owner costs for units with a mortgage: $1,406 Median monthly owner costs for units without a mortgage: $375
Residents with income below the poverty level in 2022:
This zip code:
16.3%
Whole state:
18.6%
Residents with income below 50% of the poverty level in 2022:
This zip code:
8.7%
Whole state:
10.1%
Median number of rooms in houses and condos:
Here:
6.0
State:
6.2
Median number of rooms in apartments:
Here:
4.3
State:
4.4
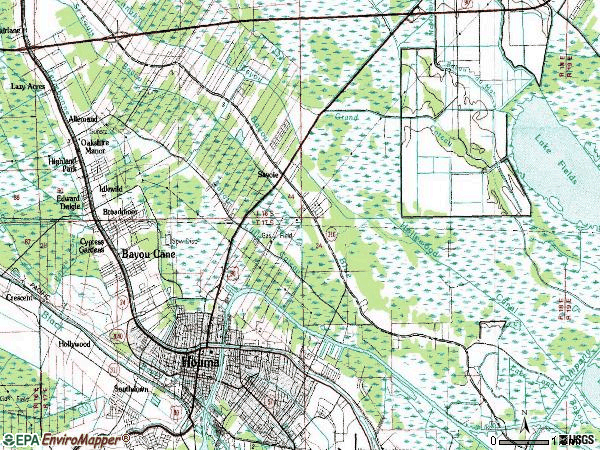
Notable locations in this zip code not listed on our city pages
Notable locations in zip code 70364: Colonial Acres Golf Course (A), Terrebonne Parish Office (B), Lafourche Parish Sheriff's Office (C), Bayou Terrebonne Waterlife Museum (D), Lafourche Parish Library Bayou Blue Branch (E), Coteau Volunteer Fire Department (F), Bayou Blue Volunteer Fire Department (G), Oaks of Houma (H), Houma Fire Department North Houma Station (I). Display/hide their locations on the map
Churches in zip code 70364 include: The Methodist Church (A), Galilean Baptist Church (B), Church of Christ (C), Bayou Blue United Methodist Church (D), Bayou Blue Assembly of God Church (E), Bayou Blue Chapel (F), Coteau Mission (G), Immaculate Heart of Mary Church (H), Spirit Filled Life Center (I). Display/hide their locations on the map
In group quarters: 128 (-1 institutionalized population)
Size of family households: 2,934 2-persons, 2,250 3-persons, 1,049 4-persons, 638 5-persons, 272 6-persons, 202 7-or-more-persons
Size of nonfamily households: 2,576 1-person, 1,191 2-persons, 132 3-persons
4,214 married couples with children.
2,194 single-parent households (662 men, 1,532 women).
92.9% of residents of 70364 zip code speak English at home.
3.8% of residents speak Spanish at home (90% very well, 10% well).
2.7% of residents speak other Indo-European language at home (88% very well, 8% well, 3% not well).
0.4% of residents speak Asian or Pacific Island language at home (60% very well, 40% not well).
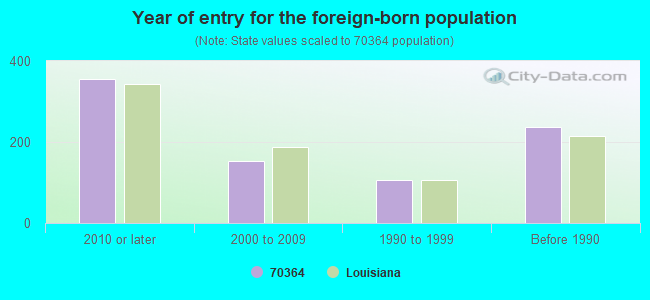
Foreign born population: 582 (2.0%) (49.3% of them are naturalized citizens)
Major facilities with environmental interests located in this zip code:
HOUMA VALVE SVC INC (1909 COTEAU in HOUMA, LA)
(Integrated Compliance Information System) - ICIS-06-2002-0916, FORMAL ENFORCEMENT ACTION HAZARDOUS WASTE BIENNIAL REPORTER (Resource Conservation and Recovery Act (tracking hazardous waste)) Large Quantity Generators, more that 1000 kg of hazardous waste/month (Resource Conservation and Recovery Act (tracking hazardous waste)) - notification Business SIC classification: VALVES AND PIPE FITTINGS Business NAICS classification: SUPPORT ACTIVITIES FOR OIL AND GAS OPERATIONS.; OIL AND GAS FIELD MACHINERY AND EQUIPMENT MANUFACTURING.; GASKET, PACKING, AND SEALING DEVICE MANUFACTURING. Organizations: RICHARD J. BERGERON (CONTACT/OPERATOR)
, H. PAUL ST. MARTIN III (CONTACT/OWNER)
BAYOU BLUE ELEMENTARY SCHOOL (1916 BAYOU BLUE ROAD in HOUMA, LA)
(Geographic Names Information System) (National Center for Education Statistics) - STATE ID-029001 Organizations: LAFOURCHE PARISH SCHOOL BOARD (SCHOOL DISTRICT)
BROADMOOR ELEMENTARY SCHOOL (1010 BROADMOOR AVENUE in HOUMA, LA)
(Geographic Names Information System) (National Center for Education Statistics) - STATE ID-055006 Organizations: TERREBONNE PARISH SCHOOL BOARD (SCHOOL DISTRICT)
OAKSHIRE ELEMENTARY SCHOOL (5459 VICARI STREET in HOUMA, LA)
(National Center for Education Statistics) - STATE ID-055029 Organizations: TERREBONNE PARISH SCHOOL BOARD (SCHOOL DISTRICT)
BAKER ATLAS (2137 BAYOU BLUE RD in HOUMA, LA) . Tribal Land
National Pollutant Discharge Elimination System NON-MAJOR (Tracking pollutant discharge elimination systems) - permit Conditionally Exempt Small Quantity Generators, less than 100 kg/month of hazardous waste (Resource Conservation and Recovery Act (tracking hazardous waste)) Business SIC classification: OIL AND GAS FIELD SERVICES Business NAICS classification: SUPPORT ACTIVITIES FOR OIL AND GAS OPERATIONS. Organizations: BAKER HUGHES OILFIELD OPERATIONS INC (CONTACT/OPERATOR)
, WESTERN ATLAS LOGGING SVCS (CONTACT/OWNER)
, BAKER HUGHES OILFIELD OPERATIONS INC (CONTACT/OWNER)
PETRO TOOL SUPPLY CO INC (4821 HWY 182 in HOUMA, LA)
AIR MINOR (AIRS/AFS) Large Quantity Generators, more that 1000 kg of hazardous waste/month (Resource Conservation and Recovery Act (tracking hazardous waste)) - notification Business SIC classification: DRILLING OIL AND GAS WELLS Business NAICS classification: SUPPORT ACTIVITIES FOR OIL AND GAS OPERATIONS. Organizations: TIM BREWER SR (CONTACT/OWNER)
Alternative names: PETRO TOOL & SUPPLY
PAULS' AUTO SALVAGE, INC. (1845 HWY 182 in HOUMA, LA)
National Pollutant Discharge Elimination System NON-MAJOR (Tracking pollutant discharge elimination systems) - permit Conditionally Exempt Small Quantity Generators, less than 100 kg/month of hazardous waste (Resource Conservation and Recovery Act (tracking hazardous waste)) - notification Business SIC classification: MOTOR VEHICLE PARTS, USED Business NAICS classification: ALL OTHER AUTOMOTIVE REPAIR AND MAINTENANCE. Organizations: MISSY DREADIN (CONTACT/OPERATOR)
, PAULS AUTO SALVAGE (CONTACT/OWNER)
ENVIR SAFETY & HEALTH CONSULT SVC (1730 COTEAU RD in HOUMA, LA)
National Pollutant Discharge Elimination System NON-MAJOR (Tracking pollutant discharge elimination systems) - permit TRANSPORTER (Resource Conservation and Recovery Act (tracking hazardous waste)) USED OIL PROGRAM (Resource Conservation and Recovery Act (tracking hazardous waste)) Business SIC classification: SEWERAGE SYSTEMS Organizations: LAWRENCE X BOUCVALT III (CONTACT/OWNER)
Alternative names: ES & H, INC.
HOUMA REPAIR FACILITY (1135 LOWER COTEAU ROAD in HOUMA, LA) . Tribal Land
National Pollutant Discharge Elimination System NON-MAJOR (Tracking pollutant discharge elimination systems) - permit HAZARDOUS WASTE BIENNIAL REPORTER (Resource Conservation and Recovery Act (tracking hazardous waste)) Small Quantity Generators, between 100 kg and 1000 kg of hazardous waste/month (Resource Conservation and Recovery Act (tracking hazardous waste)) - notification Business SIC classification: SHIP BUILDING AND REPAIRING Organizations: WEEKS MARINE INC (CONTACT/OWNER)
Alternative names: T.L. JAMES AND COMPANY, INC., T.L. JAMES AND COMPANY INC., T L JAMES & COMPANY DREDGE GROUP, WEEKS MARINE INC HOUMA RPR FAC
ALMOST ANY PART (217 NORTH HOLLYWOOD ROAD in HOUMA, LA)
National Pollutant Discharge Elimination System NON-MAJOR (Tracking pollutant discharge elimination systems) - permit Conditionally Exempt Small Quantity Generators, less than 100 kg/month of hazardous waste (Resource Conservation and Recovery Act (tracking hazardous waste)) - notification Organizations: HARVEY SHARP (CONTACT/OWNER)
HALLIBURTON ENERGY SERVICES (HWY 90 E LOWER COTEAU RD in HOUMA, LA)
National Pollutant Discharge Elimination System NON-MAJOR (Tracking pollutant discharge elimination systems) - permit Small Quantity Generators, between 100 kg and 1000 kg of hazardous waste/month (Resource Conservation and Recovery Act (tracking hazardous waste)) - notification Business NAICS classification: SUPPORT ACTIVITIES FOR OIL AND GAS OPERATIONS. Organizations: HALLIBURTON ENERGY SVCS (CONTACT/OWNER)
QUALITY SHIPYARD INC, YARD 1 (940 HWY 182 in HOUMA, LA) . Tribal Land
Large Quantity Generators, more that 1000 kg of hazardous waste/month (Resource Conservation and Recovery Act (tracking hazardous waste)) Business NAICS classification: SHIP BUILDING AND REPAIRING. Organizations: TIDEWATER INC (CONTACT/OWNER)
Alternative names: QUALITY SHIPYARD YARD 1
BOYDS BIT SERVICE INC (2466 BAYOU BLUE RD in HOUMA, LA)
National Pollutant Discharge Elimination System NON-MAJOR (Tracking pollutant discharge elimination systems) - permit Business SIC classification: OIL AND GAS FIELD EXPLORATION SERVICES
Housing units lacking complete plumbing facilities: 2.1% Housing units lacking complete kitchen facilities: 2.9%
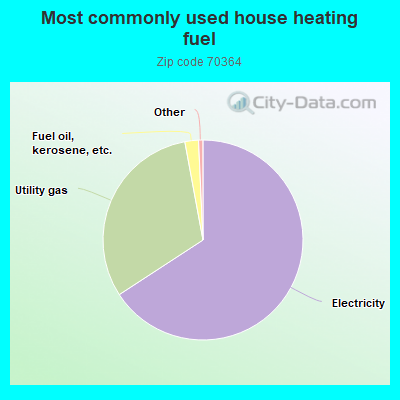
65.8%Electricity
31.3%Utility gas
2.2%Fuel oil, kerosene, etc.
Population in 1990: 25,330. Population change in the 1990s: +2,075 (+8.2%).
Place of birth for U.S.-born residents:
This state: 24,382
Northeast: 151
Midwest: 742
South: 2,239
West: 940
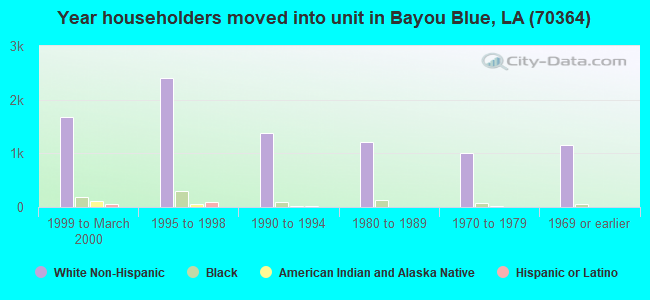
61% of the 70364 zip code residents lived in the same house 5 years ago. Out of people who lived in different houses, 64% lived in this county. Out of people who lived in different counties, 50% lived in Louisiana.
90% of the 70364 zip code residents lived in the same house 1 year ago. Out of people who lived in different houses, 79% moved from this county. Out of people who lived in different houses, 13% moved from different county within same state. Out of people who lived in different houses, 5% moved from different state.
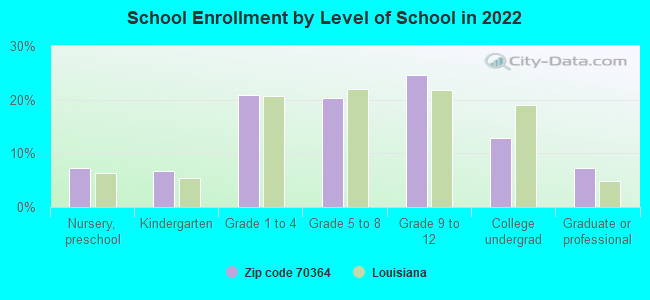
Private vs. public school enrollment:
Students in private schools in grades 1 to 8 (elementary and middle school): 677
Here:
22.6%
Louisiana:
19.6%
Students in private schools in grades 9 to 12 (high school): 358
Here:
19.8%
Louisiana:
18.3%
Students in private undergraduate colleges:
Here:
0.0%
Louisiana:
17.4%
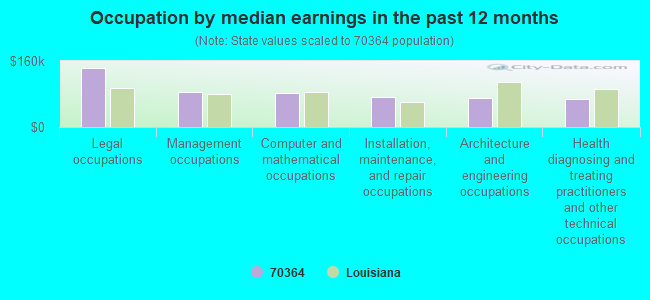
Occupation by median earnings in the past 12 months ($)
142,711Legal occupations
84,113Management occupations
82,918Computer and mathematical occupations
72,667Installation, maintenance, and repair occupations
71,295Architecture and engineering occupations
67,134Health diagnosing and treating practitioners and other technical occupations
Companies with federal contracts located in this zip code (HOUMA, LA):
GMD INTL COMER INC (201 NORTH HOLLYWOOD ROAD; small business) : $86,234 in 6 contractsin 2003
Contracts for Miscellaneous Electrical and Electronic Components, Oscillators and Piezoelectric Crystals, Laboratory Equipment and Supplies, Misc Fiber Optic Components by NASA, Navy, Army, U.S. Army Corps of Engineers - civil program financing only, and others Signed by year:2000: $0; 2001: $0; 2002: $0; 2003: $86,234; 2004: $0; 2005: $0; 2006: $0.
Biggest contracts:
$49,237 with NASA for Miscellaneous Electrical and Electronic Components. Signed on 2003-04-15. Completion date: 2003-05-15.
$16,800 with Navy for Oscillators and Piezoelectric Crystals. Signed on 2003-06-30. Completion date: 2003-07-11.
$9,207 with Army for Laboratory Equipment and Supplies. Signed on 2003-11-17. Completion date: 2003-12-05.
$4,015 with Navy for Miscellaneous Electrical and Electronic Components. Signed on 2003-09-24. Completion date: 2003-10-17.
CHRISTIAN PLASTICS, INC (240 NORTH HOLLYWOOD ROAD; small business)
$33,563 with U.S. Army Corps of Engineers - civil program financing only for Construction of Structures and Facilities -- Other Non-Building Facilities. Signed on 2001-08-21. Completion date: 2001-09-30.
ENVIRONMENTAL, SAFETY & HEALTH (1730 COTEAU RD; small business) : $15,763 in 4 contractsfrom 2003 to 2006
$38,760 with U.S. Army Corps of Engineers - civil program financing only for Hazardous Substance Removal, Cleanup, and Disposal Services and Operational Support. Signed on 2003-02-03. Completion date: 2003-02-04.
$0 with Army for Hazardous Substance Removal, Cleanup, and Disposal Services and Operational Support. Signed on 2006-01-23. Completion date: 2000-03-17.
-$4,229, same as above.Signed on 2006-01-23. Completion date: 2000-03-17.
-$18,768, same as above.Signed on 2006-01-19. Completion date: 2003-02-04.
CANNATA'S SUPER MARKET INC (6289 WESTPARK AVE STE 5; small business)
$6,275 with Army for Food Items For Resale. Signed on 2004-05-11. Completion date: 2004-05-15.
Top industries in this zip code by the number of employees in 2005:
Health Care and Social Assistance: Services for the Elderly and Persons with Disabilities (100-249: 1)
Real Estate and Rental and Leasing: Construction, Mining, and Forestry Machinery and Equipment Rental and Leasing (50-99: 1, 20-49: 1, 10-19: 3, 1-4: 2)
People in group quarters in 2010:
112 people in nursing facilities/skilled-nursing facilities
13 people in group homes intended for adults
2 people in other noninstitutional facilities
People in group quarters in 2000:
114 people in nursing homes
8 people in other group homes
4 people in homes for the mentally ill
3 people in religious group quarters
Fatal accident statistics in 2014:
Fatal accident count: 6
Vehicles involved in fatal accidents: 8
Fatal accidents caused by drunken drivers: 3
Fatalities: 7
Persons involved in fatal accidents: 10
Pedestrians involved in fatal accidents: 2
Fatal accident statistics in 2013:
Fatal accident count: 5
Vehicles involved in fatal accidents: 10
Fatal accidents caused by drunken drivers: 3
Fatalities: 7
Persons involved in fatal accidents: 16
Pedestrians involved in fatal accidents: 0
Home Mortgage Disclosure Act Aggregated Statistics For Year 2009 (Based on 4 full and 8 partial tracts)
A) FHA, FSA/RHS & VA Home Purchase Loans
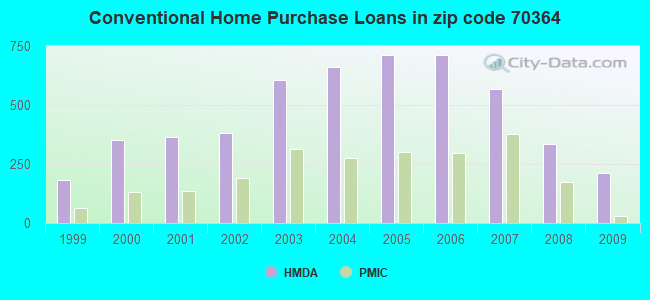
B) Conventional Home Purchase Loans
C) Refinancings
D) Home Improvement Loans
E) Loans on Dwellings For 5+ Families
F) Non-occupant Loans on < 5 Family Dwellings (A B C & D)
G) Loans On Manufactured Home Dwelling (A B C & D)
Number
Average Value
Number
Average Value
Number
Average Value
Number
Average Value
Number
Average Value
Number
Average Value
Number
Average Value
LOANS ORIGINATED
244
$151,668
210
$116,866
701
$120,600
167
$32,948
10
$1,321,779
134
$99,147
42
$32,232
APPLICATIONS APPROVED, NOT ACCEPTED
12
$132,310
32
$132,186
80
$155,636
21
$30,799
2
$2,591,940
16
$212,972
8
$70,640
APPLICATIONS DENIED
47
$134,235
102
$102,137
423
$125,598
118
$49,853
0
$0
33
$101,900
59
$60,000
APPLICATIONS WITHDRAWN
23
$168,978
26
$133,678
169
$147,671
17
$71,021
0
$0
9
$305,513
3
$57,970
FILES CLOSED FOR INCOMPLETENESS
12
$136,181
5
$78,056
68
$137,351
9
$86,331
0
$0
2
$113,645
1
$69,340
Aggregated Statistics For Year 2008 (Based on 4 full and 8 partial tracts)
A) FHA, FSA/RHS & VA Home Purchase Loans
B) Conventional Home Purchase Loans
C) Refinancings
D) Home Improvement Loans
E) Loans on Dwellings For 5+ Families
F) Non-occupant Loans on < 5 Family Dwellings (A B C & D)
G) Loans On Manufactured Home Dwelling (A B C & D)
Number
Average Value
Number
Average Value
Number
Average Value
Number
Average Value
Number
Average Value
Number
Average Value
Number
Average Value
LOANS ORIGINATED
221
$149,397
336
$132,059
554
$116,410
159
$33,180
6
$314,972
139
$117,846
40
$47,083
APPLICATIONS APPROVED, NOT ACCEPTED
28
$142,947
41
$88,685
104
$110,981
25
$44,380
5
$450,018
10
$109,910
27
$51,173
APPLICATIONS DENIED
43
$152,213
132
$91,291
403
$121,576
139
$59,707
0
$0
11
$96,160
95
$57,966
APPLICATIONS WITHDRAWN
18
$136,744
28
$118,555
112
$136,002
9
$65,697
0
$0
4
$76,862
4
$110,085
FILES CLOSED FOR INCOMPLETENESS
4
$155,605
9
$170,851
39
$135,029
7
$73,347
0
$0
3
$25,437
2
$143,435
Aggregated Statistics For Year 2007 (Based on 4 full and 8 partial tracts)
A) FHA, FSA/RHS & VA Home Purchase Loans
B) Conventional Home Purchase Loans
C) Refinancings
D) Home Improvement Loans
E) Loans on Dwellings For 5+ Families
F) Non-occupant Loans on < 5 Family Dwellings (A B C & D)
G) Loans On Manufactured Home Dwelling (A B C & D)
Number
Average Value
Number
Average Value
Number
Average Value
Number
Average Value
Number
Average Value
Number
Average Value
Number
Average Value
LOANS ORIGINATED
70
$133,909
568
$121,874
660
$103,812
236
$47,261
4
$228,220
130
$91,085
50
$45,514
APPLICATIONS APPROVED, NOT ACCEPTED
9
$61,571
83
$92,537
124
$93,435
28
$47,050
0
$0
5
$112,836
33
$55,983
APPLICATIONS DENIED
12
$115,245
130
$92,053
467
$110,968
173
$52,462
0
$0
30
$70,840
72
$51,090
APPLICATIONS WITHDRAWN
2
$114,545
61
$95,328
171
$116,052
25
$73,457
1
$1,842,800
8
$91,546
16
$39,068
FILES CLOSED FOR INCOMPLETENESS
4
$138,070
22
$135,730
53
$130,388
2
$32,035
0
$0
2
$149,535
0
$0
Aggregated Statistics For Year 2006 (Based on 4 full and 8 partial tracts)
A) FHA, FSA/RHS & VA Home Purchase Loans
B) Conventional Home Purchase Loans
C) Refinancings
D) Home Improvement Loans
E) Loans on Dwellings For 5+ Families
F) Non-occupant Loans on < 5 Family Dwellings (A B C & D)
G) Loans On Manufactured Home Dwelling (A B C & D)
Number
Average Value
Number
Average Value
Number
Average Value
Number
Average Value
Number
Average Value
Number
Average Value
Number
Average Value
LOANS ORIGINATED
100
$120,437
712
$105,059
622
$115,526
207
$38,924
8
$375,820
105
$217,708
44
$51,015
APPLICATIONS APPROVED, NOT ACCEPTED
3
$77,193
151
$82,620
180
$86,770
32
$31,560
0
$0
12
$142,319
57
$47,146
APPLICATIONS DENIED
23
$60,794
251
$83,626
531
$87,528
140
$41,081
2
$448,605
41
$95,418
142
$47,744
APPLICATIONS WITHDRAWN
18
$126,382
99
$96,476
293
$103,919
28
$56,677
0
$0
10
$94,982
9
$48,411
FILES CLOSED FOR INCOMPLETENESS
0
$0
20
$110,484
100
$106,602
0
$0
0
$0
4
$86,628
0
$0
Aggregated Statistics For Year 2005 (Based on 4 full and 8 partial tracts)
A) FHA, FSA/RHS & VA Home Purchase Loans
B) Conventional Home Purchase Loans
C) Refinancings
D) Home Improvement Loans
E) Loans on Dwellings For 5+ Families
F) Non-occupant Loans on < 5 Family Dwellings (A B C & D)
G) Loans On Manufactured Home Dwelling (A B C & D)
Number
Average Value
Number
Average Value
Number
Average Value
Number
Average Value
Number
Average Value
Number
Average Value
Number
Average Value
LOANS ORIGINATED
120
$107,389
713
$96,719
734
$91,980
169
$30,829
3
$1,220,240
148
$94,813
69
$42,301
APPLICATIONS APPROVED, NOT ACCEPTED
21
$79,552
127
$75,587
185
$87,393
35
$37,329
0
$0
20
$78,909
47
$44,582
APPLICATIONS DENIED
43
$61,980
263
$59,945
683
$88,118
136
$37,272
0
$0
52
$65,797
208
$40,936
APPLICATIONS WITHDRAWN
9
$125,740
81
$92,676
282
$106,144
55
$96,167
2
$4,486,050
12
$97,513
10
$42,669
FILES CLOSED FOR INCOMPLETENESS
4
$103,838
33
$100,129
186
$108,023
8
$28,961
0
$0
3
$102,050
1
$51,100
Aggregated Statistics For Year 2004 (Based on 4 full and 8 partial tracts)
A) FHA, FSA/RHS & VA Home Purchase Loans
B) Conventional Home Purchase Loans
C) Refinancings
D) Home Improvement Loans
E) Loans on Dwellings For 5+ Families
F) Non-occupant Loans on < 5 Family Dwellings (A B C & D)
G) Loans On Manufactured Home Dwelling (A B C & D)
Number
Average Value
Number
Average Value
Number
Average Value
Number
Average Value
Number
Average Value
Number
Average Value
Number
Average Value
LOANS ORIGINATED
131
$106,756
660
$98,301
889
$84,017
225
$32,550
5
$450,134
135
$81,112
67
$39,384
APPLICATIONS APPROVED, NOT ACCEPTED
29
$69,929
109
$74,602
195
$86,900
39
$29,351
2
$797,520
15
$61,911
64
$36,434
APPLICATIONS DENIED
43
$91,573
268
$58,725
701
$76,800
166
$30,961
2
$996,900
51
$44,156
193
$39,826
APPLICATIONS WITHDRAWN
2
$111,630
47
$78,850
302
$90,576
26
$28,245
0
$0
9
$66,534
14
$53,874
FILES CLOSED FOR INCOMPLETENESS
3
$112,000
16
$99,144
198
$90,112
4
$30,832
0
$0
1
$106,140
1
$56,360
Aggregated Statistics For Year 2003 (Based on 4 full and 8 partial tracts)
A) FHA, FSA/RHS & VA Home Purchase Loans
B) Conventional Home Purchase Loans
C) Refinancings
D) Home Improvement Loans
E) Loans on Dwellings For 5+ Families
F) Non-occupant Loans on < 5 Family Dwellings (A B C & D)
Number
Average Value
Number
Average Value
Number
Average Value
Number
Average Value
Number
Average Value
Number
Average Value
LOANS ORIGINATED
170
$92,717
607
$89,545
1,671
$78,226
213
$21,435
9
$248,189
184
$85,622
APPLICATIONS APPROVED, NOT ACCEPTED
29
$86,169
70
$87,738
273
$69,627
38
$24,177
0
$0
12
$64,298
APPLICATIONS DENIED
14
$64,250
177
$55,220
799
$72,454
127
$22,936
0
$0
37
$57,419
APPLICATIONS WITHDRAWN
10
$100,350
40
$107,092
263
$87,182
3
$35,270
0
$0
7
$47,470
FILES CLOSED FOR INCOMPLETENESS
4
$85,618
26
$102,893
75
$85,456
3
$18,480
0
$0
0
$0
Aggregated Statistics For Year 2002 (Based on 4 full and 4 partial tracts)
A) FHA, FSA/RHS & VA Home Purchase Loans
B) Conventional Home Purchase Loans
C) Refinancings
D) Home Improvement Loans
E) Loans on Dwellings For 5+ Families
F) Non-occupant Loans on < 5 Family Dwellings (A B C & D)
Number
Average Value
Number
Average Value
Number
Average Value
Number
Average Value
Number
Average Value
Number
Average Value
LOANS ORIGINATED
98
$86,870
382
$79,521
758
$68,977
182
$23,859
5
$222,146
113
$55,730
APPLICATIONS APPROVED, NOT ACCEPTED
19
$87,779
45
$52,465
175
$59,128
26
$22,870
0
$0
12
$85,207
APPLICATIONS DENIED
12
$86,008
141
$57,188
354
$58,860
100
$18,666
0
$0
23
$49,388
APPLICATIONS WITHDRAWN
10
$78,873
18
$75,450
103
$74,334
6
$23,363
0
$0
3
$42,777
FILES CLOSED FOR INCOMPLETENESS
1
$65,040
6
$66,407
53
$78,501
0
$0
0
$0
4
$56,658
Aggregated Statistics For Year 2001 (Based on 4 full and 4 partial tracts)
A) FHA, FSA/RHS & VA Home Purchase Loans
B) Conventional Home Purchase Loans
C) Refinancings
D) Home Improvement Loans
E) Loans on Dwellings For 5+ Families
F) Non-occupant Loans on < 5 Family Dwellings (A B C & D)
Number
Average Value
Number
Average Value
Number
Average Value
Number
Average Value
Number
Average Value
Number
Average Value
LOANS ORIGINATED
139
$86,256
366
$78,574
804
$67,793
206
$21,335
3
$427,200
98
$74,226
APPLICATIONS APPROVED, NOT ACCEPTED
4
$87,595
41
$67,903
141
$63,058
41
$19,707
1
$292,680
14
$90,357
APPLICATIONS DENIED
22
$78,032
151
$46,387
399
$60,811
117
$16,711
0
$0
28
$40,881
APPLICATIONS WITHDRAWN
15
$76,771
29
$81,012
214
$65,106
7
$10,687
0
$0
8
$60,961
FILES CLOSED FOR INCOMPLETENESS
6
$56,618
8
$79,609
45
$86,176
0
$0
0
$0
0
$0
Aggregated Statistics For Year 2000 (Based on 4 full and 4 partial tracts)
A) FHA, FSA/RHS & VA Home Purchase Loans
B) Conventional Home Purchase Loans
C) Refinancings
D) Home Improvement Loans
E) Loans on Dwellings For 5+ Families
F) Non-occupant Loans on < 5 Family Dwellings (A B C & D)
Number
Average Value
Number
Average Value
Number
Average Value
Number
Average Value
Number
Average Value
Number
Average Value
LOANS ORIGINATED
105
$84,983
353
$68,810
271
$58,219
184
$15,201
2
$114,620
70
$46,980
APPLICATIONS APPROVED, NOT ACCEPTED
18
$74,049
74
$54,501
119
$56,967
39
$19,241
0
$0
19
$58,546
APPLICATIONS DENIED
20
$60,711
203
$41,211
355
$52,114
112
$18,456
0
$0
32
$58,668
APPLICATIONS WITHDRAWN
9
$74,237
31
$60,290
151
$55,893
10
$24,059
0
$0
8
$17,940
FILES CLOSED FOR INCOMPLETENESS
0
$0
19
$98,033
49
$68,223
1
$18,100
0
$0
6
$130,913
Aggregated Statistics For Year 1999 (Based on 2 full and 3 partial tracts)
A) FHA, FSA/RHS & VA Home Purchase Loans
B) Conventional Home Purchase Loans
C) Refinancings
D) Home Improvement Loans
E) Loans on Dwellings For 5+ Families
F) Non-occupant Loans on < 5 Family Dwellings (A B C & D)
2002 - 2018 National Fire Incident Reporting System (NFIRS) incidents
Based on the data from the years 2002 - 2018 the average number of fire incidents per year is 51. The highest number of fires - 83 took place in 2008, and the least - 10 in 2007. The data has a rising trend.
When looking into fire subcategories, the most incidents belonged to: Outside Fires (47.2%), and Structure Fires (36.5%).
Fire incident types reported to NFIRS in Zip Code 70364


 Nearest zip codes: 70363, 70394, 70359, 70360, 70343, 70375.
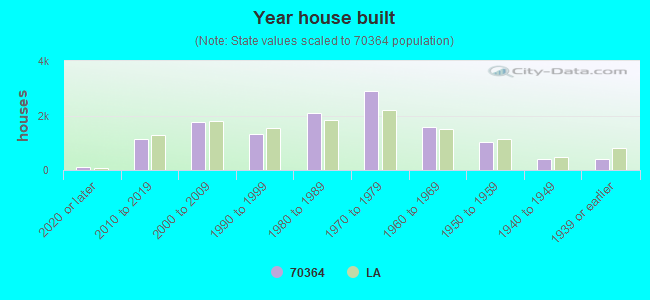


 Based on the data from the years 2002 - 2018 the average number of fire incidents per year is 51. The highest number of fires - 83 took place in 2008, and the least - 10 in 2007. The data has a rising trend.
 When looking into fire subcategories, the most incidents belonged to: Outside Fires (47.2%), and Structure Fires (36.5%).