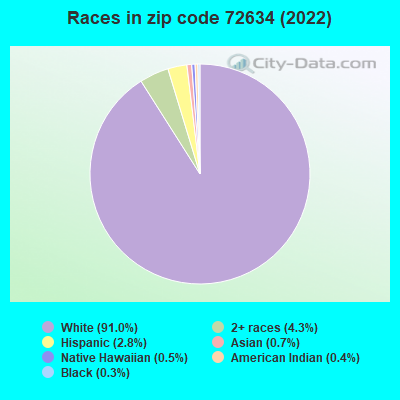
Estimated zip code population in 2022: 4,584 Zip code population in 2010: 4,670 Zip code population in 2000: 4,334
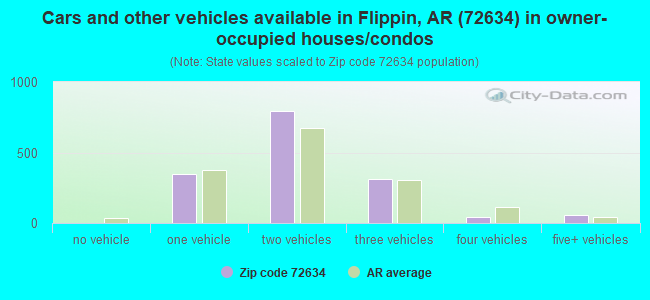
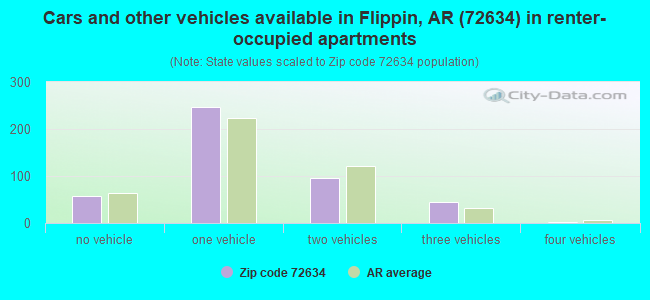
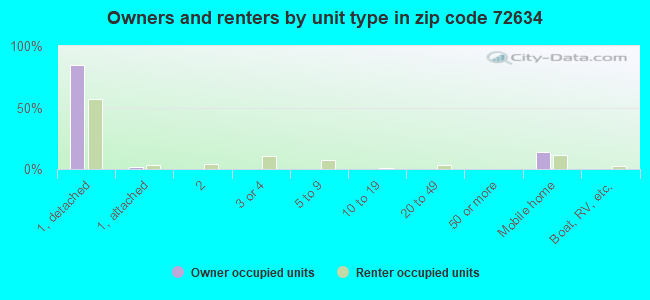
Houses and condos: 2,452 Renter-occupied apartments: 448
% of renters here:
22%
State:
34%
March 2022 cost of living index in zip code 72634: 79.1 (low, U.S. average is 100)
Land area: 128.3 sq. mi. Water area: 2.9 sq. mi.
Population density: 36 people per square mile
(very low).
OSM Map
General Map
Google Map
MSN Map
OSM Map
General Map
Google Map
MSN Map
OSM Map
General Map
Google Map
MSN Map
OSM Map
General Map
Google Map
MSN Map
Please wait while loading the map...
Real estate property taxes paid for housing units in 2022:
This zip code:
0.5% ($802)
Arkansas:
0.5% ($977)
Median real estate property taxes paid for housing units with mortgages in 2022: $812 (0.6%) Median real estate property taxes paid for housing units with no mortgage in 2022: $820 (0.5%)
Averages for the 2020 tax year for zip code 72634, filed in 2021:
Average Adjusted Gross Income (AGI) in 2020: $46,597 (Individual Income Tax Returns)
Here:
$46,597
State:
$64,872
Salary/wage: $40,281 (reported on 76.4% of returns)
Here:
$40,281
State:
$50,644
(% of AGI for various income ranges: 1133.2% for AGIs below $25k, 3267.1% for AGIs $25k-50k, 6355.0% for AGIs $50k-75k, 8088.5% for AGIs $75k-100k, 13962.2% for AGIs $100k-200k)
Taxable interest for individuals: $993 (reported on 28.4% of returns)
This zip code:
$993
Arkansas:
$1,857
(% of AGI for various income ranges: 21.7% for AGIs below $25k, 21.6% for AGIs $25k-50k, 36.7% for AGIs $50k-75k, 87.7% for AGIs $75k-100k, 180.0% for AGIs $100k-200k)
Ordinary dividends: $4,504 (reported on 12.5% of returns)
Here:
$4,504
State:
$21,681
(% of AGI for various income ranges: 19.5% for AGIs below $25k, 32.4% for AGIs $25k-50k, 104.4% for AGIs $50k-75k, 223.1% for AGIs $75k-100k, 465.6% for AGIs $100k-200k)
Net capital gain/loss in AGI: +$7,466 (reported on 13.9% of returns)
Here:
+$7,466
State:
+$22,815
(% of AGI for various income ranges: 23.2% for AGIs below $25k, 28.4% for AGIs $25k-50k, 107.2% for AGIs $50k-75k, 553.8% for AGIs $75k-100k, 1084.4% for AGIs $100k-200k)
Profit/loss from business: +$6,574 (reported on 14.9% of returns)
Here:
+$6,574
State:
+$9,743
(% of AGI for various income ranges: 126.6% for AGIs below $25k, 133.7% for AGIs $25k-50k, 230.6% for AGIs $50k-75k, 123.1% for AGIs $75k-100k, 67.8% for AGIs $100k-200k)
Taxable individual retirement arrangement distribution: $15,219 (reported on 10.1% of returns)
72634:
$15,219
Arkansas:
$18,502
(% of AGI for various income ranges: 53.7% for AGIs below $25k, 110.8% for AGIs $25k-50k, 301.1% for AGIs $50k-75k, 356.2% for AGIs $75k-100k, 1478.9% for AGIs $100k-200k)
Total itemized deductions: $33,560 (reported on 2.4% of returns)
Here:
$33,560
State:
$52,840
(% of AGI for various income ranges: 507.8% for AGIs $50k-75k, 848.9% for AGIs $100k-200k)
Charity contributions: $7,150 (reported on 1.9% of returns)
Here:
$7,150
State:
$35,735
(% of AGI for various income ranges: 220.0% for AGIs $75k-100k)
Taxes paid: $5,960 (reported on 2.4% of returns)
72634:
$5,960
State:
$7,196
(% of AGI for various income ranges: 63.3% for AGIs $50k-75k, 204.4% for AGIs $100k-200k)
Earned income credit: $2,400 (reported on 21.6% of returns)
Here:
$2,400
State:
$2,546
(% of AGI for various income ranges: 113.7% for AGIs below $25k, 83.5% for AGIs $25k-50k)
Percentage of individuals using paid preparers for their 2020 taxes: 94.7%
Here:
95%
State:
94%
(% for various income ranges: 93.9% for AGIs below $25k, 95.1% for AGIs $25k-50k, 96.3% for AGIs $50k-75k, 94.7% for AGIs $75k-100k, 93.8% for AGIs $100k-200k, 100.0% for AGIs over 200k)
Averages for the 2012 tax year for zip code 72634, filed in 2013:
Average Adjusted Gross Income (AGI) in 2012: $37,288 (Individual Income Tax Returns)
Here:
$37,288
State:
$52,148
Salary/wage: $32,145 (reported on 78.5% of returns)
Here:
$32,145
State:
$41,669
(% of AGI for various income ranges: 76.1% for AGIs below $25k, 73.9% for AGIs $25k-50k, 69.5% for AGIs $50k-75k, 64.7% for AGIs $75k-100k, 54.7% for AGIs $100k-200k)
Taxable interest for individuals: $1,194 (reported on 32.5% of returns)
This zip code:
$1,194
Arkansas:
$1,648
(% of AGI for various income ranges: 1.2% for AGIs below $25k, 1.1% for AGIs $25k-50k, 0.8% for AGIs $50k-75k, 0.4% for AGIs $75k-100k, 1.5% for AGIs $100k-200k)
Ordinary dividends: $3,242 (reported on 17.3% of returns)
Here:
$3,242
State:
$20,675
(% of AGI for various income ranges: 1.2% for AGIs below $25k, 1.5% for AGIs $25k-50k, 1.9% for AGIs $50k-75k, 1.1% for AGIs $75k-100k, 1.7% for AGIs $100k-200k)
Net capital gain/loss in AGI: +$2,679 (reported on 15.2% of returns)
Here:
+$2,679
State:
+$15,222
(% of AGI for various income ranges: 1.1% for AGIs $25k-50k, 0.3% for AGIs $50k-75k, 1.1% for AGIs $75k-100k, 2.7% for AGIs $100k-200k)
Profit/loss from business: +$6,032 (reported on 17.8% of returns)
Here:
+$6,032
State:
+$9,665
(% of AGI for various income ranges: 6.0% for AGIs below $25k, 2.4% for AGIs $25k-50k, 2.3% for AGIs $50k-75k, 5.0% for AGIs $75k-100k)
Taxable individual retirement arrangement distribution: $15,605 (reported on 11.0% of returns)
72634:
$15,605
Arkansas:
$13,644
(% of AGI for various income ranges: 3.1% for AGIs below $25k, 3.3% for AGIs $25k-50k, 4.9% for AGIs $50k-75k, 6.0% for AGIs $75k-100k, 5.9% for AGIs $100k-200k)
Total itemized deductions: $18,974 (26% of AGI, reported on 17.8% of returns)
Here:
$18,974
State:
$23,276
Here:
25.9% of AGI
State:
19.1% of AGI
(% of AGI for various income ranges: 6.8% for AGIs below $25k, 8.0% for AGIs $25k-50k, 7.4% for AGIs $50k-75k, 10.1% for AGIs $75k-100k, 12.9% for AGIs $100k-200k)
Charity contributions: $3,940 (reported on 13.1% of returns)
Here:
$3,940
State:
$5,996
(% of AGI for various income ranges: 0.6% for AGIs below $25k, 1.2% for AGIs $25k-50k, 0.9% for AGIs $50k-75k, 1.8% for AGIs $75k-100k, 2.3% for AGIs $100k-200k)
Taxes paid: $4,882 (reported on 17.3% of returns)
72634:
$4,882
State:
$7,941
(% of AGI for various income ranges: 0.7% for AGIs below $25k, 1.3% for AGIs $25k-50k, 1.6% for AGIs $50k-75k, 2.7% for AGIs $75k-100k, 4.9% for AGIs $100k-200k)
Earned income credit: $2,236 (reported on 26.2% of returns)
Here:
$2,236
State:
$2,455
(% of AGI for various income ranges: 7.0% for AGIs below $25k, 1.3% for AGIs $25k-50k)
Percentage of individuals using paid preparers for their 2012 taxes: 64.9%
Here:
65%
State:
61%
(% for various income ranges: 60.4% for AGIs below $25k, 68.1% for AGIs $25k-50k, 64.0% for AGIs $50k-75k, 69.2% for AGIs $75k-100k, 90.0% for AGIs $100k-200k)
Averages for the 2004 tax year for zip code 72634, filed in 2005:
Average Adjusted Gross Income (AGI) in 2004: $31,313 (Individual Income Tax Returns)
Here:
$31,313
State:
$39,270
Salary/wage: $27,842 (reported on 80.4% of returns)
Here:
$27,842
State:
$34,079
(% of AGI for various income ranges: 280.4% for AGIs below $10k, 74.9% for AGIs $10k-25k, 75.8% for AGIs $25k-50k, 67.7% for AGIs $50k-75k, 64.0% for AGIs $75k-100k, 58.0% for AGIs over 100k)
Taxable interest for individuals: $1,888 (reported on 40.1% of returns)
This zip code:
$1,888
Arkansas:
$1,904
(% of AGI for various income ranges: 27.7% for AGIs below $10k, 2.1% for AGIs $10k-25k, 2.1% for AGIs $25k-50k, 1.7% for AGIs $50k-75k, 3.7% for AGIs $75k-100k, 2.2% for AGIs over 100k)
Taxable dividends: $1,653 (reported on 18.0% of returns)
Here:
$1,653
State:
$5,995
(% of AGI for various income ranges: 5.6% for AGIs below $10k, 1.2% for AGIs $10k-25k, 0.8% for AGIs $25k-50k, 0.7% for AGIs $50k-75k, 1.6% for AGIs $75k-100k, 0.7% for AGIs over 100k)
Net capital gain/loss: +$5,840 (reported on 17.5% of returns)
Here:
+$5,840
State:
+$10,430
(% of AGI for various income ranges: 5.8% for AGIs below $10k, 1.2% for AGIs $10k-25k, 1.4% for AGIs $25k-50k, 2.1% for AGIs $50k-75k, 7.4% for AGIs $75k-100k, 7.5% for AGIs over 100k)
Profit/loss from business: +$4,314 (reported on 19.9% of returns)
Here:
+$4,314
State:
+$7,823
(% of AGI for various income ranges: 45.7% for AGIs below $10k, 4.7% for AGIs $10k-25k, 2.9% for AGIs $25k-50k, 2.5% for AGIs $50k-75k, -0.1% for AGIs $75k-100k, 0.1% for AGIs over 100k)
IRA payment deduction: $3,523 (reported on 3.4% of returns)
72634:
$3,523
Arkansas:
$3,204
Total itemized deductions: $15,172 (23% of AGI, reported on 18.3% of returns)
Here:
$15,172
State:
$18,389
Here:
22.8% of AGI
State:
21.0% of AGI
(% of AGI for various income ranges: 21.2% for AGIs below $10k, 6.5% for AGIs $10k-25k, 7.6% for AGIs $25k-50k, 9.0% for AGIs $50k-75k, 13.3% for AGIs $75k-100k, 10.3% for AGIs over 100k)
Charity contributions deductions: $3,447 (5% of AGI, reported on 14.6% of returns)
Here:
$3,447
State:
$4,725
Here:
4.8% of AGI
State:
5.1% of AGI
(% of AGI for various income ranges: 0.9% for AGIs $10k-25k, 1.2% for AGIs $25k-50k, 1.9% for AGIs $50k-75k, 3.0% for AGIs $75k-100k, 2.0% for AGIs over 100k)
Total tax: $3,809 (reported on 71.6% of returns)
72634:
$3,809
State:
$6,047
(% of AGI for various income ranges: 11.6% for AGIs below $10k, 3.7% for AGIs $10k-25k, 5.9% for AGIs $25k-50k, 8.6% for AGIs $50k-75k, 10.7% for AGIs $75k-100k, 17.6% for AGIs over 100k)
Earned income credit: $1,692 (reported on 21.3% of returns)
Here:
$1,692
State:
$1,909
Percentage of individuals using paid preparers for their 2004 taxes: 70.2%
Here:
70%
State:
67%
(% for various income ranges: 60.3% for AGIs below $10k, 68.4% for AGIs $10k-25k, 74.1% for AGIs $25k-50k, 75.9% for AGIs $50k-75k, 85.1% for AGIs $75k-100k, 86.9% for AGIs over 100k)
Household received Food Stamps/SNAP in the past 12 months: 159 Household did not receive Food Stamps/SNAP in the past 12 months: 1,839
Women who had a birth in the past 12 months: 69 (60 now married, 10 unmarried) Women who did not have a birth in the past 12 months: 668 (420 now married, 249 unmarried)
Housing units in zip code 72634 with a mortgage: 732 (33 second mortgage, 2 home equity loan, 29 both second mortgage and home equity loan) Median monthly owner costs for units with a mortgage: $929 Median monthly owner costs for units without a mortgage: $384
Residents with income below the poverty level in 2022:
This zip code:
12.9%
Whole state:
16.8%
Residents with income below 50% of the poverty level in 2022:
This zip code:
6.2%
Whole state:
8.5%
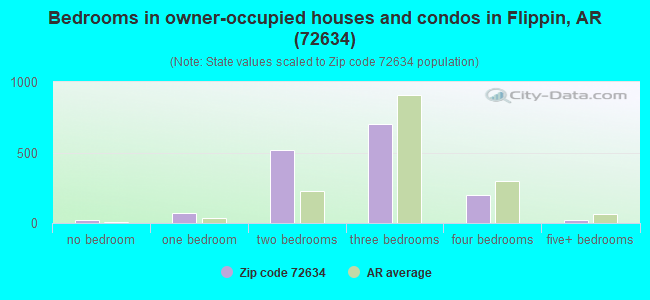
Median number of rooms in houses and condos:
Here:
5.8
State:
6.1
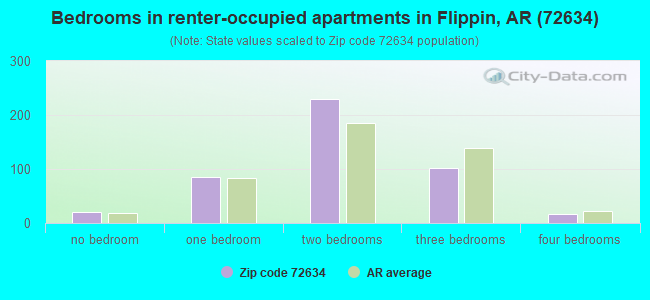
Median number of rooms in apartments:
Here:
4.5
State:
4.3
Notable locations in this zip code not listed on our city pages
Notable locations in zip code 72634: Buffalo Landing (A), McBee Landing (B), Fairview Rural Volunteer Fire Department (C), Flippin Fire Department (D), Rea Valley Volunteer Fire Department (E), Flippin Police Department (F), Rea Valley Fire Station 2 (G). Display/hide their locations on the map
Churches in zip code 72634 include: Rea Valley Baptist Church (A), Fairview Church of Christ (B), Antioch Number 1 Baptist Church (C). Display/hide their locations on the map
Cemeteries: Fairview Cemetery (1), Elm Springs Cemetery (2), Williams Cemetery (3), Ott Cemetery (4), Burch Cemetery (5), Mountain View Cemetery (6), Hurst Cemetery (7). Display/hide their locations on the map
Streams, rivers, and creeks: Mitchell Creek (A), Crooked Creek (B), Cow Creek (C), Cedar Creek (D), Jenkins Branch (E), Ingram Creek (F), Boat Creek (G), Big Creek (H), Buffalo River (I). Display/hide their locations on the map
In group quarters: 65 (-1 institutionalized population)
Size of family households: 689 2-persons, 222 3-persons, 220 4-persons, 65 5-persons, 12 6-persons
Size of nonfamily households: 681 1-person, 105 2-persons
549 married couples with children.
200 single-parent households (9 men, 191 women).
95.5% of residents of 72634 zip code speak English at home.
1.7% of residents speak Spanish at home (75% very well, 25% not well).
3.0% of residents speak other Indo-European language at home (90% very well, 3% well, 7% not at all).
0.2% of residents speak other language at home (100% very well).
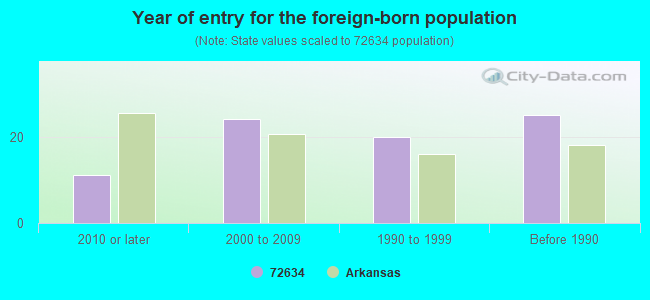
Foreign born population: 73 (1.6%) (75.3% of them are naturalized citizens)
This zip code:
1.6%
Whole state:
5.1%
26%Liberia
15%Australia
14%Albania
10%France
8%North Macedonia (Macedonia)
6%Malaysia
3%Indonesia
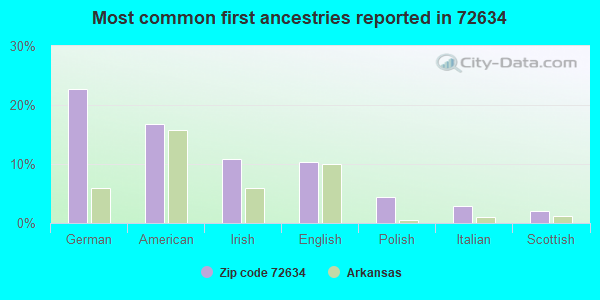
23%German
17%American
11%Irish
10%English
4%Polish
3%Italian
2%Scottish
Year of entry for the foreign-born population
112010 or later
242000 to 2009
201990 to 1999
25Before 1990
Facilities with environmental interests located in this zip code:
FLIPPIN ELEMENTARY SCHOOL (209 ALFORD STREET in FLIPPIN, AR)
(Geographic Names Information System) (National Center for Education Statistics) - STATE ID-4501001
FLIPPIN HIGH SCHOOL (103 ALFORD STREET in FLIPPIN, AR)
(Geographic Names Information System) (National Center for Education Statistics) - STATE ID-4501002
FLIPPIN MIDDLE SCHOOL (308 NORTH FIRST STREET in FLIPPIN, AR)
(Geographic Names Information System) (National Center for Education Statistics) - STATE ID-4501003
FLIPPIN WW TREATMENT PLANT (222 INDUSTRIAL DRD in FLIPPIN, AR)
National Pollutant Discharge Elimination System NON-MAJOR (Tracking pollutant discharge elimination systems) - permit COMMUNITY WATER SYSTEM (SDWIS) Business SIC classification: SEWERAGE SYSTEMS Alternative names: FLIPPIN, CITY OF, FLIPPIN WATERWORKS
AVNET CABLE TECHNOLOGIES (1 INDUSTRIAL PK RD in FLIPPIN, AR)
Conditionally Exempt Small Quantity Generators, less than 100 kg/month of hazardous waste (Resource Conservation and Recovery Act (tracking hazardous waste)) - notification Organizations: AVNET INC (CONTACT/OWNER)
Housing units lacking complete plumbing facilities: 8.5% Housing units lacking complete kitchen facilities: 6.9%
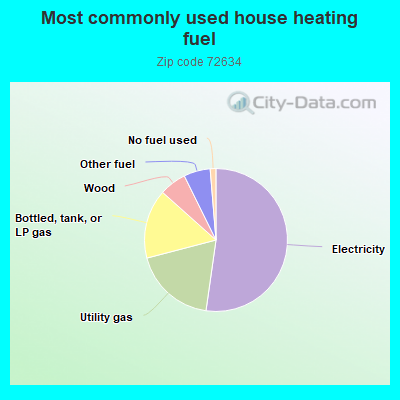
52.3%Electricity
18.7%Utility gas
15.7%Bottled, tank, or LP gas
6.1%Wood
6.0%Other fuel
1.3%No fuel used
Population in 1990: 2,784. Population change in the 1990s: +1,550 (+55.7%).
Place of birth for U.S.-born residents:
This state: 1,940
Northeast: 187
Midwest: 1,188
South: 698
West: 513
50% of the 72634 zip code residents lived in the same house 5 years ago. Out of people who lived in different houses, 42% lived in this county. Out of people who lived in different counties, 50% lived in Arkansas.
90% of the 72634 zip code residents lived in the same house 1 year ago. Out of people who lived in different houses, 32% moved from this county. Out of people who lived in different houses, 48% moved from different county within same state. Out of people who lived in different houses, 24% moved from different state.
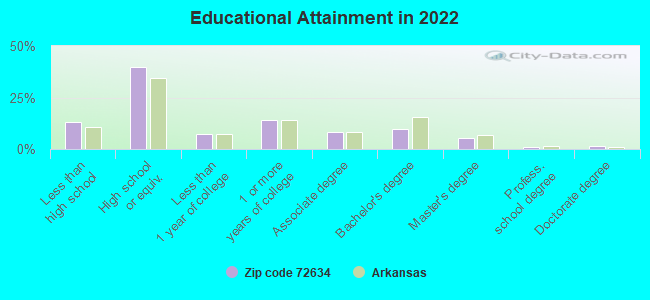
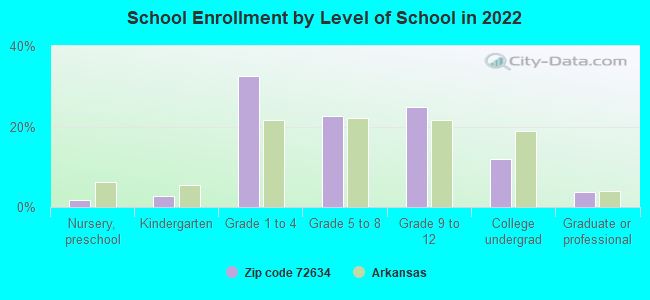
Private vs. public school enrollment:
Students in private schools in grades 1 to 8 (elementary and middle school): 23
Here:
5.3%
Arkansas:
10.5%
Students in private schools in grades 9 to 12 (high school):
Here:
0.0%
Arkansas:
8.7%
Students in private undergraduate colleges:
Here:
0.0%
Arkansas:
19.4%
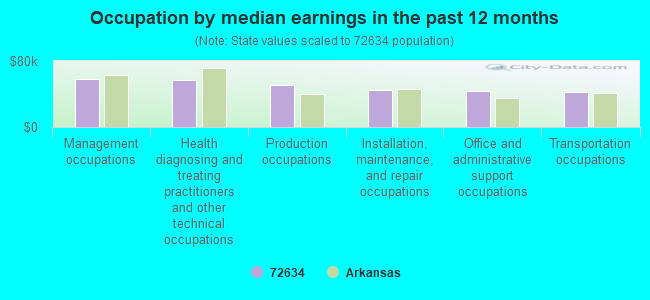
Occupation by median earnings in the past 12 months ($)
58,317Management occupations
56,981Health diagnosing and treating practitioners and other technical occupations
50,514Production occupations
45,136Installation, maintenance, and repair occupations
43,918Office and administrative support occupations
42,063Transportation occupations
Companies with federal contracts located in this zip code:
MEDLEY, KEN (180 MEDLEY LN in FLIPPIN, AR; small business) : $77,300 in 12 contractsfrom 2002 to 2006
Contracts for Landscaping/Groundskeeping Services by U.S. Army Corps of Engineers - civil program financing only, Army Signed by year:2000: $0; 2001: $0; 2002: -$4,055; 2003: $15,068; 2004: $25,008; 2005: $27,496; 2006: $13,783.
Biggest contracts:
$15,068 with U.S. Army Corps of Engineers - civil program financing only for Landscaping/Groundskeeping Services. Signed on 2003-03-17. Completion date: 2002-09-30.
$14,553, same as above.Signed on 2004-03-31. Completion date: 2004-09-30.
$14,553 with Army for Landscaping/Groundskeeping Services. Signed on 2004-03-31. Completion date: 2004-09-30.
$14,399, same as above.Signed on 2005-03-03. Completion date: 2004-09-30.
WOOD MANUFACTURING COMPANY, IN (96 RANGER RD in FLIPPIN, AR; small business)
$24,980 with Army for Small Craft. Signed on 2006-06-20. Completion date: 2006-08-18.
Top industries in this zip code by the number of employees in 2005:
Health Care and Social Assistance: Nursing Care Facilities (50-99 employees: 1 establishment)
Administrative and Support and Waste Management and Remediation Services: Temporary Help Services (50-99: 1)
67 people in nursing facilities/skilled-nursing facilities
Fatal accident statistics in 2011:
Fatal accident count: 1
Vehicles involved in fatal accidents: 2
Fatal accidents caused by drunken drivers: 0
Fatalities: 2
Persons involved in fatal accidents: 2
Pedestrians involved in fatal accidents: 0
2002 - 2018 National Fire Incident Reporting System (NFIRS) incidents
Based on the data from the years 2002 - 2018 the average number of fire incidents per year is 68. The highest number of reported fires - 102 took place in 2004, and the least - 17 in 2002. The data has a rising trend.
When looking into fire subcategories, the most reports belonged to: Structure Fires (46.8%), and Outside Fires (42.3%).
Fire incident types reported to NFIRS in Zip Code 72634


 Nearest zip codes: 72635, 72626, 72642, 72639, 72677, 72619.


 Based on the data from the years 2002 - 2018 the average number of fire incidents per year is 68. The highest number of reported fires - 102 took place in 2004, and the least - 17 in 2002. The data has a rising trend.
 When looking into fire subcategories, the most reports belonged to: Structure Fires (46.8%), and Outside Fires (42.3%).