Estimated zip code population in 2022: 39,289 Zip code population in 2010: 22,406 Zip code population in 2000: 10,250
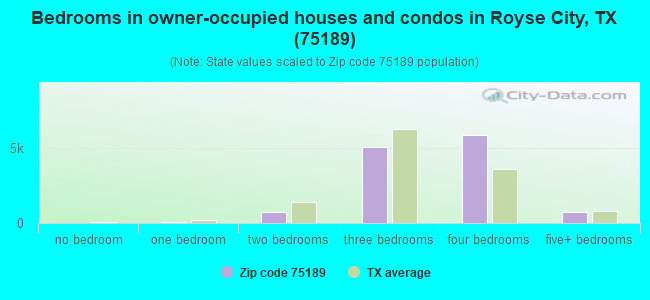
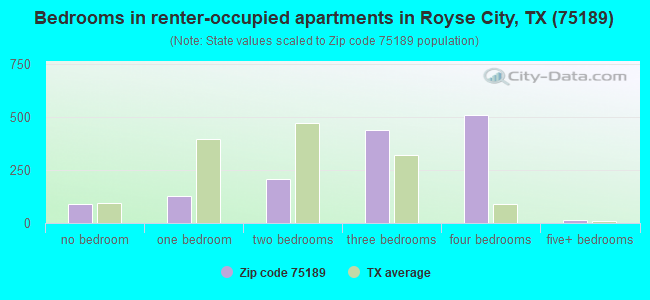
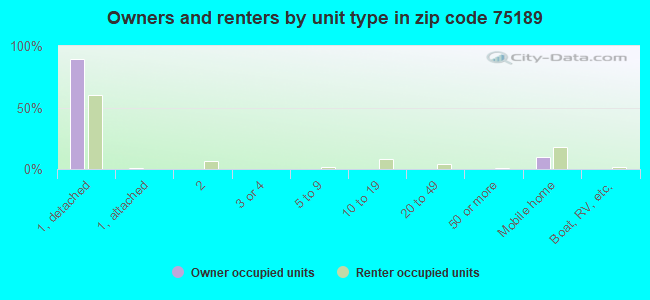
Houses and condos: 14,008 Renter-occupied apartments: 1,369
% of renters here:
10%
State:
38%
March 2022 cost of living index in zip code 75189: 87.0 (less than average, U.S. average is 100)
Land area: 111.0 sq. mi. Water area: 1.0 sq. mi.
Population density: 354 people per square mile
(very low).
OSM Map
General Map
Google Map
MSN Map
OSM Map
General Map
Google Map
MSN Map
OSM Map
General Map
Google Map
MSN Map
OSM Map
General Map
Google Map
MSN Map
Please wait while loading the map...
Real estate property taxes paid for housing units in 2022:
This zip code:
1.6% ($5,956)
Texas:
1.5% ($4,050)
Median real estate property taxes paid for housing units with mortgages in 2022: $6,450 (1.7%) Median real estate property taxes paid for housing units with no mortgage in 2022: $4,114 (1.4%)
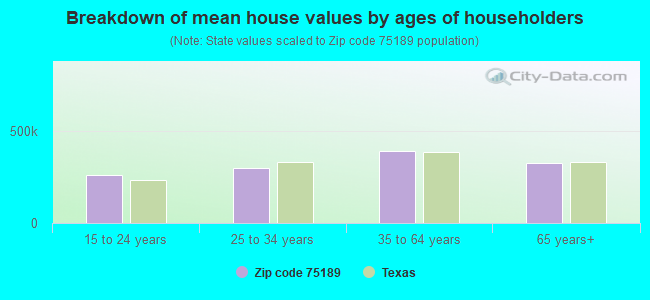
Estimated median house/condo value in 2022: $363,690
75189:
$363,690
Texas:
$275,400
According to our research of Texas and other state lists, there were 66 registered sex offenders living in 75189 zip code as of April 25, 2024. The ratio of all residents to sex offenders in zip code 75189 is 379 to 1. The ratio of registered sex offenders to all residents in this zip code is near the state average.
Median resident age:
This zip code:
35.8 years
Texas median age:
35.6 years
Average household size:
This zip code:
2.9 people
Texas:
2.6 people
Averages for the 2020 tax year for zip code 75189, filed in 2021:
Average Adjusted Gross Income (AGI) in 2020: $72,269 (Individual Income Tax Returns)
Here:
$72,269
State:
$77,054
Salary/wage: $66,550 (reported on 87.1% of returns)
Here:
$66,550
State:
$62,766
(% of AGI for various income ranges: 1210.4% for AGIs below $25k, 3723.7% for AGIs $25k-50k, 6658.9% for AGIs $50k-75k, 9848.7% for AGIs $75k-100k, 17465.3% for AGIs $100k-200k, 51106.6% for AGIs over 200k)
Taxable interest for individuals: $1,316 (reported on 17.3% of returns)
This zip code:
$1,316
Texas:
$2,665
(% of AGI for various income ranges: 7.2% for AGIs below $25k, 12.4% for AGIs $25k-50k, 11.7% for AGIs $50k-75k, 19.8% for AGIs $75k-100k, 34.7% for AGIs $100k-200k, 714.1% for AGIs over 200k)
Ordinary dividends: $2,601 (reported on 11.0% of returns)
Here:
$2,601
State:
$10,044
(% of AGI for various income ranges: 11.8% for AGIs below $25k, 14.7% for AGIs $25k-50k, 19.3% for AGIs $50k-75k, 30.4% for AGIs $75k-100k, 72.3% for AGIs $100k-200k, 561.4% for AGIs over 200k)
Net capital gain/loss in AGI: +$13,103 (reported on 11.1% of returns)
Here:
+$13,103
State:
+$39,590
(% of AGI for various income ranges: 0.4% for AGIs below $25k, 20.7% for AGIs $25k-50k, 28.3% for AGIs $50k-75k, 73.2% for AGIs $75k-100k, 175.2% for AGIs $100k-200k, 6964.5% for AGIs over 200k)
Profit/loss from business: +$9,698 (reported on 22.3% of returns)
Here:
+$9,698
State:
+$10,888
(% of AGI for various income ranges: 158.6% for AGIs below $25k, 220.1% for AGIs $25k-50k, 232.2% for AGIs $50k-75k, 231.6% for AGIs $75k-100k, 355.8% for AGIs $100k-200k, 2982.4% for AGIs over 200k)
Taxable individual retirement arrangement distribution: $19,123 (reported on 5.2% of returns)
75189:
$19,123
Texas:
$24,740
(% of AGI for various income ranges: 28.4% for AGIs below $25k, 61.5% for AGIs $25k-50k, 107.6% for AGIs $50k-75k, 157.8% for AGIs $75k-100k, 299.3% for AGIs $100k-200k, 900.3% for AGIs over 200k)
Self-employed (Keogh) retirement plans: $21,433 (reported on 0.2% of returns)
75189:
$21,433
Texas:
$29,298
(% of AGI for various income ranges: 26.7% for AGIs $100k-200k)
Total itemized deductions: $33,569 (reported on 9.5% of returns)
Here:
$33,569
State:
$40,428
(% of AGI for various income ranges: 38.5% for AGIs below $25k, 144.7% for AGIs $25k-50k, 339.4% for AGIs $50k-75k, 464.0% for AGIs $75k-100k, 770.7% for AGIs $100k-200k, 6100.0% for AGIs over 200k)
Charity contributions: $10,604 (reported on 7.2% of returns)
Here:
$10,604
State:
$18,201
(% of AGI for various income ranges: 4.5% for AGIs below $25k, 19.8% for AGIs $25k-50k, 53.1% for AGIs $50k-75k, 95.3% for AGIs $75k-100k, 231.2% for AGIs $100k-200k, 1622.1% for AGIs over 200k)
Taxes paid: $7,544 (reported on 9.2% of returns)
75189:
$7,544
State:
$7,821
(% of AGI for various income ranges: 9.0% for AGIs below $25k, 32.4% for AGIs $25k-50k, 91.3% for AGIs $50k-75k, 121.1% for AGIs $75k-100k, 193.2% for AGIs $100k-200k, 840.0% for AGIs over 200k)
Earned income credit: $2,532 (reported on 14.1% of returns)
Here:
$2,532
State:
$2,584
(% of AGI for various income ranges: 101.1% for AGIs below $25k, 86.8% for AGIs $25k-50k, 1.3% for AGIs $50k-75k)
Percentage of individuals using paid preparers for their 2020 taxes: 93.3%
Here:
93%
State:
92%
(% for various income ranges: 90.5% for AGIs below $25k, 93.1% for AGIs $25k-50k, 94.5% for AGIs $50k-75k, 94.5% for AGIs $75k-100k, 95.3% for AGIs $100k-200k, 94.4% for AGIs over 200k)
Averages for the 2012 tax year for zip code 75189, filed in 2013:
Average Adjusted Gross Income (AGI) in 2012: $56,625 (Individual Income Tax Returns)
Here:
$56,625
State:
$65,384
Salary/wage: $52,696 (reported on 88.2% of returns)
Here:
$52,696
State:
$52,524
(% of AGI for various income ranges: 78.2% for AGIs below $25k, 86.2% for AGIs $25k-50k, 85.3% for AGIs $50k-75k, 88.1% for AGIs $75k-100k, 85.9% for AGIs $100k-200k, 54.9% for AGIs over 200k)
Taxable interest for individuals: $993 (reported on 20.2% of returns)
This zip code:
$993
Texas:
$2,372
(% of AGI for various income ranges: 0.7% for AGIs below $25k, 0.3% for AGIs $25k-50k, 0.2% for AGIs $50k-75k, 0.2% for AGIs $75k-100k, 0.3% for AGIs $100k-200k, 0.8% for AGIs over 200k)
Ordinary dividends: $2,095 (reported on 11.3% of returns)
Here:
$2,095
State:
$9,721
(% of AGI for various income ranges: 0.9% for AGIs below $25k, 0.4% for AGIs $25k-50k, 0.6% for AGIs $50k-75k, 0.2% for AGIs $75k-100k, 0.3% for AGIs $100k-200k, 0.5% for AGIs over 200k)
Net capital gain/loss in AGI: +$3,318 (reported on 8.5% of returns)
Here:
+$3,318
State:
+$35,319
(% of AGI for various income ranges: 0.3% for AGIs $50k-75k, 0.3% for AGIs $75k-100k, 0.4% for AGIs $100k-200k, 2.2% for AGIs over 200k)
Profit/loss from business: +$9,388 (reported on 20.7% of returns)
Here:
+$9,388
State:
+$13,732
(% of AGI for various income ranges: 12.3% for AGIs below $25k, 4.5% for AGIs $25k-50k, 3.1% for AGIs $50k-75k, 2.0% for AGIs $75k-100k, 2.2% for AGIs $100k-200k, 2.3% for AGIs over 200k)
Taxable individual retirement arrangement distribution: $18,149 (reported on 6.0% of returns)
75189:
$18,149
Texas:
$19,511
(% of AGI for various income ranges: 2.0% for AGIs below $25k, 1.4% for AGIs $25k-50k, 1.6% for AGIs $50k-75k, 1.5% for AGIs $75k-100k, 2.0% for AGIs $100k-200k, 3.4% for AGIs over 200k)
Self-employment retirement plans: $23,150 (reported on 0.2% of returns)
75189:
$23,150
Texas:
$23,938
Total itemized deductions: $20,056 (21% of AGI, reported on 33.6% of returns)
Here:
$20,056
State:
$24,724
Here:
21.1% of AGI
State:
15.9% of AGI
(% of AGI for various income ranges: 8.1% for AGIs below $25k, 11.9% for AGIs $25k-50k, 12.3% for AGIs $50k-75k, 12.7% for AGIs $75k-100k, 13.2% for AGIs $100k-200k, 9.1% for AGIs over 200k)
Charity contributions: $3,785 (reported on 24.5% of returns)
Here:
$3,785
State:
$6,808
(% of AGI for various income ranges: 0.6% for AGIs below $25k, 1.0% for AGIs $25k-50k, 1.6% for AGIs $50k-75k, 1.5% for AGIs $75k-100k, 2.1% for AGIs $100k-200k, 2.0% for AGIs over 200k)
Taxes paid: $5,598 (reported on 33.1% of returns)
75189:
$5,598
State:
$6,921
(% of AGI for various income ranges: 2.0% for AGIs below $25k, 2.8% for AGIs $25k-50k, 3.0% for AGIs $50k-75k, 3.8% for AGIs $75k-100k, 4.0% for AGIs $100k-200k, 2.3% for AGIs over 200k)
Earned income credit: $2,431 (reported on 18.3% of returns)
Here:
$2,431
State:
$2,570
(% of AGI for various income ranges: 7.7% for AGIs below $25k, 1.5% for AGIs $25k-50k)
Percentage of individuals using paid preparers for their 2012 taxes: 48.3%
Here:
48%
State:
51%
(% for various income ranges: 46.5% for AGIs below $25k, 48.5% for AGIs $25k-50k, 49.4% for AGIs $50k-75k, 44.6% for AGIs $75k-100k, 51.2% for AGIs $100k-200k, 72.2% for AGIs over 200k)
Averages for the 2004 tax year for zip code 75189, filed in 2005:
Average Adjusted Gross Income (AGI) in 2004: $43,482 (Individual Income Tax Returns)
Here:
$43,482
State:
$47,881
Salary/wage: $43,273 (reported on 88.0% of returns)
Here:
$43,273
State:
$41,947
(% of AGI for various income ranges: 183.0% for AGIs below $10k, 81.8% for AGIs $10k-25k, 89.4% for AGIs $25k-50k, 89.9% for AGIs $50k-75k, 91.6% for AGIs $75k-100k, 78.5% for AGIs over 100k)
Taxable interest for individuals: $1,393 (reported on 28.2% of returns)
This zip code:
$1,393
Texas:
$2,255
(% of AGI for various income ranges: 11.1% for AGIs below $10k, 1.4% for AGIs $10k-25k, 0.6% for AGIs $25k-50k, 0.6% for AGIs $50k-75k, 0.5% for AGIs $75k-100k, 1.2% for AGIs over 100k)
Taxable dividends: $863 (reported on 11.4% of returns)
Here:
$863
State:
$4,261
(% of AGI for various income ranges: 1.4% for AGIs below $10k, 0.4% for AGIs $10k-25k, 0.2% for AGIs $25k-50k, 0.1% for AGIs $50k-75k, 0.2% for AGIs $75k-100k, 0.2% for AGIs over 100k)
Net capital gain/loss: +$8,842 (reported on 10.5% of returns)
Here:
+$8,842
State:
+$16,110
(% of AGI for various income ranges: 9.8% for AGIs below $10k, 0.2% for AGIs $10k-25k, 0.2% for AGIs $25k-50k, 0.6% for AGIs $50k-75k, 0.9% for AGIs $75k-100k, 6.9% for AGIs over 100k)
Profit/loss from business: +$6,914 (reported on 21.6% of returns)
Here:
+$6,914
State:
+$11,013
(% of AGI for various income ranges: 17.6% for AGIs below $10k, 9.0% for AGIs $10k-25k, 2.6% for AGIs $25k-50k, 2.2% for AGIs $50k-75k, 2.0% for AGIs $75k-100k, 4.1% for AGIs over 100k)
IRA payment deduction: $2,588 (reported on 1.7% of returns)
75189:
$2,588
Texas:
$3,120
(% of AGI for various income ranges: 0.1% for AGIs $10k-25k, 0.1% for AGIs $25k-50k, 0.1% for AGIs $50k-75k, 0.1% for AGIs $75k-100k, 0.1% for AGIs over 100k)
Self-employed pension: $10,933 (reported on 0.2% of returns)
Here:
$10,933
Texas:
$16,401
Total itemized deductions: $16,428 (23% of AGI, reported on 35.0% of returns)
Here:
$16,428
State:
$19,631
Here:
23.2% of AGI
State:
18.9% of AGI
(% of AGI for various income ranges: 23.1% for AGIs below $10k, 8.5% for AGIs $10k-25k, 12.1% for AGIs $25k-50k, 13.9% for AGIs $50k-75k, 16.0% for AGIs $75k-100k, 12.5% for AGIs over 100k)
Charity contributions deductions: $2,842 (4% of AGI, reported on 26.3% of returns)
Here:
$2,842
State:
$4,753
Here:
3.8% of AGI
State:
4.2% of AGI
(% of AGI for various income ranges: 1.7% for AGIs below $10k, 0.8% for AGIs $10k-25k, 1.3% for AGIs $25k-50k, 1.6% for AGIs $50k-75k, 2.3% for AGIs $75k-100k, 2.1% for AGIs over 100k)
Total tax: $5,472 (reported on 75.6% of returns)
75189:
$5,472
State:
$9,058
(% of AGI for various income ranges: 9.1% for AGIs below $10k, 4.4% for AGIs $10k-25k, 5.8% for AGIs $25k-50k, 8.1% for AGIs $50k-75k, 9.7% for AGIs $75k-100k, 16.1% for AGIs over 100k)
Earned income credit: $1,872 (reported on 17.1% of returns)
Here:
$1,872
State:
$2,024
Percentage of individuals using paid preparers for their 2004 taxes: 57.3%
Here:
57%
State:
57%
(% for various income ranges: 50.0% for AGIs below $10k, 61.1% for AGIs $10k-25k, 59.9% for AGIs $25k-50k, 56.2% for AGIs $50k-75k, 54.0% for AGIs $75k-100k, 60.5% for AGIs over 100k)
Likely homosexual households (counted as self-reported same-sex unmarried-partner households)
Lesbian couples: 0.0% of all households
Gay men: 0.1% of all households
Household received Food Stamps/SNAP in the past 12 months: 665 Household did not receive Food Stamps/SNAP in the past 12 months: 12,942
Women who had a birth in the past 12 months: 870 (865 now married, 20 unmarried) Women who did not have a birth in the past 12 months: 9,440 (5,036 now married, 4,375 unmarried)
Housing units in zip code 75189 with a mortgage: 9,208 (155 second mortgage, 137 both second mortgage and home equity loan) Houses without a mortgage: 80
Median monthly owner costs for units with a mortgage: $2,112 Median monthly owner costs for units without a mortgage: $722
Residents with income below the poverty level in 2022:
This zip code:
5.1%
Whole state:
14.0%
Residents with income below 50% of the poverty level in 2022:
This zip code:
2.0%
Whole state:
7.4%
Median number of rooms in houses and condos:
Here:
6.8
State:
6.3
Median number of rooms in apartments:
Here:
5.1
State:
4.0
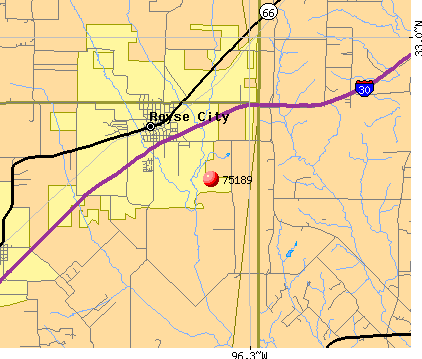
Notable locations in this zip code not listed on our city pages
Notable locations in zip code 75189: Burrow (A), Zollner Ranch (B), Union Valley Volunteer Fire Department (C), Royse City Fire Department (D), McLendon - Chisholm Volunteer Fire Department Station 2 (E), Royse City Lodge Number 663 (F). Display/hide their locations on the map
Cemeteries: Blackland Cemetery (1), Needmore Cemetery (2), Graham Point Cemetery (3), Pleasant Hill Cemetery (4), Josephine Cemetery (5). Display/hide their locations on the map
Reservoirs: Boyd Lake (A), Moores Lake (B), Soil Conservation Service Site 2 Reservoir (C), Soil Conservation Service Site 1b Reservoir (D), Soil Conservation Service Site 1a Reservoir (E), Soil Conservation Service Site 11 Reservoir (F), Soil Conservation Service Site 13 Reservoir (G). Display/hide their locations on the map
Streams, rivers, and creeks: Bois d'Arc Creek (A), Tar Branch (B), Renfro Creek (C), Payne Creek (D), Parker Creek (E), Dry Creek (F), Sabine Creek (G), Klutts Branch (H), Pond Branch (I). Display/hide their locations on the map
In group quarters: 21 (-1 institutionalized population)
Size of family households: 4,106 2-persons, 2,227 3-persons, 2,444 4-persons, 1,540 5-persons, 227 6-persons, 294 7-or-more-persons
Size of nonfamily households: 1,857 1-person, 885 2-persons
7,684 married couples with children.
1,575 single-parent households (242 men, 1,333 women).
81.8% of residents of 75189 zip code speak English at home.
14.8% of residents speak Spanish at home (67% very well, 22% well, 9% not well, 3% not at all).
0.7% of residents speak other Indo-European language at home (80% very well, 20% well).
1.3% of residents speak Asian or Pacific Island language at home (70% very well, 30% well).
1.1% of residents speak other language at home (63% very well, 37% well).
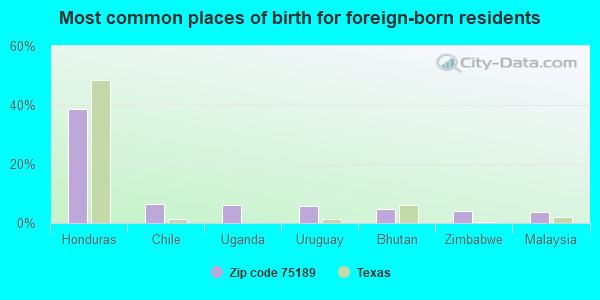
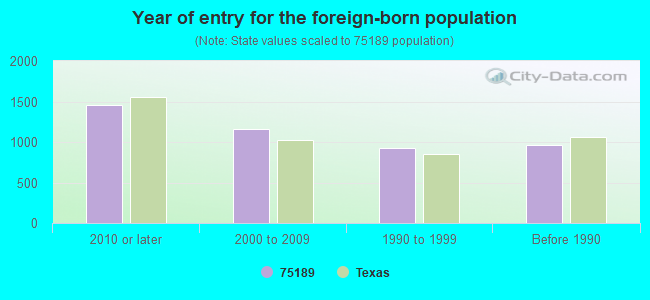
Foreign born population: 3,936 (10.0%) (54.7% of them are naturalized citizens)
This zip code:
10.0%
Whole state:
17.2%
39%Honduras
7%Chile
6%Uganda
6%Uruguay
5%Bhutan
4%Zimbabwe
4%Malaysia
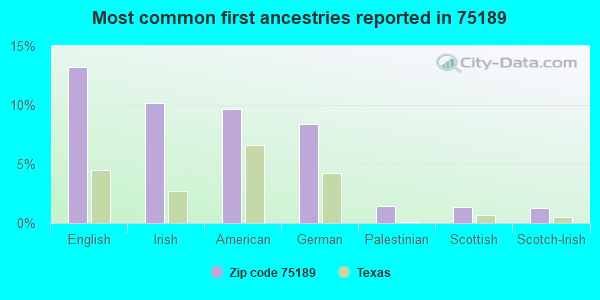
13%English
10%Irish
10%American
8%German
1%Palestinian
1%Scottish
1%Scotch-Irish
Year of entry for the foreign-born population
1,4552010 or later
1,1552000 to 2009
9261990 to 1999
962Before 1990
Facilities with environmental interests located in this zip code:
ANITA SCOTT ELEMENTARY (115 E I-30 in ROYSE CITY, TX)
(National Center for Education Statistics) - STATE ID-199902104 Organizations: ROYSE CITY ISD (SCHOOL DISTRICT)
Housing units lacking complete plumbing facilities: 1.2% Housing units lacking complete kitchen facilities: 2.6%
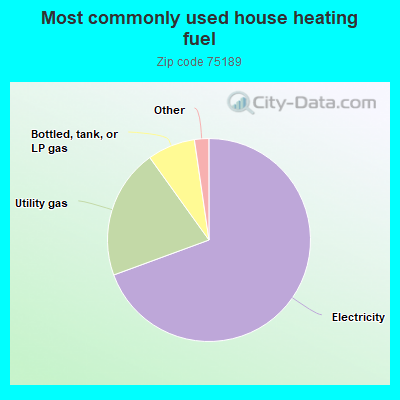
69.4%Electricity
20.7%Utility gas
7.6%Bottled, tank, or LP gas
0.7%Other fuel
0.7%No fuel used
0.5%Wood
Population in 1990: 5,533. Population change in the 1990s: +4,717 (+85.3%).
Place of birth for U.S.-born residents:
This state: 24,097
Northeast: 846
Midwest: 3,357
South: 3,500
West: 2,962
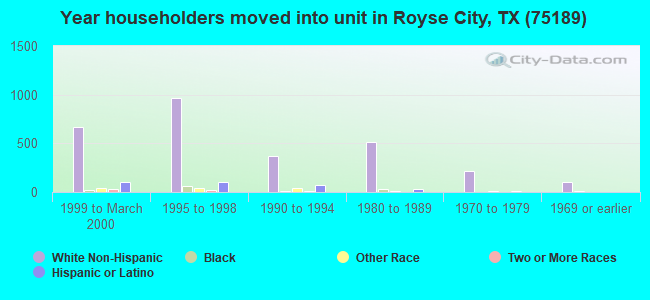
49% of the 75189 zip code residents lived in the same house 5 years ago. Out of people who lived in different houses, 29% lived in this county. Out of people who lived in different counties, 50% lived in Texas.
85% of the 75189 zip code residents lived in the same house 1 year ago. Out of people who lived in different houses, 17% moved from this county. Out of people who lived in different houses, 73% moved from different county within same state. Out of people who lived in different houses, 10% moved from different state. Out of people who lived in different houses, 4% moved from abroad.
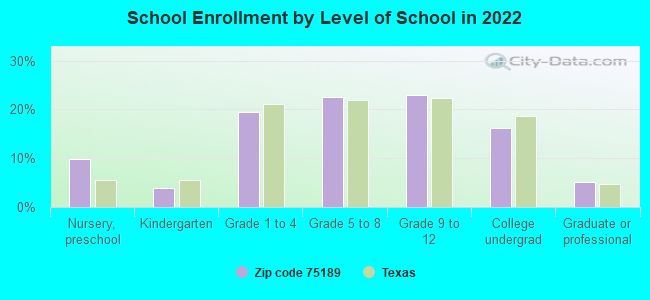
Private vs. public school enrollment:
Students in private schools in grades 1 to 8 (elementary and middle school): 502
Here:
11.3%
Texas:
8.8%
Students in private schools in grades 9 to 12 (high school): 80
Here:
3.3%
Texas:
8.0%
Students in private undergraduate colleges: 203
Here:
11.9%
Texas:
16.2%
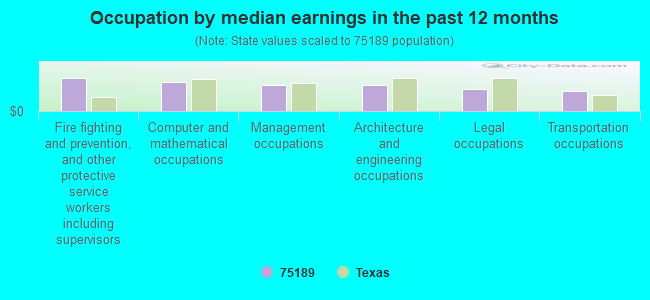
Occupation by median earnings in the past 12 months ($)
114,495Fire fighting and prevention, and other protective service workers including supervisors
100,602Computer and mathematical occupations
93,025Management occupations
90,419Architecture and engineering occupations
76,530Legal occupations
71,879Transportation occupations
Companies with federal contracts located in this zip code (ROYSE CITY, TX):
YRC INC (18475 F M 2755; small business) : $395,206 in 51 contractsfrom 1999 to 2005
Contracts for Maintenance, Repair or Alteration of Real Property -- Recreation Facilities (Non-Building), Maintenance, Repair or Alteration of Real Property -- Other Conservation and Development Facilities, Maintenance, Repair or Alteration of Real Property -- Miscellaneous Buildings, Maintenance, Repair or Alteration of Real Property -- Other Non-Building Facilities by U.S. Army Corps of Engineers - civil program financing only, Army Signed by year:2000: $80,212; 2001: $36,968; 2002: $58,061; 2003: $71,948; 2004: $34,991; 2005: $54,973; 2006: $0.
Biggest contracts:
$27,972 with U.S. Army Corps of Engineers - civil program financing only for Maintenance, Repair or Alteration of Real Property -- Recreation Facilities (Non-Building). Signed on 1999-11-30. Completion date: 2000-01-08.
$25,897 with Army for Maintenance, Repair or Alteration of Real Property -- Other Conservation and Development Facilities. Signed on 2004-04-06. Completion date: 2006-04-05.
$24,889 with U.S. Army Corps of Engineers - civil program financing only for Maintenance, Repair or Alteration of Real Property -- Other Conservation and Development Facilities. Signed on 2003-08-19. Completion date: 2003-12-04.
$24,361, same as above.Signed on 2002-05-13. Completion date: 2002-07-15.
HOIST PARTS INC (1515 E INTERSTATE 30; small business) : $60,931 in 2 contractsfrom 2005 to 2006
$37,446 with Army for Maintenance, Repair and Rebuilding of Equipment -- Materials Handling Equipment. Signed on 2006-01-26. Completion date: 2006-02-28.
$23,485 with Army for Maintenance, Repair and Rebuilding of Equipment -- Construction, Mining, Excavating, and Highway Maintenance Equipment. Signed on 2005-10-11. Completion date: 2005-11-10.
M.W.MYERS SERVICE (5046 DURAN; small business)
$57,000 with Army for Construction of Structures and Facilities -- Miscellaneous Buildings. Signed on 2000-02-03. Completion date: 2000-03-20.
I-CON (9873 COUNTY ROAD 2469; small business)
$16,088 with Army for Other Research and Development -- Applied Research and Exploratory Development (R&D). Signed on 2001-11-23. Completion date: 2002-05-25.
K AND K CORP (1303 INDUSTRIAL DR; small business) : $12,442 in 6 contractsin 2006
Contracts for Chemicals, Individual Equipment by Department of Veterans Affairs Signed by year:2000: $0; 2001: $0; 2002: $0; 2003: $0; 2004: $0; 2005: $0; 2006: $12,442.
Biggest contracts:
$2,436 with Department of Veterans Affairs for Chemicals. Signed on 2006-05-18. Completion date: 2006-05-18.
$2,383, same as above.Signed on 2006-07-20. Completion date: 2006-07-30.
$2,383, same as above.Signed on 2006-06-22. Completion date: 2006-07-02.
$2,383 with Department of Veterans Affairs for Chemicals. Taking place in WV. Signed on 2006-08-24. Completion date: 2006-09-03.
HAGGARD, HEATHER M (6959 FM 1565; small business)
$4,500 with Air Force for Live Animals, Not Raised for Food. Signed on 2006-05-22. Completion date: 2006-04-30.
3P GROUP, INC (6068 I 30 W; small business)
$4,310 with Department of Defense for ADP Support Equipment. Signed on 2005-01-20. Completion date: 2005-01-30.
Top industries in this zip code by the number of employees in 2005:
2003 - 2018 National Fire Incident Reporting System (NFIRS) incidents
According to the data from the years 2003 - 2018 the average number of fires per year is 102. The highest number of fires - 205 took place in 2011, and the least - 10 in 2003. The data has a growing trend.
When looking into fire subcategories, the most reports belonged to: Outside Fires (66.1%), and Structure Fires (22.9%).
Fire incident types reported to NFIRS in Zip Code 75189

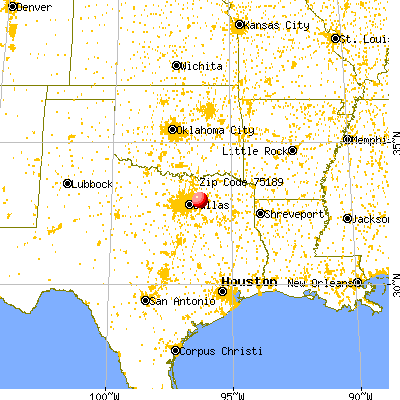


 Nearest zip codes: 75132, 75164, 75087, 75173, 75032, 75135.


 According to the data from the years 2003 - 2018 the average number of fires per year is 102. The highest number of fires - 205 took place in 2011, and the least - 10 in 2003. The data has a growing trend.
 When looking into fire subcategories, the most reports belonged to: Outside Fires (66.1%), and Structure Fires (22.9%).