Estimated zip code population in 2022: 2,411 Zip code population in 2010: 2,168 Zip code population in 2000: 1,756
Houses and condos: 982 Renter-occupied apartments: 212
% of renters here:
31%
State:
38%
March 2022 cost of living index in zip code 75705: 81.7 (low, U.S. average is 100)
Land area: 27.7 sq. mi. Water area: 0.2 sq. mi.
Population density: 87 people per square mile
(very low).
OSM Map
General Map
Google Map
MSN Map
OSM Map
General Map
Google Map
MSN Map
OSM Map
General Map
Google Map
MSN Map
OSM Map
General Map
Google Map
MSN Map
Please wait while loading the map...
Real estate property taxes paid for housing units in 2022:
This zip code:
0.6% ($1,175)
Texas:
1.5% ($4,050)
Median real estate property taxes paid for housing units with mortgages in 2022: $1,268 (0.4%) Median real estate property taxes paid for housing units with no mortgage in 2022: $924 (1.0%)
Business Search- 14 Million verified businesses
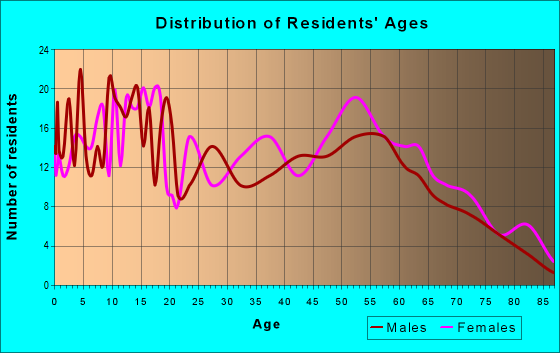
Males: 1,440
(59.7%)
Females: 971
(40.3%)
For population 25 years and over in 75705:
High school or higher: 88.4%
Bachelor's degree or higher: 14.4%
Graduate or professional degree: 4.1%
Unemployed: 9.5%
Mean travel time to work (commute): 20.8 minutes
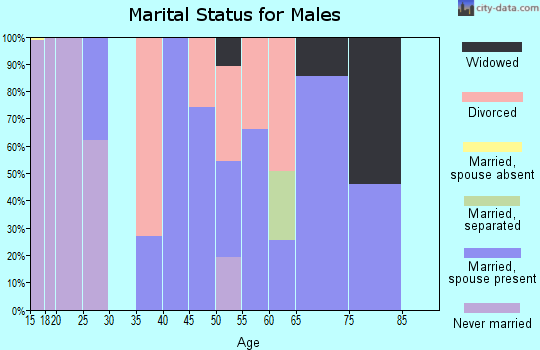
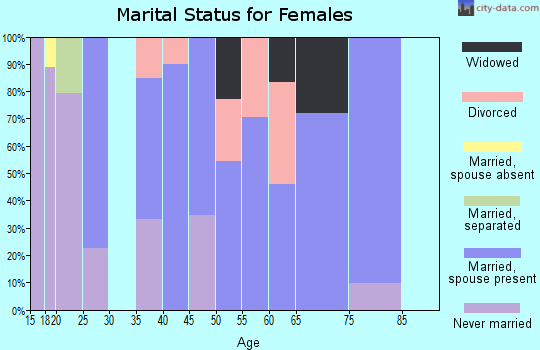
For population 15 years and over in 75705:
Never married: 32.8%
Now married: 51.1%
Separated: 0.9%
Widowed: 4.2%
Divorced: 11.0%
Zip code 75705 compared to state average:
Unemployed percentage above state average.
Black race population percentage significantly above state average.
Hispanic race population percentage significantly below state average.
Median age above state average.
Length of stay since moving in significantly above state average.
Number of college students significantly below state average.
Percentage of population with a bachelor's degree or higher below state average.
Averages for the 2020 tax year for zip code 75705, filed in 2021:
Average Adjusted Gross Income (AGI) in 2020: $40,439 (Individual Income Tax Returns)
Here:
$40,439
State:
$77,054
Salary/wage: $38,720 (reported on 82.2% of returns)
Here:
$38,720
State:
$62,766
(% of AGI for various income ranges: 1359.4% for AGIs below $25k, 3490.0% for AGIs $25k-50k, 7236.4% for AGIs $50k-75k, 9237.5% for AGIs $75k-100k, 16902.0% for AGIs $100k-200k)
Taxable interest for individuals: $307 (reported on 13.1% of returns)
This zip code:
$307
Texas:
$2,665
(% of AGI for various income ranges: 0.8% for AGIs below $25k, 4.2% for AGIs $25k-50k, 7.3% for AGIs $50k-75k, 42.0% for AGIs $100k-200k)
Ordinary dividends: $650 (reported on 3.7% of returns)
Here:
$650
State:
$10,044
(% of AGI for various income ranges: 2.8% for AGIs below $25k, 14.5% for AGIs $50k-75k)
Net capital gain/loss in AGI: +$3,440 (reported on 4.7% of returns)
Here:
+$3,440
State:
+$39,590
(% of AGI for various income ranges: 1.9% for AGIs $25k-50k, 334.0% for AGIs $100k-200k)
Profit/loss from business: +$3,754 (reported on 22.4% of returns)
Here:
+$3,754
State:
+$10,888
(% of AGI for various income ranges: 97.8% for AGIs below $25k, 94.2% for AGIs $25k-50k, 910.0% for AGIs $75k-100k)
Taxable individual retirement arrangement distribution: $15,800 (reported on 4.7% of returns)
75705:
$15,800
Texas:
$24,740
(% of AGI for various income ranges: 718.2% for AGIs $50k-75k)
Total itemized deductions: $34,240 (reported on 4.7% of returns)
Here:
$34,240
State:
$40,428
(% of AGI for various income ranges: 1556.4% for AGIs $50k-75k)
Charity contributions: $12,000 (reported on 2.8% of returns)
Here:
$12,000
State:
$18,201
(% of AGI for various income ranges: 138.5% for AGIs $25k-50k)
Taxes paid: $4,275 (reported on 3.7% of returns)
75705:
$4,275
State:
$7,821
(% of AGI for various income ranges: 155.5% for AGIs $50k-75k)
Earned income credit: $2,810 (reported on 28.0% of returns)
Here:
$2,810
State:
$2,584
(% of AGI for various income ranges: 162.5% for AGIs below $25k, 99.2% for AGIs $25k-50k)
Percentage of individuals using paid preparers for their 2020 taxes: 94.4%
Here:
94%
State:
92%
(% for various income ranges: 93.6% for AGIs below $25k, 93.8% for AGIs $25k-50k, 93.3% for AGIs $50k-75k, 100.0% for AGIs $75k-100k, 100.0% for AGIs $100k-200k)
Averages for the 2012 tax year for zip code 75705, filed in 2013:
Average Adjusted Gross Income (AGI) in 2012: $35,030 (Individual Income Tax Returns)
Here:
$35,030
State:
$65,384
Salary/wage: $32,805 (reported on 86.0% of returns)
Here:
$32,805
State:
$52,524
(% of AGI for various income ranges: 81.7% for AGIs below $25k, 80.9% for AGIs $25k-50k, 81.2% for AGIs $50k-75k, 87.1% for AGIs $75k-100k, 72.3% for AGIs $100k-200k)
Taxable interest for individuals: $321 (reported on 15.1% of returns)
This zip code:
$321
Texas:
$2,372
(% of AGI for various income ranges: 0.3% for AGIs below $25k, 0.1% for AGIs $25k-50k, 0.1% for AGIs $50k-75k, 0.1% for AGIs $100k-200k)
Ordinary dividends: $500 (reported on 4.3% of returns)
Here:
$500
State:
$9,721
Net capital gain/loss in AGI: +$850 (reported on 2.2% of returns)
Here:
+$850
State:
+$35,319
Profit/loss from business: +$5,727 (reported on 16.1% of returns)
Here:
+$5,727
State:
+$13,732
(% of AGI for various income ranges: 2.1% for AGIs below $25k, 2.3% for AGIs $25k-50k, 8.7% for AGIs $50k-75k)
Taxable individual retirement arrangement distribution: $10,900 (reported on 5.4% of returns)
75705:
$10,900
Texas:
$19,511
Total itemized deductions: $20,480 (29% of AGI, reported on 16.1% of returns)
Here:
$20,480
State:
$24,724
Here:
29.1% of AGI
State:
15.9% of AGI
(% of AGI for various income ranges: 5.8% for AGIs below $25k, 7.1% for AGIs $25k-50k, 12.8% for AGIs $50k-75k, 13.5% for AGIs $75k-100k, 9.4% for AGIs $100k-200k)
Charity contributions: $6,558 (reported on 12.9% of returns)
Here:
$6,558
State:
$6,808
(% of AGI for various income ranges: 2.2% for AGIs $25k-50k, 2.8% for AGIs $50k-75k, 4.1% for AGIs $75k-100k, 3.2% for AGIs $100k-200k)
Taxes paid: $3,729 (reported on 15.1% of returns)
75705:
$3,729
State:
$6,921
(% of AGI for various income ranges: 0.7% for AGIs below $25k, 1.2% for AGIs $25k-50k, 2.3% for AGIs $50k-75k, 2.1% for AGIs $75k-100k, 1.9% for AGIs $100k-200k)
Earned income credit: $2,476 (reported on 31.2% of returns)
Here:
$2,476
State:
$2,570
(% of AGI for various income ranges: 9.3% for AGIs below $25k, 1.6% for AGIs $25k-50k)
Percentage of individuals using paid preparers for their 2012 taxes: 62.4%
Here:
62%
State:
51%
(% for various income ranges: 61.7% for AGIs below $25k, 62.5% for AGIs $25k-50k, 70.0% for AGIs $50k-75k, 57.1% for AGIs $75k-100k, 60.0% for AGIs $100k-200k)
Averages for the 2004 tax year for zip code 75705, filed in 2005:
Average Adjusted Gross Income (AGI) in 2004: $29,306 (Individual Income Tax Returns)
Here:
$29,306
State:
$47,881
Salary/wage: $27,490 (reported on 87.6% of returns)
Here:
$27,490
State:
$41,947
(% of AGI for various income ranges: 89.6% for AGIs below $10k, 79.8% for AGIs $10k-25k, 87.0% for AGIs $25k-50k, 88.3% for AGIs $50k-75k, 92.9% for AGIs $75k-100k, 58.7% for AGIs over 100k)
Taxable interest for individuals: $950 (reported on 22.9% of returns)
This zip code:
$950
Texas:
$2,255
(% of AGI for various income ranges: 0.4% for AGIs below $10k, 1.3% for AGIs $10k-25k, 0.8% for AGIs $25k-50k, 0.2% for AGIs $50k-75k, 0.1% for AGIs $75k-100k, 1.0% for AGIs over 100k)
Taxable dividends: $474 (reported on 4.9% of returns)
Here:
$474
State:
$4,261
Net capital gain/loss: +$9,038 (reported on 3.3% of returns)
Here:
+$9,038
State:
+$16,110
Profit/loss from business: +$1,946 (reported on 11.9% of returns)
Here:
+$1,946
State:
+$11,013
(% of AGI for various income ranges: 8.9% for AGIs below $10k, 3.6% for AGIs $10k-25k, -1.5% for AGIs $25k-50k, 0.6% for AGIs $50k-75k)
Total itemized deductions: $14,754 (27% of AGI, reported on 14.6% of returns)
Here:
$14,754
State:
$19,631
Here:
27.3% of AGI
State:
18.9% of AGI
(% of AGI for various income ranges: 4.9% for AGIs $10k-25k, 7.2% for AGIs $25k-50k, 14.0% for AGIs $50k-75k, 7.0% for AGIs over 100k)
Charity contributions deductions: $5,390 (10% of AGI, reported on 12.8% of returns)
Here:
$5,390
State:
$4,753
Here:
9.8% of AGI
State:
4.2% of AGI
(% of AGI for various income ranges: 1.5% for AGIs $10k-25k, 2.0% for AGIs $25k-50k, 4.7% for AGIs $50k-75k, 2.6% for AGIs over 100k)
Total tax: $3,685 (reported on 60.3% of returns)
75705:
$3,685
State:
$9,058
(% of AGI for various income ranges: 2.4% for AGIs below $10k, 3.0% for AGIs $10k-25k, 5.6% for AGIs $25k-50k, 9.6% for AGIs $50k-75k, 10.8% for AGIs $75k-100k, 15.0% for AGIs over 100k)
Earned income credit: $1,902 (reported on 35.3% of returns)
Here:
$1,902
State:
$2,024
Percentage of individuals using paid preparers for their 2004 taxes: 64.2%
Here:
64%
State:
57%
(% for various income ranges: 56.0% for AGIs below $10k, 67.8% for AGIs $10k-25k, 67.5% for AGIs $25k-50k, 63.9% for AGIs $50k-75k, 57.1% for AGIs $75k-100k, 57.1% for AGIs over 100k)
Household received Food Stamps/SNAP in the past 12 months: 116 Household did not receive Food Stamps/SNAP in the past 12 months: 566
Women who did not have a birth in the past 12 months: 603 (316 now married, 285 unmarried)
Housing units in zip code 75705 with a mortgage: 229 (11 second mortgage) Median monthly owner costs for units with a mortgage: $1,302 Median monthly owner costs for units without a mortgage: $531
Residents with income below the poverty level in 2022:
This zip code:
13.0%
Whole state:
14.0%
Residents with income below 50% of the poverty level in 2022:
This zip code:
2.0%
Whole state:
7.4%
Median number of rooms in houses and condos:
Here:
5.4
State:
6.3
Median number of rooms in apartments:
Here:
5.9
State:
4.0
Notable locations in this zip code not listed on our city pages
Notable locations in zip code 75705: Douglas (A), Atascocita Branch Library (B), Jackson Heights Volunteer Fire Department (C). Display/hide their locations on the map
Churches in zip code 75705 include: Triumph Church (A), Corinth Church (B), Trinity Fellowship Church (C), Gees Memorial Church (D), Henrys Church (E). Display/hide their locations on the map
Housing units lacking complete plumbing facilities: 13.6% Housing units lacking complete kitchen facilities: 3.7%
64.8%Electricity
29.4%Utility gas
6.1%Bottled, tank, or LP gas
Population in 1990: 1,539. Population change in the 1990s: +217 (+14.1%).
Place of birth for U.S.-born residents:
This state: 1,466
Northeast: 24
Midwest: 328
South: 56
West: 182
70% of the 75705 zip code residents lived in the same house 5 years ago. Out of people who lived in different houses, 83% lived in this county. Out of people who lived in different counties, 50% lived in Texas.
78% of the 75705 zip code residents lived in the same house 1 year ago. Out of people who lived in different houses, 103% moved from different county within same state.
Private vs. public school enrollment:
Students in private schools in grades 1 to 8 (elementary and middle school):
Here:
0.0%
Texas:
8.8%
Students in private schools in grades 9 to 12 (high school):
Here:
0.0%
Texas:
8.0%
Occupation by median earnings in the past 12 months ($)
50,777Health technologists and technicians
36,302Production occupations
30,013Office and administrative support occupations
Top industries in this zip code by the number of employees in 2005:
Health Care and Social Assistance: Home Health Care Services (50-99 employees: 2 establishments)
Accommodation and Food Services: Hotels (except Casino Hotels) and Motels (20-49: 1)
Construction: Drywall and Insulation Contractors (20-49: 1)
Construction: Plumbing, Heating, and Air-Conditioning Contractors (5-9: 1, 1-4: 1)
Other Services (except Public Administration): Civic and Social Organizations (5-9: 1, 1-4: 1)
Construction: Electrical Contractors (1-4: 2)
Other Services (except Public Administration): Religious Organizations (1-4: 2)
Fatal accident statistics in 2014:
Fatal accident count: 1
Vehicles involved in fatal accidents: 1
Fatal accidents caused by drunken drivers: 0
Fatalities: 1
Persons involved in fatal accidents: 6
Pedestrians involved in fatal accidents: 0
Fatal accident statistics in 2013:
Fatal accident count: 1
Vehicles involved in fatal accidents: 1
Fatal accidents caused by drunken drivers: 0
Fatalities: 1
Persons involved in fatal accidents: 4
Pedestrians involved in fatal accidents: 0
Home Mortgage Disclosure Act Aggregated Statistics For Year 2009 (Based on 2 partial tracts)
A) FHA, FSA/RHS & VA Home Purchase Loans
B) Conventional Home Purchase Loans
C) Refinancings
D) Home Improvement Loans
F) Non-occupant Loans on < 5 Family Dwellings (A B C & D)
G) Loans On Manufactured Home Dwelling (A B C & D)
Number
Average Value
Number
Average Value
Number
Average Value
Number
Average Value
Number
Average Value
Number
Average Value
LOANS ORIGINATED
4
$106,450
11
$83,348
16
$129,991
4
$53,728
5
$127,784
5
$59,336
APPLICATIONS APPROVED, NOT ACCEPTED
0
$0
3
$73,870
3
$101,870
0
$0
0
$0
1
$91,150
APPLICATIONS DENIED
0
$0
7
$53,871
8
$75,341
4
$26,920
1
$32,170
5
$54,420
APPLICATIONS WITHDRAWN
1
$293,100
0
$0
7
$112,210
0
$0
1
$42,450
0
$0
FILES CLOSED FOR INCOMPLETENESS
0
$0
1
$159,950
1
$86,230
0
$0
0
$0
0
$0
Aggregated Statistics For Year 2008 (Based on 2 partial tracts)
A) FHA, FSA/RHS & VA Home Purchase Loans
B) Conventional Home Purchase Loans
C) Refinancings
D) Home Improvement Loans
F) Non-occupant Loans on < 5 Family Dwellings (A B C & D)
G) Loans On Manufactured Home Dwelling (A B C & D)
Number
Average Value
Number
Average Value
Number
Average Value
Number
Average Value
Number
Average Value
Number
Average Value
LOANS ORIGINATED
4
$145,545
8
$101,312
13
$95,203
9
$32,319
2
$119,295
5
$67,110
APPLICATIONS APPROVED, NOT ACCEPTED
0
$0
4
$58,978
1
$142,080
2
$42,895
0
$0
4
$76,290
APPLICATIONS DENIED
0
$0
9
$70,247
17
$88,519
10
$36,370
2
$50,265
8
$49,204
APPLICATIONS WITHDRAWN
0
$0
2
$145,435
6
$82,957
0
$0
0
$0
0
$0
FILES CLOSED FOR INCOMPLETENESS
0
$0
1
$122,870
1
$75,060
1
$109,020
0
$0
0
$0
Aggregated Statistics For Year 2007 (Based on 2 partial tracts)
A) FHA, FSA/RHS & VA Home Purchase Loans
B) Conventional Home Purchase Loans
C) Refinancings
D) Home Improvement Loans
F) Non-occupant Loans on < 5 Family Dwellings (A B C & D)
G) Loans On Manufactured Home Dwelling (A B C & D)
Number
Average Value
Number
Average Value
Number
Average Value
Number
Average Value
Number
Average Value
Number
Average Value
LOANS ORIGINATED
3
$115,573
16
$100,642
19
$99,542
6
$43,563
1
$167,100
9
$67,417
APPLICATIONS APPROVED, NOT ACCEPTED
0
$0
8
$72,884
4
$124,098
1
$8,490
1
$40,660
6
$55,105
APPLICATIONS DENIED
0
$0
13
$78,431
29
$85,955
13
$45,298
2
$104,550
11
$44,395
APPLICATIONS WITHDRAWN
1
$113,490
2
$73,050
12
$101,423
1
$90,250
1
$120,190
1
$94,720
FILES CLOSED FOR INCOMPLETENESS
0
$0
2
$79,085
8
$131,974
0
$0
0
$0
0
$0
Aggregated Statistics For Year 2006 (Based on 2 partial tracts)
A) FHA, FSA/RHS & VA Home Purchase Loans
B) Conventional Home Purchase Loans
C) Refinancings
D) Home Improvement Loans
F) Non-occupant Loans on < 5 Family Dwellings (A B C & D)
G) Loans On Manufactured Home Dwelling (A B C & D)
Number
Average Value
Number
Average Value
Number
Average Value
Number
Average Value
Number
Average Value
Number
Average Value
LOANS ORIGINATED
4
$129,238
25
$78,476
15
$108,989
7
$36,383
4
$56,072
9
$75,112
APPLICATIONS APPROVED, NOT ACCEPTED
0
$0
7
$59,871
5
$89,092
1
$46,020
1
$32,620
5
$44,770
APPLICATIONS DENIED
0
$0
25
$59,335
19
$81,224
8
$31,779
2
$37,980
21
$45,574
APPLICATIONS WITHDRAWN
0
$0
3
$68,360
19
$95,662
2
$22,565
2
$54,510
1
$65,230
FILES CLOSED FOR INCOMPLETENESS
0
$0
2
$76,405
3
$130,763
0
$0
0
$0
0
$0
Aggregated Statistics For Year 2005 (Based on 2 partial tracts)
A) FHA, FSA/RHS & VA Home Purchase Loans
B) Conventional Home Purchase Loans
C) Refinancings
D) Home Improvement Loans
F) Non-occupant Loans on < 5 Family Dwellings (A B C & D)
G) Loans On Manufactured Home Dwelling (A B C & D)
Number
Average Value
Number
Average Value
Number
Average Value
Number
Average Value
Number
Average Value
Number
Average Value
LOANS ORIGINATED
5
$93,114
32
$79,586
23
$95,149
9
$53,318
8
$91,594
13
$55,747
APPLICATIONS APPROVED, NOT ACCEPTED
0
$0
11
$53,778
6
$48,702
0
$0
0
$0
11
$45,817
APPLICATIONS DENIED
1
$110,810
22
$56,764
35
$76,467
14
$37,627
4
$72,718
21
$36,446
APPLICATIONS WITHDRAWN
1
$97,400
6
$103,955
14
$98,871
6
$147,147
1
$268,970
0
$0
FILES CLOSED FOR INCOMPLETENESS
0
$0
1
$44,680
5
$69,164
0
$0
0
$0
0
$0
Aggregated Statistics For Year 2004 (Based on 2 partial tracts)
A) FHA, FSA/RHS & VA Home Purchase Loans
B) Conventional Home Purchase Loans
C) Refinancings
D) Home Improvement Loans
F) Non-occupant Loans on < 5 Family Dwellings (A B C & D)
G) Loans On Manufactured Home Dwelling (A B C & D)
Number
Average Value
Number
Average Value
Number
Average Value
Number
Average Value
Number
Average Value
Number
Average Value
LOANS ORIGINATED
2
$87,795
21
$62,531
22
$95,473
4
$55,850
4
$64,450
12
$50,562
APPLICATIONS APPROVED, NOT ACCEPTED
0
$0
6
$41,032
6
$72,828
0
$0
0
$0
6
$38,202
APPLICATIONS DENIED
1
$102,760
17
$62,158
31
$86,564
12
$31,202
1
$102,320
11
$48,092
APPLICATIONS WITHDRAWN
0
$0
1
$65,680
13
$91,182
0
$0
1
$73,280
1
$82,660
FILES CLOSED FOR INCOMPLETENESS
0
$0
0
$0
5
$94,006
0
$0
0
$0
0
$0
Aggregated Statistics For Year 2003 (Based on 2 partial tracts)
A) FHA, FSA/RHS & VA Home Purchase Loans
B) Conventional Home Purchase Loans
C) Refinancings
D) Home Improvement Loans
F) Non-occupant Loans on < 5 Family Dwellings (A B C & D)
Number
Average Value
Number
Average Value
Number
Average Value
Number
Average Value
Number
Average Value
LOANS ORIGINATED
2
$136,495
19
$77,696
28
$72,669
4
$30,382
3
$35,000
APPLICATIONS APPROVED, NOT ACCEPTED
0
$0
7
$47,170
7
$106,083
1
$55,850
0
$0
APPLICATIONS DENIED
0
$0
21
$52,190
28
$65,919
8
$19,045
1
$60,760
APPLICATIONS WITHDRAWN
1
$95,620
2
$246,635
13
$72,175
1
$14,300
0
$0
FILES CLOSED FOR INCOMPLETENESS
0
$0
1
$83,550
0
$0
0
$0
0
$0
Aggregated Statistics For Year 1999 (Based on 1 partial tract)
A) FHA, FSA/RHS & VA Home Purchase Loans
B) Conventional Home Purchase Loans
C) Refinancings
D) Home Improvement Loans
F) Non-occupant Loans on < 5 Family Dwellings (A B C & D)
Detailed PMIC statistics for the following Tracts:0018.01
2003 - 2018 National Fire Incident Reporting System (NFIRS) incidents
Based on the data from the years 2003 - 2018 the average number of fire incidents per year is 49. The highest number of reported fires - 129 took place in 2013, and the least - 0 in 2006. The data has a dropping trend.
When looking into fire subcategories, the most reports belonged to: Outside Fires (64.5%), and Structure Fires (22.5%).
Fire incident types reported to NFIRS in Zip Code 75705


 Nearest zip codes: 75750, 75707, 75792, 75708, 75684, 75682.


 Based on the data from the years 2003 - 2018 the average number of fire incidents per year is 49. The highest number of reported fires - 129 took place in 2013, and the least - 0 in 2006. The data has a dropping trend.
 When looking into fire subcategories, the most reports belonged to: Outside Fires (64.5%), and Structure Fires (22.5%).