Estimated zip code population in 2022: 1,464 Zip code population in 2010: 1,082 Zip code population in 2000: 1,044
Houses and condos: 715 Renter-occupied apartments: 110
% of renters here:
18%
State:
38%
March 2022 cost of living index in zip code 76653: 77.3 (low, U.S. average is 100)
Land area: 148.7 sq. mi. Water area: 2.2 sq. mi.
Population density: 10 people per square mile
(very low).
OSM Map
General Map
Google Map
MSN Map
OSM Map
General Map
Google Map
MSN Map
OSM Map
General Map
Google Map
MSN Map
OSM Map
General Map
Google Map
MSN Map
Please wait while loading the map...
Real estate property taxes paid for housing units in 2022:
This zip code:
0.9% ($1,366)
Texas:
1.5% ($4,050)
Median real estate property taxes paid for housing units with mortgages in 2022: $1,872 (1.4%) Median real estate property taxes paid for housing units with no mortgage in 2022: $1,173 (0.7%)
Business Search- 14 Million verified businesses
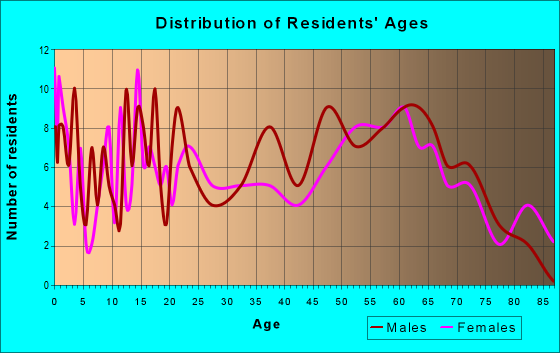
Males: 812
(55.5%)
Females: 651
(44.5%)
For population 25 years and over in 76653:
High school or higher: 86.8%
Bachelor's degree or higher: 7.1%
Graduate or professional degree: 1.4%
Unemployed: 4.1%
Mean travel time to work (commute): 22.3 minutes
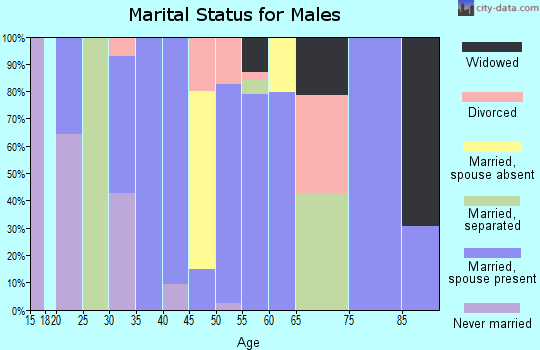
For population 15 years and over in 76653:
Never married: 30.0%
Now married: 52.2%
Separated: 1.1%
Widowed: 9.3%
Divorced: 7.3%
Zip code 76653 compared to state average:
Median house value below state average.
Black race population percentage significantly below state average.
Hispanic race population percentage significantly below state average.
Median age significantly above state average.
Foreign-born population percentage significantly below state average.
Renting percentage below state average.
Length of stay since moving in significantly above state average.
House age above state average.
Number of college students significantly below state average.
Percentage of population with a bachelor's degree or higher significantly below state average.
Averages for the 2020 tax year for zip code 76653, filed in 2021:
Average Adjusted Gross Income (AGI) in 2020: $59,298 (Individual Income Tax Returns)
Here:
$59,298
State:
$77,054
Salary/wage: $53,050 (reported on 78.4% of returns)
Here:
$53,050
State:
$62,766
(% of AGI for various income ranges: 1084.6% for AGIs below $25k, 3593.0% for AGIs $25k-50k, 5728.0% for AGIs $50k-75k, 11476.7% for AGIs $75k-100k, 19820.0% for AGIs $100k-200k)
Taxable interest for individuals: $1,433 (reported on 29.4% of returns)
This zip code:
$1,433
Texas:
$2,665
(% of AGI for various income ranges: 14.6% for AGIs below $25k, 27.0% for AGIs $25k-50k, 12.0% for AGIs $50k-75k, 326.0% for AGIs $100k-200k)
Ordinary dividends: $4,012 (reported on 15.7% of returns)
Here:
$4,012
State:
$10,044
(% of AGI for various income ranges: 109.0% for AGIs $25k-50k, 424.0% for AGIs $100k-200k)
Net capital gain/loss in AGI: +$12,800 (reported on 15.7% of returns)
Here:
+$12,800
State:
+$39,590
(% of AGI for various income ranges: 67.7% for AGIs below $25k, 96.0% for AGIs $50k-75k, 1776.0% for AGIs $100k-200k)
Profit/loss from business: +$9,082 (reported on 21.6% of returns)
Here:
+$9,082
State:
+$10,888
(% of AGI for various income ranges: 344.6% for AGIs below $25k, 834.0% for AGIs $50k-75k, 268.0% for AGIs $100k-200k)
Taxable individual retirement arrangement distribution: $9,725 (reported on 7.8% of returns)
76653:
$9,725
Texas:
$24,740
(% of AGI for various income ranges: 389.0% for AGIs $25k-50k)
Total itemized deductions: $33,400 (reported on 3.9% of returns)
Here:
$33,400
State:
$40,428
(% of AGI for various income ranges: 668.0% for AGIs $25k-50k)
Taxes paid: $4,800 (reported on 3.9% of returns)
76653:
$4,800
State:
$7,821
(% of AGI for various income ranges: 96.0% for AGIs $25k-50k)
Earned income credit: $2,344 (reported on 17.6% of returns)
Here:
$2,344
State:
$2,584
(% of AGI for various income ranges: 89.2% for AGIs below $25k, 95.0% for AGIs $25k-50k)
Percentage of individuals using paid preparers for their 2020 taxes: 92.2%
Here:
92%
State:
92%
(% for various income ranges: 88.2% for AGIs below $25k, 92.3% for AGIs $25k-50k, 100.0% for AGIs $50k-75k, 100.0% for AGIs $75k-100k, 88.9% for AGIs $100k-200k)
Averages for the 2012 tax year for zip code 76653, filed in 2013:
Average Adjusted Gross Income (AGI) in 2012: $43,467 (Individual Income Tax Returns)
Here:
$43,467
State:
$65,384
Salary/wage: $40,881 (reported on 73.8% of returns)
Here:
$40,881
State:
$52,524
(% of AGI for various income ranges: 75.4% for AGIs below $25k, 70.7% for AGIs $25k-50k, 70.7% for AGIs $50k-75k, 74.6% for AGIs $75k-100k, 61.8% for AGIs $100k-200k)
Taxable interest for individuals: $1,192 (reported on 28.6% of returns)
This zip code:
$1,192
Texas:
$2,372
(% of AGI for various income ranges: 2.2% for AGIs below $25k, 0.2% for AGIs $25k-50k, 0.8% for AGIs $50k-75k, 1.1% for AGIs $100k-200k)
Ordinary dividends: $2,150 (reported on 9.5% of returns)
Here:
$2,150
State:
$9,721
Net capital gain/loss in AGI: +$5,400 (reported on 11.9% of returns)
Here:
+$5,400
State:
+$35,319
Profit/loss from business: +$15,214 (reported on 16.7% of returns)
Here:
+$15,214
State:
+$13,732
(% of AGI for various income ranges: 5.9% for AGIs below $25k, 2.7% for AGIs $25k-50k, 19.9% for AGIs $50k-75k)
Taxable individual retirement arrangement distribution: $7,400 (reported on 9.5% of returns)
76653:
$7,400
Texas:
$19,511
Total itemized deductions: $16,900 (26% of AGI, reported on 21.4% of returns)
Here:
$16,900
State:
$24,724
Here:
26.2% of AGI
State:
15.9% of AGI
Charity contributions: $3,133 (reported on 14.3% of returns)
Here:
$3,133
State:
$6,808
Taxes paid: $3,178 (reported on 21.4% of returns)
76653:
$3,178
State:
$6,921
Earned income credit: $2,462 (reported on 19.0% of returns)
Here:
$2,462
State:
$2,570
(% of AGI for various income ranges: 9.1% for AGIs below $25k)
Percentage of individuals using paid preparers for their 2012 taxes: 59.5%
Here:
60%
State:
51%
(% for various income ranges: 52.9% for AGIs below $25k, 60.0% for AGIs $25k-50k, 71.4% for AGIs $50k-75k, 50.0% for AGIs $75k-100k, 75.0% for AGIs $100k-200k)
Averages for the 2004 tax year for zip code 76653, filed in 2005:
Average Adjusted Gross Income (AGI) in 2004: $32,423 (Individual Income Tax Returns)
Here:
$32,423
State:
$47,881
Salary/wage: $29,903 (reported on 74.4% of returns)
Here:
$29,903
State:
$41,947
(% of AGI for various income ranges: 359.6% for AGIs below $10k, 65.0% for AGIs $10k-25k, 78.7% for AGIs $25k-50k, 75.1% for AGIs $50k-75k, 99.7% for AGIs $75k-100k)
Taxable interest for individuals: $1,078 (reported on 37.2% of returns)
This zip code:
$1,078
Texas:
$2,255
(% of AGI for various income ranges: 30.3% for AGIs below $10k, 1.9% for AGIs $10k-25k, 1.0% for AGIs $25k-50k, 0.5% for AGIs $50k-75k, 0.6% for AGIs $75k-100k, 1.4% for AGIs over 100k)
Taxable dividends: $1,707 (reported on 14.0% of returns)
Here:
$1,707
State:
$4,261
(% of AGI for various income ranges: 1.1% for AGIs $10k-25k, 0.5% for AGIs $25k-50k, 0.5% for AGIs $50k-75k, 1.8% for AGIs $75k-100k)
Net capital gain/loss: +$3,600 (reported on 16.9% of returns)
Here:
+$3,600
State:
+$16,110
(% of AGI for various income ranges: 42.7% for AGIs below $10k, 2.0% for AGIs $10k-25k, 0.3% for AGIs $25k-50k, 5.9% for AGIs $50k-75k)
Profit/loss from business: +$3,000 (reported on 20.3% of returns)
Here:
+$3,000
State:
+$11,013
(% of AGI for various income ranges: 103.4% for AGIs below $10k, 8.2% for AGIs $10k-25k, 1.4% for AGIs $25k-50k, -2.1% for AGIs $50k-75k)
Total itemized deductions: $16,574 (26% of AGI, reported on 11.4% of returns)
Here:
$16,574
State:
$19,631
Here:
26.1% of AGI
State:
18.9% of AGI
Charity contributions deductions: $2,767 (4% of AGI, reported on 7.2% of returns)
Here:
$2,767
State:
$4,753
Here:
4.5% of AGI
State:
4.2% of AGI
Total tax: $4,212 (reported on 70.8% of returns)
76653:
$4,212
State:
$9,058
(% of AGI for various income ranges: 16.9% for AGIs below $10k, 4.0% for AGIs $10k-25k, 5.5% for AGIs $25k-50k, 9.0% for AGIs $50k-75k, 12.0% for AGIs $75k-100k, 17.7% for AGIs over 100k)
Earned income credit: $1,796 (reported on 22.5% of returns)
Here:
$1,796
State:
$2,024
Percentage of individuals using paid preparers for their 2004 taxes: 67.6%
Here:
68%
State:
57%
(% for various income ranges: 67.7% for AGIs below $10k, 61.2% for AGIs $10k-25k, 74.8% for AGIs $25k-50k, 63.6% for AGIs $50k-75k, 60.7% for AGIs $75k-100k, 91.7% for AGIs over 100k)
Household received Food Stamps/SNAP in the past 12 months: 51 Household did not receive Food Stamps/SNAP in the past 12 months: 570
Women who had a birth in the past 12 months: 4 (0 now married, 3 unmarried) Women who did not have a birth in the past 12 months: 231 (149 now married, 80 unmarried)
Housing units in zip code 76653 with a mortgage: 127 (5 second mortgage, 6 both second mortgage and home equity loan) Median monthly owner costs for units with a mortgage: $1,233 Median monthly owner costs for units without a mortgage: $474
Residents with income below the poverty level in 2022:
This zip code:
17.3%
Whole state:
14.0%
Residents with income below 50% of the poverty level in 2022:
This zip code:
15.5%
Whole state:
7.4%
Median number of rooms in houses and condos:
Here:
5.8
State:
6.3
Median number of rooms in apartments:
Here:
4.3
State:
4.0
Notable locations in this zip code not listed on our city pages
Churches in zip code 76653 include: Antioch Church (A), Shady Grove Church (B), Ebenezer Church (C), Eutaw Church (D), Fairview Church (E), Hopewell Church (F), Saint Paul Church (G), New Hope Church (H). Display/hide their locations on the map
Cemeteries: Eutaw Cemetery (1), Gunter Cemetery (2), Shady Grove Cemetery (3), Kosse Cemetery (4), Ebenezer Cemetery (5), Hopewell Cemetery (6), Sowders Cemetery (7). Display/hide their locations on the map
Streams, rivers, and creeks: Sandy Creek (A), Sulfur Creek (B), White Branch (C), Pool Branch (D), Mustang Branch (E), Moss Springs Branch (F), Butler Branch (G), Long Branch (H), Burns Branch (I). Display/hide their locations on the map
Size of family households: 171 2-persons, 103 3-persons, 58 4-persons, 10 5-persons, 25 6-persons
Size of nonfamily households: 190 1-person, 63 2-persons, 5 3-persons
84 married couples with children.
46 single-parent households (17 men, 29 women).
91.0% of residents of 76653 zip code speak English at home.
9.1% of residents speak Spanish at home (23% very well, 55% well, 22% not well).
Foreign born population: 79 (5.4%) (9.8% of them are naturalized citizens)
This zip code:
5.4%
Whole state:
17.2%
85%Honduras
7%Sweden
2%Guatemala
22%American
17%English
8%Irish
7%German
5%Scotch-Irish
4%Polish
2%French
Year of entry for the foreign-born population
02010 or later
672000 to 2009
11990 to 1999
13Before 1990
Housing units lacking complete plumbing facilities: 6.0% Housing units lacking complete kitchen facilities: 6.0%
43.5%Electricity
27.0%Bottled, tank, or LP gas
22.3%Utility gas
7.5%Wood
Population in 1990: 854. Population change in the 1990s: +190 (+22.2%).
Place of birth for U.S.-born residents:
This state: 1,138
Northeast: 49
Midwest: 47
South: 54
West: 75
65% of the 76653 zip code residents lived in the same house 5 years ago. Out of people who lived in different houses, 52% lived in this county. Out of people who lived in different counties, 50% lived in Texas.
96% of the 76653 zip code residents lived in the same house 1 year ago. Out of people who lived in different houses, 33% moved from this county. Out of people who lived in different houses, 62% moved from different county within same state. Out of people who lived in different houses, 13% moved from different state.
Private vs. public school enrollment:
Students in private schools in grades 1 to 8 (elementary and middle school):
Here:
0.0%
Texas:
8.8%
Students in private schools in grades 9 to 12 (high school): 1
Here:
3.8%
Texas:
8.0%
Students in private undergraduate colleges: 2
Here:
19.0%
Texas:
16.2%
Occupation by median earnings in the past 12 months ($)
83,812Installation, maintenance, and repair occupations
79,456Health diagnosing and treating practitioners and other technical occupations
64,718Management occupations
64,563Community and social service occupations
60,641Construction and extraction occupations
47,178Law enforcement workers including supervisors
Top industries in this zip code by the number of employees in 2005:
Finance and Insurance: Commercial Banking (10-19 employees: 1 establishment)
Professional, Scientific, and Technical Services: Tax Preparation Services (1-4: 1)
Wholesale Trade: Brick, Stone, and Related Construction Material Merchant Wholesalers (1-4: 1)
Other Services (except Public Administration): Cemeteries and Crematories (1-4: 1)
People in group quarters in 2010:
4 people in nursing facilities/skilled-nursing facilities
People in group quarters in 2000:
21 people in nursing homes
Fatal accident statistics in 2014:
Fatal accident count: 2
Vehicles involved in fatal accidents: 3
Fatal accidents caused by drunken drivers: 0
Fatalities: 3
Persons involved in fatal accidents: 7
Pedestrians involved in fatal accidents: 0
Fatal accident statistics in 2012:
Fatal accident count: 1
Vehicles involved in fatal accidents: 1
Fatal accidents caused by drunken drivers: 0
Fatalities: 1
Persons involved in fatal accidents: 1
Pedestrians involved in fatal accidents: 0
Most common first names in zip code 76653 among deceased individuals
Name
Count
Lived (average)
Robert
14
74.2 years
James
13
78.1 years
John
13
78.2 years
William
13
73.5 years
Mary
11
85.1 years
George
8
79.9 years
Ruby
7
82.7 years
Annie
6
87.7 years
Charlie
6
73.7 years
Joe
6
73.7 years
Most common last names in zip code 76653 among deceased individuals
Last name
Count
Lived (average)
Davis
12
78.3 years
Hunter
10
80.5 years
Hunt
10
86.2 years
Williams
10
78.4 years
Jones
9
78.2 years
Mitchell
9
80.3 years
Johnson
8
70.1 years
Oneal
8
70.6 years
Harper
7
75.9 years
Garrett
7
78.8 years
Businesses in zip code 76653
U-Haul: 1
Discuss Kosse, Texas (TX) on our hugely popular Texas forum.


 Nearest zip codes: 76687, 76629, 76642, 76680, 76661, 77856.