Estimated zip code population in 2022: 2,814 Zip code population in 2010: 2,945 Zip code population in 2000: 2,916
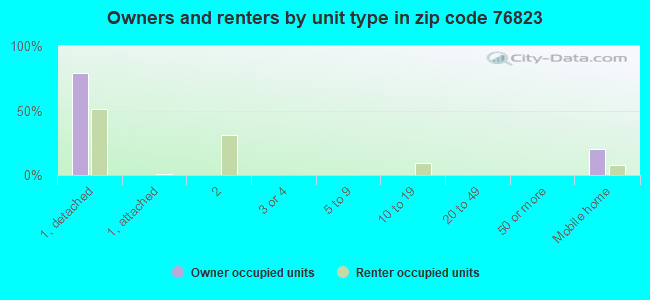
Houses and condos: 1,393 Renter-occupied apartments: 221
% of renters here:
20%
State:
38%
March 2022 cost of living index in zip code 76823: 78.5 (low, U.S. average is 100)
Land area: 112.3 sq. mi. Water area: 0.3 sq. mi.
Population density: 25 people per square mile
(very low).
OSM Map
General Map
Google Map
MSN Map
OSM Map
General Map
Google Map
MSN Map
OSM Map
General Map
Google Map
MSN Map
OSM Map
General Map
Google Map
MSN Map
Please wait while loading the map...
Real estate property taxes paid for housing units in 2022:
This zip code:
1.2% ($1,650)
Texas:
1.5% ($4,050)
Median real estate property taxes paid for housing units with mortgages in 2022: $2,057 (1.0%) Median real estate property taxes paid for housing units with no mortgage in 2022: $1,326 (1.4%)
Business Search- 14 Million verified businesses
Males: 1,510
(53.7%)
Females: 1,303
(46.3%)
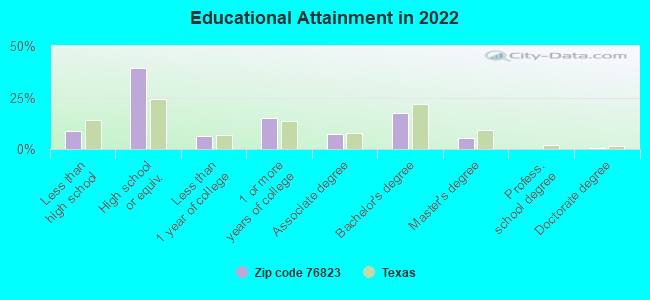
For population 25 years and over in 76823:
High school or higher: 90.6%
Bachelor's degree or higher: 23.0%
Graduate or professional degree: 5.6%
Unemployed: 3.0%
Mean travel time to work (commute): 21.1 minutes
For population 15 years and over in 76823:
Never married: 26.8%
Now married: 55.0%
Separated: 0.6%
Widowed: 6.0%
Divorced: 11.6%
Zip code 76823 compared to state average:
Median house value below state average.
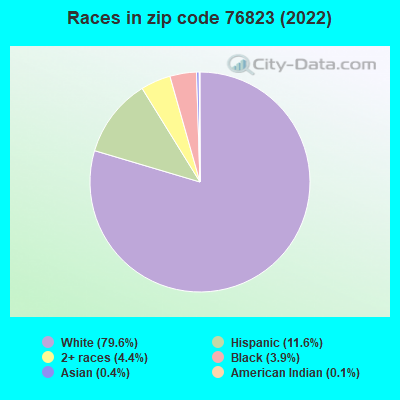
Black race population percentage significantly below state average.
Hispanic race population percentage significantly below state average.
Median age significantly above state average.
Foreign-born population percentage significantly below state average.
Renting percentage below state average.
Length of stay since moving in significantly above state average.
Averages for the 2020 tax year for zip code 76823, filed in 2021:
Average Adjusted Gross Income (AGI) in 2020: $49,228 (Individual Income Tax Returns)
Here:
$49,228
State:
$77,054
Salary/wage: $44,264 (reported on 78.4% of returns)
Here:
$44,264
State:
$62,766
(% of AGI for various income ranges: 1129.7% for AGIs below $25k, 3423.0% for AGIs $25k-50k, 5918.7% for AGIs $50k-75k, 9485.6% for AGIs $75k-100k, 17377.8% for AGIs $100k-200k)
Taxable interest for individuals: $816 (reported on 23.9% of returns)
This zip code:
$816
Texas:
$2,665
(% of AGI for various income ranges: 11.1% for AGIs below $25k, 14.8% for AGIs $25k-50k, 40.0% for AGIs $50k-75k, 7.8% for AGIs $75k-100k, 125.6% for AGIs $100k-200k)
Ordinary dividends: $2,938 (reported on 11.9% of returns)
Here:
$2,938
State:
$10,044
(% of AGI for various income ranges: 21.1% for AGIs below $25k, 34.1% for AGIs $25k-50k, 26.0% for AGIs $50k-75k, 35.6% for AGIs $75k-100k, 254.4% for AGIs $100k-200k)
Net capital gain/loss in AGI: +$8,114 (reported on 10.4% of returns)
Here:
+$8,114
State:
+$39,590
(% of AGI for various income ranges: 17.0% for AGIs below $25k, 27.8% for AGIs $25k-50k, 42.0% for AGIs $50k-75k, 1038.9% for AGIs $100k-200k)
Profit/loss from business: +$11,154 (reported on 17.9% of returns)
Here:
+$11,154
State:
+$10,888
(% of AGI for various income ranges: 94.6% for AGIs below $25k, 163.3% for AGIs $25k-50k, 235.3% for AGIs $50k-75k, 295.6% for AGIs $75k-100k, 1407.8% for AGIs $100k-200k)
Taxable individual retirement arrangement distribution: $17,145 (reported on 8.2% of returns)
76823:
$17,145
Texas:
$24,740
(% of AGI for various income ranges: 52.7% for AGIs below $25k, 170.7% for AGIs $25k-50k, 318.7% for AGIs $50k-75k, 835.6% for AGIs $75k-100k)
Total itemized deductions: $36,400 (reported on 2.2% of returns)
Here:
$36,400
State:
$40,428
(% of AGI for various income ranges: 1213.3% for AGIs $75k-100k)
Charity contributions: $17,650 (reported on 1.5% of returns)
Here:
$17,650
State:
$18,201
(% of AGI for various income ranges: 235.3% for AGIs $50k-75k)
Taxes paid: $5,033 (reported on 2.2% of returns)
76823:
$5,033
State:
$7,821
(% of AGI for various income ranges: 167.8% for AGIs $75k-100k)
Earned income credit: $2,585 (reported on 19.4% of returns)
Here:
$2,585
State:
$2,584
(% of AGI for various income ranges: 121.1% for AGIs below $25k, 83.0% for AGIs $25k-50k)
Percentage of individuals using paid preparers for their 2020 taxes: 89.6%
Here:
90%
State:
92%
(% for various income ranges: 90.2% for AGIs below $25k, 91.2% for AGIs $25k-50k, 90.0% for AGIs $50k-75k, 84.6% for AGIs $75k-100k, 87.5% for AGIs $100k-200k)
Averages for the 2012 tax year for zip code 76823, filed in 2013:
Average Adjusted Gross Income (AGI) in 2012: $40,265 (Individual Income Tax Returns)
Here:
$40,265
State:
$65,384
Salary/wage: $37,931 (reported on 83.5% of returns)
Here:
$37,931
State:
$52,524
(% of AGI for various income ranges: 74.9% for AGIs below $25k, 82.9% for AGIs $25k-50k, 78.6% for AGIs $50k-75k, 81.6% for AGIs $75k-100k, 73.6% for AGIs $100k-200k)
Taxable interest for individuals: $472 (reported on 24.0% of returns)
This zip code:
$472
Texas:
$2,372
(% of AGI for various income ranges: 0.8% for AGIs below $25k, 0.3% for AGIs $25k-50k, 0.1% for AGIs $50k-75k, 0.2% for AGIs $75k-100k, 0.2% for AGIs $100k-200k)
Ordinary dividends: $1,864 (reported on 9.1% of returns)
Here:
$1,864
State:
$9,721
(% of AGI for various income ranges: 0.8% for AGIs $25k-50k, 0.9% for AGIs $75k-100k, 0.3% for AGIs $100k-200k)
Net capital gain/loss in AGI: +$1,360 (reported on 8.3% of returns)
Here:
+$1,360
State:
+$35,319
Profit/loss from business: +$9,290 (reported on 16.5% of returns)
Here:
+$9,290
State:
+$13,732
(% of AGI for various income ranges: 9.3% for AGIs below $25k, 1.9% for AGIs $25k-50k, 4.7% for AGIs $50k-75k, 5.8% for AGIs $75k-100k)
Taxable individual retirement arrangement distribution: $12,427 (reported on 9.1% of returns)
76823:
$12,427
Texas:
$19,511
(% of AGI for various income ranges: 2.1% for AGIs below $25k, 5.0% for AGIs $25k-50k, 6.7% for AGIs $75k-100k)
Total itemized deductions: $19,633 (24% of AGI, reported on 12.4% of returns)
Here:
$19,633
State:
$24,724
Here:
24.0% of AGI
State:
15.9% of AGI
(% of AGI for various income ranges: 5.6% for AGIs $25k-50k, 6.9% for AGIs $50k-75k, 7.0% for AGIs $75k-100k, 8.4% for AGIs $100k-200k)
Charity contributions: $7,133 (reported on 7.4% of returns)
Here:
$7,133
State:
$6,808
(% of AGI for various income ranges: 1.1% for AGIs below $25k, 3.0% for AGIs $50k-75k, 2.4% for AGIs $100k-200k)
Taxes paid: $3,040 (reported on 12.4% of returns)
76823:
$3,040
State:
$6,921
(% of AGI for various income ranges: 0.7% for AGIs $25k-50k, 1.1% for AGIs $50k-75k, 1.1% for AGIs $75k-100k, 1.5% for AGIs $100k-200k)
Earned income credit: $2,357 (reported on 23.1% of returns)
Here:
$2,357
State:
$2,570
(% of AGI for various income ranges: 7.4% for AGIs below $25k, 1.6% for AGIs $25k-50k)
Percentage of individuals using paid preparers for their 2012 taxes: 51.2%
Here:
51%
State:
51%
(% for various income ranges: 45.3% for AGIs below $25k, 46.9% for AGIs $25k-50k, 58.8% for AGIs $50k-75k, 63.6% for AGIs $75k-100k, 75.0% for AGIs $100k-200k)
Averages for the 2004 tax year for zip code 76823, filed in 2005:
Average Adjusted Gross Income (AGI) in 2004: $30,218 (Individual Income Tax Returns)
Here:
$30,218
State:
$47,881
Salary/wage: $29,885 (reported on 83.9% of returns)
Here:
$29,885
State:
$41,947
(% of AGI for various income ranges: 117.0% for AGIs below $10k, 77.3% for AGIs $10k-25k, 84.8% for AGIs $25k-50k, 85.0% for AGIs $50k-75k, 86.9% for AGIs $75k-100k, 57.8% for AGIs over 100k)
Taxable interest for individuals: $968 (reported on 26.4% of returns)
This zip code:
$968
Texas:
$2,255
(% of AGI for various income ranges: 6.0% for AGIs below $10k, 1.6% for AGIs $10k-25k, 0.9% for AGIs $25k-50k, 0.2% for AGIs $50k-75k, 0.4% for AGIs $75k-100k, 0.5% for AGIs over 100k)
Taxable dividends: $742 (reported on 10.4% of returns)
Here:
$742
State:
$4,261
(% of AGI for various income ranges: 0.8% for AGIs below $10k, 0.6% for AGIs $10k-25k, 0.0% for AGIs $25k-50k, 0.1% for AGIs $50k-75k, 0.6% for AGIs $75k-100k)
Net capital gain/loss: +$1,364 (reported on 9.2% of returns)
Here:
+$1,364
State:
+$16,110
(% of AGI for various income ranges: -2.1% for AGIs below $10k, 0.6% for AGIs $10k-25k, 0.5% for AGIs $25k-50k, 0.1% for AGIs $50k-75k, 1.2% for AGIs $75k-100k)
Profit/loss from business: +$6,320 (reported on 18.9% of returns)
Here:
+$6,320
State:
+$11,013
(% of AGI for various income ranges: 4.1% for AGIs below $10k, 6.9% for AGIs $10k-25k, 4.2% for AGIs $25k-50k, 3.8% for AGIs $50k-75k, 2.7% for AGIs $75k-100k)
IRA payment deduction: $3,450 (reported on 1.7% of returns)
76823:
$3,450
Texas:
$3,120
Total itemized deductions: $16,725 (26% of AGI, reported on 8.6% of returns)
Here:
$16,725
State:
$19,631
Here:
26.0% of AGI
State:
18.9% of AGI
(% of AGI for various income ranges: 3.5% for AGIs $10k-25k, 3.8% for AGIs $25k-50k, 4.1% for AGIs $50k-75k, 7.0% for AGIs $75k-100k, 10.4% for AGIs over 100k)
Charity contributions deductions: $5,741 (9% of AGI, reported on 7.1% of returns)
Here:
$5,741
State:
$4,753
Here:
8.8% of AGI
State:
4.2% of AGI
(% of AGI for various income ranges: 0.9% for AGIs $10k-25k, 0.7% for AGIs $25k-50k, 1.1% for AGIs $50k-75k, 3.0% for AGIs $75k-100k, 2.7% for AGIs over 100k)
Total tax: $3,511 (reported on 66.0% of returns)
76823:
$3,511
State:
$9,058
(% of AGI for various income ranges: 3.9% for AGIs below $10k, 3.4% for AGIs $10k-25k, 6.1% for AGIs $25k-50k, 8.1% for AGIs $50k-75k, 10.1% for AGIs $75k-100k, 17.9% for AGIs over 100k)
Earned income credit: $1,803 (reported on 23.4% of returns)
Here:
$1,803
State:
$2,024
Percentage of individuals using paid preparers for their 2004 taxes: 59.5%
Here:
59%
State:
57%
(% for various income ranges: 51.5% for AGIs below $10k, 61.6% for AGIs $10k-25k, 63.6% for AGIs $25k-50k, 54.2% for AGIs $50k-75k, 73.2% for AGIs $75k-100k, 73.7% for AGIs over 100k)
Household received Food Stamps/SNAP in the past 12 months: 114 Household did not receive Food Stamps/SNAP in the past 12 months: 993
Women who had a birth in the past 12 months: 28 (26 now married, 2 unmarried) Women who did not have a birth in the past 12 months: 392 (210 now married, 181 unmarried)
Housing units in zip code 76823 with a mortgage: 393 (1 second mortgage, 2 both second mortgage and home equity loan) Median monthly owner costs for units with a mortgage: $1,231 Median monthly owner costs for units without a mortgage: $518
Residents with income below the poverty level in 2022:
This zip code:
8.7%
Whole state:
14.0%
Residents with income below 50% of the poverty level in 2022:
This zip code:
6.0%
Whole state:
7.4%
Median number of rooms in houses and condos:
Here:
6.1
State:
6.3
Median number of rooms in apartments:
Here:
4.2
State:
4.0
Notable locations in this zip code not listed on our city pages
Reservoirs: Owens Lake (A), Soil Conservation Service Site 9 Reservoir (B), Soil Conservation Service Site 3 Reservoir (C), Soil Conservation Service Site 2 Reservoir (D), Soil Conservation Service Site 4 Reservoir (E), Soil Conservation Service Site 7 Reservoir (F). Display/hide their locations on the map
In group quarters: 43 (-1 institutionalized population)
Size of family households: 438 2-persons, 192 3-persons, 104 4-persons, 51 5-persons, 6 6-persons, 10 7-or-more-persons
Size of nonfamily households: 254 1-person, 54 2-persons
287 married couples with children.
119 single-parent households (38 men, 81 women).
90.8% of residents of 76823 zip code speak English at home.
8.2% of residents speak Spanish at home (68% very well, 8% well, 19% not well, 5% not at all).
0.6% of residents speak other Indo-European language at home (100% very well).
0.6% of residents speak Asian or Pacific Island language at home (100% very well).
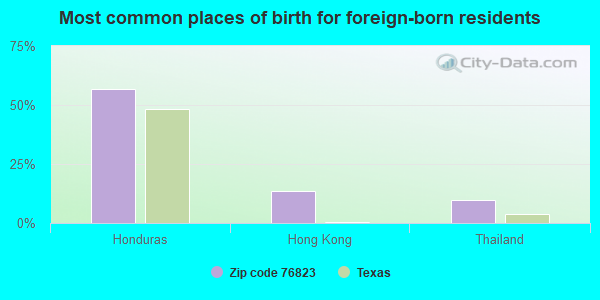
Foreign born population: 103 (3.7%) (29.9% of them are naturalized citizens)
This zip code:
3.7%
Whole state:
17.2%
57%Honduras
13%Hong Kong
10%Thailand
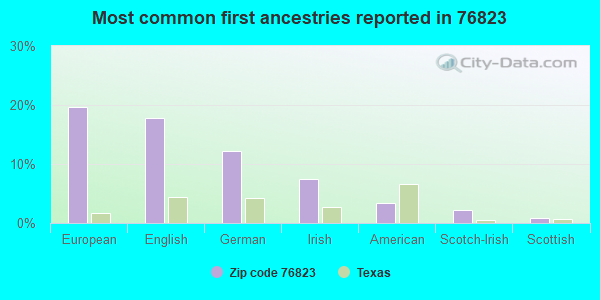
20%European
18%English
12%German
7%Irish
3%American
2%Scotch-Irish
1%Scottish
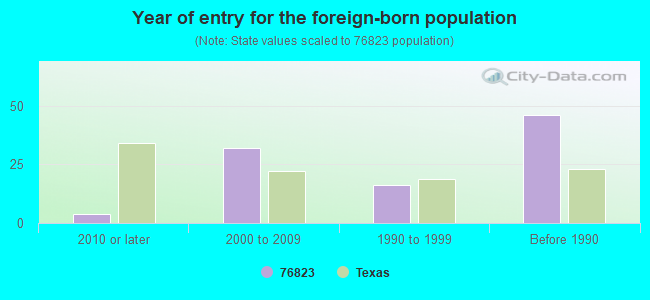
Year of entry for the foreign-born population
42010 or later
322000 to 2009
161990 to 1999
46Before 1990
Facilities with environmental interests located in this zip code:
BANGS H S (200 E HALL in BANGS, TX)
(National Center for Education Statistics) - STATE ID-025901001 Organizations: BANGS ISD (SCHOOL DISTRICT)
BANGS J H (200 E HALL in BANGS, TX)
(National Center for Education Statistics) - STATE ID-025901041 Organizations: BANGS ISD (SCHOOL DISTRICT)
BANGS ISD (3RD STREET in BANGS, TX)
COMPLIANCE ACTIVITY (Tracking inspections of insecticide, fungicide, and rodenticide, and toxic substances) Business SIC classification: ELEMENTARY AND SECONDARY SCHOOLS
Housing units lacking complete plumbing facilities: 8.7% Housing units lacking complete kitchen facilities: 11.3%
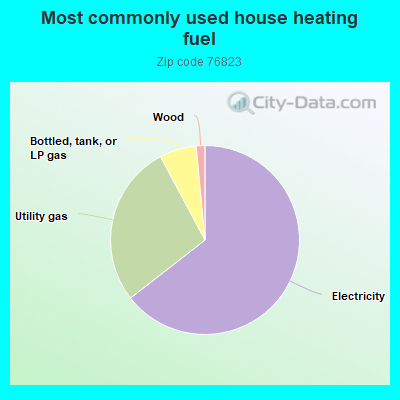
64.6%Electricity
27.8%Utility gas
6.3%Bottled, tank, or LP gas
1.5%Wood
Population in 1990: 5,681.
Place of birth for U.S.-born residents:
This state: 2,164
Northeast: 7
Midwest: 167
South: 172
West: 180
54% of the 76823 zip code residents lived in the same house 5 years ago. Out of people who lived in different houses, 61% lived in this county. Out of people who lived in different counties, 50% lived in Texas.
94% of the 76823 zip code residents lived in the same house 1 year ago. Out of people who lived in different houses, 51% moved from this county. Out of people who lived in different houses, 38% moved from different county within same state. Out of people who lived in different houses, 9% moved from different state. Out of people who lived in different houses, 3% moved from abroad.
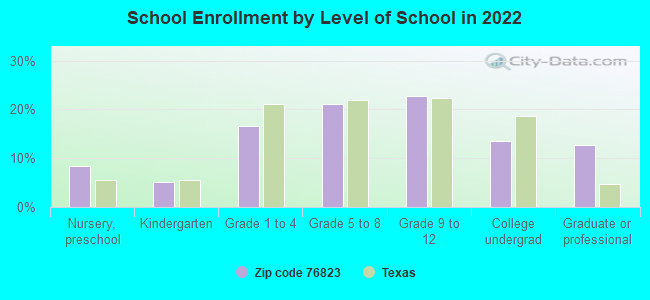
Private vs. public school enrollment:
Students in private schools in grades 1 to 8 (elementary and middle school):
Here:
0.0%
Texas:
8.8%
Students in private schools in grades 9 to 12 (high school):
Here:
0.0%
Texas:
8.0%
Students in private undergraduate colleges: 29
Here:
50.0%
Texas:
16.2%
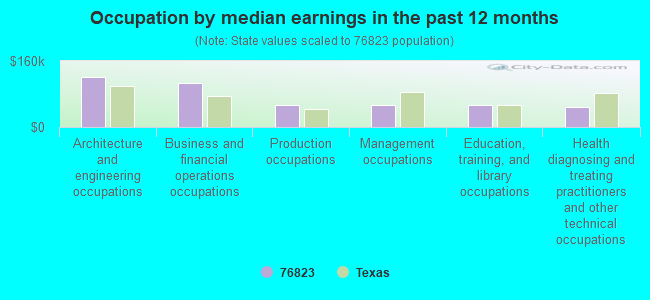
Occupation by median earnings in the past 12 months ($)
120,465Architecture and engineering occupations
105,949Business and financial operations occupations
54,501Production occupations
54,223Management occupations
53,575Education, training, and library occupations
48,928Health diagnosing and treating practitioners and other technical occupations
Companies with federal contracts located in this zip code:
BROWN COUNTY MARKETING (S 3RD HGWY 67 in BANGS, TX; small business)
$7,714 with Army for Fuel Oils. Signed on 2006-06-20. Completion date: 2006-06-15.
Top industries in this zip code by the number of employees in 2005:
Health Care and Social Assistance: Nursing Care Facilities (20-49 employees: 2 establishments)
Accommodation and Food Services: Full-Service Restaurants (20-49: 1, 1-4: 1)
Construction: New Single-Family Housing Construction (except Operative Builders) (10-19: 1, 5-9: 1)
Other Services (except Public Administration): Religious Organizations (10-19: 1, 1-4: 1)
Other Services (except Public Administration): Civic and Social Organizations (10-19: 1, 1-4: 1)
Accommodation and Food Services: Limited-Service Restaurants (10-19: 1, 1-4: 1)
Construction: Masonry Contractors (5-9: 1)
People in group quarters in 2010:
42 people in nursing facilities/skilled-nursing facilities
People in group quarters in 2000:
77 people in nursing homes
2003 - 2018 National Fire Incident Reporting System (NFIRS) incidents
Based on the data from the years 2003 - 2018 the average number of fire incidents per year is 30. The highest number of fire incidents - 92 took place in 2011, and the least - 1 in 2004. The data has a rising trend.
When looking into fire subcategories, the most incidents belonged to: Outside Fires (71.1%), and Structure Fires (20.7%).
Fire incident types reported to NFIRS in Zip Code 76823

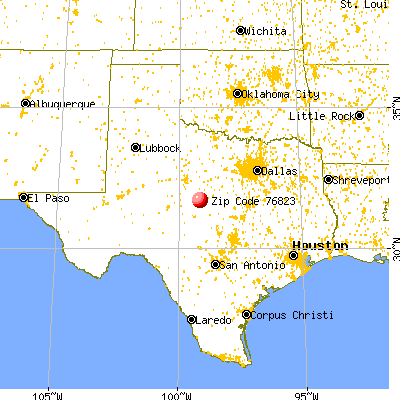


 Nearest zip codes: 76801, 76878, 76827, 76802, 76873, 76857.


 Based on the data from the years 2003 - 2018 the average number of fire incidents per year is 30. The highest number of fire incidents - 92 took place in 2011, and the least - 1 in 2004. The data has a rising trend.
 When looking into fire subcategories, the most incidents belonged to: Outside Fires (71.1%), and Structure Fires (20.7%).