Estimated zip code population in 2022: 6,598 Zip code population in 2010: 5,861 Zip code population in 2000: 5,058
Houses and condos: 3,416 Renter-occupied apartments: 970
% of renters here:
35%
State:
38%
March 2022 cost of living index in zip code 78026: 79.8 (low, U.S. average is 100)
Land area: 216.9 sq. mi. Water area: 0.4 sq. mi.
Population density: 30 people per square mile
(very low).
OSM Map
General Map
Google Map
MSN Map
OSM Map
General Map
Google Map
MSN Map
OSM Map
General Map
Google Map
MSN Map
OSM Map
General Map
Google Map
MSN Map
Please wait while loading the map...
Real estate property taxes paid for housing units in 2022:
This zip code:
1.5% ($2,447)
Texas:
1.5% ($4,050)
Median real estate property taxes paid for housing units with mortgages in 2022: $3,316 (1.6%) Median real estate property taxes paid for housing units with no mortgage in 2022: $2,087 (1.7%)
Averages for the 2020 tax year for zip code 78026, filed in 2021:
Average Adjusted Gross Income (AGI) in 2020: $60,158 (Individual Income Tax Returns)
Here:
$60,158
State:
$77,054
Salary/wage: $47,157 (reported on 84.5% of returns)
Here:
$47,157
State:
$62,766
(% of AGI for various income ranges: 1244.4% for AGIs below $25k, 3724.3% for AGIs $25k-50k, 6499.4% for AGIs $50k-75k, 9456.5% for AGIs $75k-100k, 15960.5% for AGIs $100k-200k)
Taxable interest for individuals: $1,820 (reported on 19.8% of returns)
This zip code:
$1,820
Texas:
$2,665
(% of AGI for various income ranges: 5.2% for AGIs below $25k, 25.5% for AGIs $25k-50k, 23.6% for AGIs $50k-75k, 52.4% for AGIs $75k-100k, 68.6% for AGIs $100k-200k)
Ordinary dividends: $9,914 (reported on 10.4% of returns)
Here:
$9,914
State:
$10,044
(% of AGI for various income ranges: 7.8% for AGIs below $25k, 16.4% for AGIs $25k-50k, 23.0% for AGIs $50k-75k, 35.9% for AGIs $75k-100k, 208.1% for AGIs $100k-200k)
Net capital gain/loss in AGI: +$24,165 (reported on 9.4% of returns)
Here:
+$24,165
State:
+$39,590
(% of AGI for various income ranges: 8.4% for AGIs below $25k, 7.3% for AGIs $25k-50k, 37.3% for AGIs $50k-75k, 72.4% for AGIs $75k-100k, 261.4% for AGIs $100k-200k)
Profit/loss from business: +$8,410 (reported on 17.6% of returns)
Here:
+$8,410
State:
+$10,888
(% of AGI for various income ranges: 136.2% for AGIs below $25k, 56.6% for AGIs $25k-50k, 94.8% for AGIs $50k-75k, 265.3% for AGIs $75k-100k, 678.1% for AGIs $100k-200k)
Taxable individual retirement arrangement distribution: $17,856 (reported on 5.8% of returns)
78026:
$17,856
Texas:
$24,740
(% of AGI for various income ranges: 35.8% for AGIs below $25k, 48.0% for AGIs $25k-50k, 82.7% for AGIs $50k-75k, 266.5% for AGIs $75k-100k, 751.9% for AGIs $100k-200k)
Total itemized deductions: $40,290 (reported on 3.6% of returns)
Here:
$40,290
State:
$40,428
(% of AGI for various income ranges: 68.6% for AGIs below $25k, 246.4% for AGIs $50k-75k, 423.8% for AGIs $100k-200k)
Charity contributions: $19,971 (reported on 2.5% of returns)
Here:
$19,971
State:
$18,201
(% of AGI for various income ranges: 52.7% for AGIs $50k-75k, 582.9% for AGIs $100k-200k)
Taxes paid: $6,267 (reported on 3.2% of returns)
78026:
$6,267
State:
$7,821
(% of AGI for various income ranges: 57.0% for AGIs $50k-75k, 102.4% for AGIs $100k-200k)
Earned income credit: $2,547 (reported on 21.6% of returns)
Here:
$2,547
State:
$2,584
(% of AGI for various income ranges: 131.4% for AGIs below $25k, 87.5% for AGIs $25k-50k)
Percentage of individuals using paid preparers for their 2020 taxes: 92.8%
Here:
93%
State:
92%
(% for various income ranges: 92.2% for AGIs below $25k, 92.9% for AGIs $25k-50k, 92.9% for AGIs $50k-75k, 95.7% for AGIs $75k-100k, 93.8% for AGIs $100k-200k, 87.5% for AGIs over 200k)
Averages for the 2012 tax year for zip code 78026, filed in 2013:
Average Adjusted Gross Income (AGI) in 2012: $67,269 (Individual Income Tax Returns)
Here:
$67,269
State:
$65,384
Salary/wage: $43,296 (reported on 85.7% of returns)
Here:
$43,296
State:
$52,524
(% of AGI for various income ranges: 77.3% for AGIs below $25k, 86.4% for AGIs $25k-50k, 83.1% for AGIs $50k-75k, 83.3% for AGIs $75k-100k, 75.2% for AGIs $100k-200k, 9.0% for AGIs over 200k)
Taxable interest for individuals: $1,185 (reported on 21.4% of returns)
This zip code:
$1,185
Texas:
$2,372
(% of AGI for various income ranges: 0.7% for AGIs below $25k, 0.6% for AGIs $25k-50k, 0.2% for AGIs $50k-75k, 0.1% for AGIs $75k-100k, 0.6% for AGIs $100k-200k, 0.3% for AGIs over 200k)
Ordinary dividends: $5,319 (reported on 10.3% of returns)
Here:
$5,319
State:
$9,721
(% of AGI for various income ranges: 0.8% for AGIs below $25k, 0.2% for AGIs $25k-50k, 0.2% for AGIs $50k-75k, 0.4% for AGIs $75k-100k, 0.6% for AGIs $100k-200k, 1.5% for AGIs over 200k)
Net capital gain/loss in AGI: +$42,414 (reported on 8.3% of returns)
Here:
+$42,414
State:
+$35,319
(% of AGI for various income ranges: 0.2% for AGIs $25k-50k, 0.4% for AGIs $50k-75k, 0.6% for AGIs $75k-100k, 1.8% for AGIs $100k-200k, 13.3% for AGIs over 200k)
Profit/loss from business: +$18,754 (reported on 19.8% of returns)
Here:
+$18,754
State:
+$13,732
(% of AGI for various income ranges: 10.3% for AGIs below $25k, 3.7% for AGIs $25k-50k, 3.4% for AGIs $50k-75k, 4.6% for AGIs $75k-100k, 5.6% for AGIs $100k-200k, 6.3% for AGIs over 200k)
Taxable individual retirement arrangement distribution: $15,023 (reported on 5.2% of returns)
78026:
$15,023
Texas:
$19,511
(% of AGI for various income ranges: 1.3% for AGIs below $25k, 0.7% for AGIs $25k-50k, 3.1% for AGIs $50k-75k, 3.0% for AGIs $100k-200k)
Total itemized deductions: $20,718 (16% of AGI, reported on 15.1% of returns)
Here:
$20,718
State:
$24,724
Here:
15.9% of AGI
State:
15.9% of AGI
(% of AGI for various income ranges: 5.1% for AGIs below $25k, 5.5% for AGIs $25k-50k, 4.5% for AGIs $50k-75k, 7.4% for AGIs $75k-100k, 6.4% for AGIs $100k-200k, 2.4% for AGIs over 200k)
Charity contributions: $6,740 (reported on 9.9% of returns)
Here:
$6,740
State:
$6,808
(% of AGI for various income ranges: 0.4% for AGIs below $25k, 0.4% for AGIs $25k-50k, 0.5% for AGIs $50k-75k, 0.6% for AGIs $75k-100k, 1.3% for AGIs $100k-200k, 1.5% for AGIs over 200k)
Taxes paid: $4,208 (reported on 14.3% of returns)
78026:
$4,208
State:
$6,921
(% of AGI for various income ranges: 0.6% for AGIs below $25k, 0.9% for AGIs $25k-50k, 0.9% for AGIs $50k-75k, 1.4% for AGIs $75k-100k, 1.5% for AGIs $100k-200k, 0.5% for AGIs over 200k)
Earned income credit: $2,410 (reported on 23.8% of returns)
Here:
$2,410
State:
$2,570
(% of AGI for various income ranges: 9.3% for AGIs below $25k, 1.6% for AGIs $25k-50k)
Percentage of individuals using paid preparers for their 2012 taxes: 61.5%
Here:
62%
State:
51%
(% for various income ranges: 57.7% for AGIs below $25k, 56.7% for AGIs $25k-50k, 62.2% for AGIs $50k-75k, 61.5% for AGIs $75k-100k, 79.2% for AGIs $100k-200k, 87.5% for AGIs over 200k)
Averages for the 2004 tax year for zip code 78026, filed in 2005:
Average Adjusted Gross Income (AGI) in 2004: $34,472 (Individual Income Tax Returns)
Here:
$34,472
State:
$47,881
Salary/wage: $31,071 (reported on 85.9% of returns)
Here:
$31,071
State:
$41,947
(% of AGI for various income ranges: 118.5% for AGIs below $10k, 82.4% for AGIs $10k-25k, 88.1% for AGIs $25k-50k, 81.1% for AGIs $50k-75k, 79.7% for AGIs $75k-100k, 48.1% for AGIs over 100k)
Taxable interest for individuals: $1,412 (reported on 29.1% of returns)
This zip code:
$1,412
Texas:
$2,255
(% of AGI for various income ranges: 5.6% for AGIs below $10k, 1.4% for AGIs $10k-25k, 0.6% for AGIs $25k-50k, 0.9% for AGIs $50k-75k, 1.1% for AGIs $75k-100k, 1.7% for AGIs over 100k)
Taxable dividends: $1,950 (reported on 14.2% of returns)
Here:
$1,950
State:
$4,261
(% of AGI for various income ranges: 3.0% for AGIs below $10k, 0.4% for AGIs $10k-25k, 0.3% for AGIs $25k-50k, 0.9% for AGIs $50k-75k, 0.6% for AGIs $75k-100k, 1.6% for AGIs over 100k)
Net capital gain/loss: +$8,819 (reported on 12.7% of returns)
Here:
+$8,819
State:
+$16,110
(% of AGI for various income ranges: 6.9% for AGIs below $10k, 0.7% for AGIs $10k-25k, 0.7% for AGIs $25k-50k, 1.6% for AGIs $50k-75k, 3.6% for AGIs $75k-100k, 9.7% for AGIs over 100k)
Profit/loss from business: +$9,433 (reported on 19.5% of returns)
Here:
+$9,433
State:
+$11,013
(% of AGI for various income ranges: 10.1% for AGIs below $10k, 6.4% for AGIs $10k-25k, 3.4% for AGIs $25k-50k, 2.8% for AGIs $50k-75k, 4.3% for AGIs $75k-100k, 10.2% for AGIs over 100k)
IRA payment deduction: $2,794 (reported on 1.6% of returns)
78026:
$2,794
Texas:
$3,120
Total itemized deductions: $16,167 (24% of AGI, reported on 12.4% of returns)
Here:
$16,167
State:
$19,631
Here:
23.5% of AGI
State:
18.9% of AGI
(% of AGI for various income ranges: 4.8% for AGIs $10k-25k, 6.2% for AGIs $25k-50k, 5.5% for AGIs $50k-75k, 7.2% for AGIs $75k-100k, 5.8% for AGIs over 100k)
Charity contributions deductions: $3,227 (4% of AGI, reported on 8.7% of returns)
Here:
$3,227
State:
$4,753
Here:
4.4% of AGI
State:
4.2% of AGI
(% of AGI for various income ranges: 0.3% for AGIs $10k-25k, 0.6% for AGIs $25k-50k, 0.6% for AGIs $50k-75k, 1.2% for AGIs $75k-100k, 1.5% for AGIs over 100k)
Total tax: $4,835 (reported on 66.9% of returns)
78026:
$4,835
State:
$9,058
(% of AGI for various income ranges: 4.6% for AGIs below $10k, 3.5% for AGIs $10k-25k, 6.2% for AGIs $25k-50k, 8.6% for AGIs $50k-75k, 10.7% for AGIs $75k-100k, 18.6% for AGIs over 100k)
Earned income credit: $2,015 (reported on 27.8% of returns)
Here:
$2,015
State:
$2,024
Percentage of individuals using paid preparers for their 2004 taxes: 65.6%
Here:
66%
State:
57%
(% for various income ranges: 62.0% for AGIs below $10k, 67.4% for AGIs $10k-25k, 63.4% for AGIs $25k-50k, 67.7% for AGIs $50k-75k, 69.0% for AGIs $75k-100k, 75.0% for AGIs over 100k)
Likely homosexual households (counted as self-reported same-sex unmarried-partner households)
Lesbian couples: 0.6% of all households
Gay men: 0.0% of all households
Household received Food Stamps/SNAP in the past 12 months: 285 Household did not receive Food Stamps/SNAP in the past 12 months: 2,473
Women who had a birth in the past 12 months: 112 (0 now married, 108 unmarried) Women who did not have a birth in the past 12 months: 1,440 (768 now married, 667 unmarried)
Housing units in zip code 78026 with a mortgage: 795 (37 second mortgage, 14 both second mortgage and home equity loan) Median monthly owner costs for units with a mortgage: $1,659 Median monthly owner costs for units without a mortgage: $468
Residents with income below the poverty level in 2022:
This zip code:
10.6%
Whole state:
14.0%
Residents with income below 50% of the poverty level in 2022:
This zip code:
8.5%
Whole state:
7.4%
Median number of rooms in houses and condos:
Here:
5.6
State:
6.3
Median number of rooms in apartments:
Here:
3.1
State:
4.0
Notable locations in this zip code not listed on our city pages
Notable locations in zip code 78026: Peeler Ranch (A), Leon Valley Public Library (B), Las Palmas Branch Library (C), Memorial Branch Library (D), Pan American Branch Library (E), Jourdanton Volunteer Fire Department (F), Atascosa County Emergency Medical Services (G). Display/hide their locations on the map
Cemeteries: Mendiola Cemetery (1), Rodriguez Cemetery (2), Alvarado Cemetery (3), Hilburn Cemetery (4), Saint Williams Cemetery (5), Salazar Cemetery (6), Grosco Cemetery (7). Display/hide their locations on the map
Reservoirs: Telephone Tank (A), Open Tank (B), Marshall Lake (C), Hill Tank (D), Highway Tank (E), Peeler Lake (F), Ramsey Tank (G), Strickland Tank (H). Display/hide their locations on the map
In group quarters: 126 (-1 institutionalized population)
Size of family households: 847 2-persons, 380 3-persons, 379 4-persons, 266 5-persons, 72 7-or-more-persons
Size of nonfamily households: 811 1-person
1,032 married couples with children.
237 single-parent households (52 men, 185 women).
72.2% of residents of 78026 zip code speak English at home.
26.5% of residents speak Spanish at home (50% very well, 30% well, 10% not well, 10% not at all).
0.3% of residents speak other Indo-European language at home (100% very well).
1.2% of residents speak Asian or Pacific Island language at home (100% very well).
Foreign born population: 659 (10.0%) (48.5% of them are naturalized citizens)
This zip code:
10.0%
Whole state:
17.2%
75%Honduras
11%Uruguay
10%Malaysia
2%Costa Rica
0%France
11%Italian
9%English
8%German
4%Irish
1%Czech
1%Polish
1%British
Year of entry for the foreign-born population
1922010 or later
972000 to 2009
1381990 to 1999
220Before 1990
Facilities with environmental interests located in this zip code:
ATASCOSA CO ALTER (1508 CAMPBELL ST in JOURDANTON, TX)
(National Center for Education Statistics) - STATE ID-007901002 (National Center for Education Statistics) - STATE ID-007902004 (National Center for Education Statistics) - STATE ID-007905004 Organizations: CHARLOTTE ISD (SCHOOL DISTRICT)
, JOURDANTON ISD (SCHOOL DISTRICT)
, PLEASANTON ISD (SCHOOL DISTRICT)
ATASCOSA COUNTY JUVENILE JUSTI (1511 ZANDERSON AVE in JOURDANTON, TX)
(National Center for Education Statistics) - STATE ID-007902005 Organizations: JOURDANTON ISD (SCHOOL DISTRICT)
ATASCOSA JUVENILE DETENTION CTR (711 BROADWAY ST in JOURDANTON, TX)
(National Center for Education Statistics) - STATE ID-082903003 Organizations: PEARSALL ISD (SCHOOL DISTRICT)
AMERICAN TELEPHONE AND TELEGRAPH COMPANY (HWY 97 4.4 MI S in JOURDANTON, TX)
(Resource Conservation and Recovery Act (tracking hazardous waste)) Alternative names: AMERICAN TEL & TEL CO LONG LINES
ATASCOSA ENERGY CORPORATION (MESQUITE STREET in JOURDANTON, TX)
(Resource Conservation and Recovery Act (tracking hazardous waste))
Housing units lacking complete plumbing facilities: 4.2% Housing units lacking complete kitchen facilities: 6.1%
81.0%Electricity
15.7%Utility gas
2.3%Bottled, tank, or LP gas
1.0%Wood
Population in 1990: 4,615. Population change in the 1990s: +443 (+9.6%).
Place of birth for U.S.-born residents:
This state: 4,872
Northeast: 49
Midwest: 489
South: 233
West: 259
59% of the 78026 zip code residents lived in the same house 5 years ago. Out of people who lived in different houses, 51% lived in this county. Out of people who lived in different counties, 50% lived in Texas.
86% of the 78026 zip code residents lived in the same house 1 year ago. Out of people who lived in different houses, 76% moved from this county. Out of people who lived in different houses, 19% moved from different county within same state.
Private vs. public school enrollment:
Students in private schools in grades 1 to 8 (elementary and middle school):
Here:
0.0%
Texas:
8.8%
Students in private schools in grades 9 to 12 (high school): 43
Here:
12.5%
Texas:
8.0%
Students in private undergraduate colleges:
Here:
0.0%
Texas:
16.2%
Occupation by median earnings in the past 12 months ($)
134,803Health diagnosing and treating practitioners and other technical occupations
96,340Sales and related occupations
77,373Management occupations
69,821Personal care and service occupations
61,772Construction and extraction occupations
52,903Education, training, and library occupations
Companies with federal contracts located in this zip code:
JAMES S RAMIREZ (101 QUAIL NEST DR in JOURDANTON, TX; small business) : $8,215 in 2 contractsfrom 2003 to 2005
$4,955 with Army for Miscellaneous Electrical and Electronic Components. Signed on 2005-04-15. Completion date: 2005-04-30.
$3,260 with Army for Maintenance, Repair or Alteration of Real Property -- Restoration of real property. Signed on 2003-08-21. Completion date: 2003-08-21.
S W HENDERSON, INC (1709 HIGHWAY 97 W in JOURDANTON, TX; small business)
$5,365 with Defense Logistics Agency for Fruits and Vegetables. Signed on 2004-10-15. Completion date: 2004-10-15.
TWIN AVIATION INC (1538 LILLIAN AVE in JOURDANTON, TX; small business)
$2,570 with Air Force for Miscellaneous Power Transmission Equipment. Signed on 2004-10-21. Completion date: 2004-11-02.
Top industries in this zip code by the number of employees in 2005:
Health Care and Social Assistance: General Medical and Surgical Hospitals (50-99 employees: 1 establishment)
Health Care and Social Assistance: Offices of Physicians (except Mental Health Specialists) (20-49: 1, 10-19: 1, 5-9: 2, 1-4: 5)
Health Care and Social Assistance: Nursing Care Facilities (50-99: 1)
Accommodation and Food Services: Limited-Service Restaurants (20-49: 1)
Finance and Insurance: Direct Life Insurance Carriers (20-49: 1)
Detailed PMIC statistics for the following Tracts:9605.00
, 9606.00
2003 - 2018 National Fire Incident Reporting System (NFIRS) incidents
Based on the data from the years 2003 - 2018 the average number of fire incidents per year is 50. The highest number of fire incidents - 114 took place in 2006, and the least - 10 in 2018. The data has a declining trend.
When looking into fire subcategories, the most reports belonged to: Outside Fires (74.1%), and Structure Fires (16.1%).
Fire incident types reported to NFIRS in Zip Code 78026
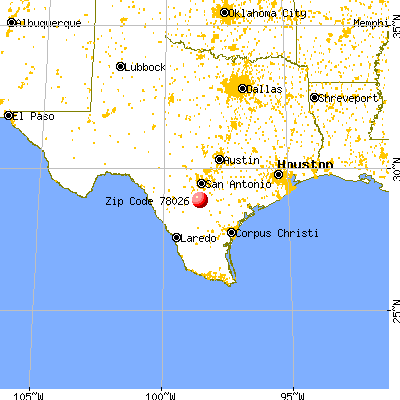


 Nearest zip codes: 78011, 78012, 78064, 78065, 78005, 78050.


 Based on the data from the years 2003 - 2018 the average number of fire incidents per year is 50. The highest number of fire incidents - 114 took place in 2006, and the least - 10 in 2018. The data has a declining trend.
 When looking into fire subcategories, the most reports belonged to: Outside Fires (74.1%), and Structure Fires (16.1%).