Cities: Laredo, TX (4.88%) ,
Ranchos Penitas West, TX (0.28%) ,
Botines, TX (0.26%) ,
Bonanza Hills, TX (0.15%) ,
Los Minerales, TX (0.15%) ,
Four Points, TX (0.07%) ,
Los Huisaches, TX (0.06%) ,
Los Villareales, TX (0.02%) ,
Los Corralitos, TX (0.00%) ,
Sunset Acres, TX (0.00%) County: Webb County, TX Estimated zip code population in 2022: 69,505
Zip code population in 2010: 54,713
Zip code population in 2000: 29,517
Houses and condos: 22,240
Renter-occupied apartments: 4,981
% of renters here:
23%State:
38%
March 2022 cost of living index in zip code 78045: 83.8
(less than average, U.S. average is 100)
Land area: 723.5
sq. mi.
Water area: 3.8
sq. mi.
Population density: 96 people per square mile (very low).
OSM Map
General Map
Google Map
MSN Map
OSM Map
General Map
Google Map
MSN Map
OSM Map
General Map
Google Map
MSN Map
OSM Map
General Map
Google Map
MSN Map
Please wait while loading the map...
Real estate property taxes paid for housing units in 2022:
This zip code:
1.8% ($4,476)Texas:
1.5% ($4,050)
Median real estate property taxes paid for housing units with mortgages in 2022: $4,703 (1.8%)
Median real estate property taxes paid for housing units with no mortgage in 2022: $4,177 (1.9%)
Profiles of local businesses
Business Search - 14 Million verified businesses
Males: 34,785 Females: 34,720
For population 25 years and over in 78045:
High school or higher: 84.4%Bachelor's degree or higher: 37.7%Graduate or professional degree: 11.1%Unemployed: 3.0%Mean travel time to work (commute): 20.1 minutes
For population 15 years and over in 78045:
Never married: 30.6%Now married: 58.7%Separated: 1.7%Widowed: 2.8%Divorced: 6.2%
Zip code 78045 compared to state average:
Black race population percentage significantly below state average. Hispanic race population percentage above state average. Renting percentage below state average. Length of stay since moving in significantly above state average. House age significantly below state average. 65,365 94.0% Hispanic or Latino 3,098 4.5% White 592 0.9% Asian 294 0.4% Black 109 0.2% Two or more races 45 0.06% Some other race
Data:
Median household income ($)
Median household income (% change since 2000)
Household income diversity
Ratio of average income to average house value (%)
Ratio of average income to average rent
Median household income ($) - White
Median household income ($) - Black or African American
Median household income ($) - Asian
Median household income ($) - Hispanic or Latino
Median household income ($) - American Indian and Alaska Native
Median household income ($) - Multirace
Median household income ($) - Other Race
Median household income for houses/condos with a mortgage ($)
Median household income for apartments without a mortgage ($)
Races - White alone (%)
Races - White alone (% change since 2000)
Races - Black alone (%)
Races - Black alone (% change since 2000)
Races - American Indian alone (%)
Races - American Indian alone (% change since 2000)
Races - Asian alone (%)
Races - Asian alone (% change since 2000)
Races - Hispanic (%)
Races - Hispanic (% change since 2000)
Races - Native Hawaiian and Other Pacific Islander alone (%)
Races - Native Hawaiian and Other Pacific Islander alone (% change since 2000)
Races - Two or more races (%)
Races - Two or more races (% change since 2000)
Races - Other race alone (%)
Races - Other race alone (% change since 2000)
Racial diversity
Unemployment (%)
Unemployment (% change since 2000)
Unemployment (%) - White
Unemployment (%) - Black or African American
Unemployment (%) - Asian
Unemployment (%) - Hispanic or Latino
Unemployment (%) - American Indian and Alaska Native
Unemployment (%) - Multirace
Unemployment (%) - Other Race
Population density (people per square mile)
Population - Males (%)
Population - Females (%)
Population - Males (%) - White
Population - Males (%) - Black or African American
Population - Males (%) - Asian
Population - Males (%) - Hispanic or Latino
Population - Males (%) - American Indian and Alaska Native
Population - Males (%) - Multirace
Population - Males (%) - Other Race
Population - Females (%) - White
Population - Females (%) - Black or African American
Population - Females (%) - Asian
Population - Females (%) - Hispanic or Latino
Population - Females (%) - American Indian and Alaska Native
Population - Females (%) - Multirace
Population - Females (%) - Other Race
Coronavirus confirmed cases (May 03, 2024)
Deaths caused by coronavirus (May 03, 2024)
Coronavirus confirmed cases (per 100k population) (May 03, 2024)
Deaths caused by coronavirus (per 100k population) (May 03, 2024)
Daily increase in number of cases (May 03, 2024)
Weekly increase in number of cases (May 03, 2024)
Cases doubled (in days) (May 03, 2024)
Hospitalized patients (Apr 18, 2022)
Negative test results (Apr 18, 2022)
Total test results (Apr 18, 2022)
COVID Vaccine doses distributed (per 100k population) (Sep 19, 2023)
COVID Vaccine doses administered (per 100k population) (Sep 19, 2023)
COVID Vaccine doses distributed (Sep 19, 2023)
COVID Vaccine doses administered (Sep 19, 2023)
Likely homosexual households (%)
Likely homosexual households (% change since 2000)
Likely homosexual households - Lesbian couples (%)
Likely homosexual households - Lesbian couples (% change since 2000)
Likely homosexual households - Gay men (%)
Likely homosexual households - Gay men (% change since 2000)
Cost of living index
Median gross rent ($)
Median contract rent ($)
Median monthly housing costs ($)
Median house or condo value ($)
Median house or condo value ($ change since 2000)
Mean house or condo value by units in structure - 1, detached ($)
Mean house or condo value by units in structure - 1, attached ($)
Mean house or condo value by units in structure - 2 ($)
Mean house or condo value by units in structure by units in structure - 3 or 4 ($)
Mean house or condo value by units in structure - 5 or more ($)
Mean house or condo value by units in structure - Boat, RV, van, etc. ($)
Mean house or condo value by units in structure - Mobile home ($)
Median house or condo value ($) - White
Median house or condo value ($) - Black or African American
Median house or condo value ($) - Asian
Median house or condo value ($) - Hispanic or Latino
Median house or condo value ($) - American Indian and Alaska Native
Median house or condo value ($) - Multirace
Median house or condo value ($) - Other Race
Median resident age
Resident age diversity
Median resident age - Males
Median resident age - Females
Median resident age - White
Median resident age - Black or African American
Median resident age - Asian
Median resident age - Hispanic or Latino
Median resident age - American Indian and Alaska Native
Median resident age - Multirace
Median resident age - Other Race
Median resident age - Males - White
Median resident age - Males - Black or African American
Median resident age - Males - Asian
Median resident age - Males - Hispanic or Latino
Median resident age - Males - American Indian and Alaska Native
Median resident age - Males - Multirace
Median resident age - Males - Other Race
Median resident age - Females - White
Median resident age - Females - Black or African American
Median resident age - Females - Asian
Median resident age - Females - Hispanic or Latino
Median resident age - Females - American Indian and Alaska Native
Median resident age - Females - Multirace
Median resident age - Females - Other Race
Commute - mean travel time to work (minutes)
Travel time to work - Less than 5 minutes (%)
Travel time to work - Less than 5 minutes (% change since 2000)
Travel time to work - 5 to 9 minutes (%)
Travel time to work - 5 to 9 minutes (% change since 2000)
Travel time to work - 10 to 19 minutes (%)
Travel time to work - 10 to 19 minutes (% change since 2000)
Travel time to work - 20 to 29 minutes (%)
Travel time to work - 20 to 29 minutes (% change since 2000)
Travel time to work - 30 to 39 minutes (%)
Travel time to work - 30 to 39 minutes (% change since 2000)
Travel time to work - 40 to 59 minutes (%)
Travel time to work - 40 to 59 minutes (% change since 2000)
Travel time to work - 60 to 89 minutes (%)
Travel time to work - 60 to 89 minutes (% change since 2000)
Travel time to work - 90 or more minutes (%)
Travel time to work - 90 or more minutes (% change since 2000)
Marital status - Never married (%)
Marital status - Now married (%)
Marital status - Separated (%)
Marital status - Widowed (%)
Marital status - Divorced (%)
Median family income ($)
Median family income (% change since 2000)
Median non-family income ($)
Median non-family income (% change since 2000)
Median per capita income ($)
Median per capita income (% change since 2000)
Median family income ($) - White
Median family income ($) - Black or African American
Median family income ($) - Asian
Median family income ($) - Hispanic or Latino
Median family income ($) - American Indian and Alaska Native
Median family income ($) - Multirace
Median family income ($) - Other Race
Median year house/condo built
Median year apartment built
Year house built - Built 2005 or later (%)
Year house built - Built 2000 to 2004 (%)
Year house built - Built 1990 to 1999 (%)
Year house built - Built 1980 to 1989 (%)
Year house built - Built 1970 to 1979 (%)
Year house built - Built 1960 to 1969 (%)
Year house built - Built 1950 to 1959 (%)
Year house built - Built 1940 to 1949 (%)
Year house built - Built 1939 or earlier (%)
Average household size
Household density (households per square mile)
Average household size - White
Average household size - Black or African American
Average household size - Asian
Average household size - Hispanic or Latino
Average household size - American Indian and Alaska Native
Average household size - Multirace
Average household size - Other Race
Occupied housing units (%)
Vacant housing units (%)
Owner occupied housing units (%)
Renter occupied housing units (%)
Vacancy status - For rent (%)
Vacancy status - For sale only (%)
Vacancy status - Rented or sold, not occupied (%)
Vacancy status - For seasonal, recreational, or occasional use (%)
Vacancy status - For migrant workers (%)
Vacancy status - Other vacant (%)
Residents with income below the poverty level (%)
Residents with income below 50% of the poverty level (%)
Children below poverty level (%)
Poor families by family type - Married-couple family (%)
Poor families by family type - Male, no wife present (%)
Poor families by family type - Female, no husband present (%)
Poverty status for native-born residents (%)
Poverty status for foreign-born residents (%)
Poverty among high school graduates not in families (%)
Poverty among people who did not graduate high school not in families (%)
Residents with income below the poverty level (%) - White
Residents with income below the poverty level (%) - Black or African American
Residents with income below the poverty level (%) - Asian
Residents with income below the poverty level (%) - Hispanic or Latino
Residents with income below the poverty level (%) - American Indian and Alaska Native
Residents with income below the poverty level (%) - Multirace
Residents with income below the poverty level (%) - Other Race
Air pollution - Air Quality Index (AQI)
Air pollution - CO
Air pollution - NO2
Air pollution - SO2
Air pollution - Ozone
Air pollution - PM10
Air pollution - PM25
Air pollution - Pb
Crime - Murders per 100,000 population
Crime - Rapes per 100,000 population
Crime - Robberies per 100,000 population
Crime - Assaults per 100,000 population
Crime - Burglaries per 100,000 population
Crime - Thefts per 100,000 population
Crime - Auto thefts per 100,000 population
Crime - Arson per 100,000 population
Crime - City-data.com crime index
Crime - Violent crime index
Crime - Property crime index
Crime - Murders per 100,000 population (5 year average)
Crime - Rapes per 100,000 population (5 year average)
Crime - Robberies per 100,000 population (5 year average)
Crime - Assaults per 100,000 population (5 year average)
Crime - Burglaries per 100,000 population (5 year average)
Crime - Thefts per 100,000 population (5 year average)
Crime - Auto thefts per 100,000 population (5 year average)
Crime - Arson per 100,000 population (5 year average)
Crime - City-data.com crime index (5 year average)
Crime - Violent crime index (5 year average)
Crime - Property crime index (5 year average)
1996 Presidential Elections Results (%) - Democratic Party (Clinton)
1996 Presidential Elections Results (%) - Republican Party (Dole)
1996 Presidential Elections Results (%) - Other
2000 Presidential Elections Results (%) - Democratic Party (Gore)
2000 Presidential Elections Results (%) - Republican Party (Bush)
2000 Presidential Elections Results (%) - Other
2004 Presidential Elections Results (%) - Democratic Party (Kerry)
2004 Presidential Elections Results (%) - Republican Party (Bush)
2004 Presidential Elections Results (%) - Other
2008 Presidential Elections Results (%) - Democratic Party (Obama)
2008 Presidential Elections Results (%) - Republican Party (McCain)
2008 Presidential Elections Results (%) - Other
2012 Presidential Elections Results (%) - Democratic Party (Obama)
2012 Presidential Elections Results (%) - Republican Party (Romney)
2012 Presidential Elections Results (%) - Other
2016 Presidential Elections Results (%) - Democratic Party (Clinton)
2016 Presidential Elections Results (%) - Republican Party (Trump)
2016 Presidential Elections Results (%) - Other
2020 Presidential Elections Results (%) - Democratic Party (Biden)
2020 Presidential Elections Results (%) - Republican Party (Trump)
2020 Presidential Elections Results (%) - Other
Ancestries Reported - Arab (%)
Ancestries Reported - Czech (%)
Ancestries Reported - Danish (%)
Ancestries Reported - Dutch (%)
Ancestries Reported - English (%)
Ancestries Reported - French (%)
Ancestries Reported - French Canadian (%)
Ancestries Reported - German (%)
Ancestries Reported - Greek (%)
Ancestries Reported - Hungarian (%)
Ancestries Reported - Irish (%)
Ancestries Reported - Italian (%)
Ancestries Reported - Lithuanian (%)
Ancestries Reported - Norwegian (%)
Ancestries Reported - Polish (%)
Ancestries Reported - Portuguese (%)
Ancestries Reported - Russian (%)
Ancestries Reported - Scotch-Irish (%)
Ancestries Reported - Scottish (%)
Ancestries Reported - Slovak (%)
Ancestries Reported - Subsaharan African (%)
Ancestries Reported - Swedish (%)
Ancestries Reported - Swiss (%)
Ancestries Reported - Ukrainian (%)
Ancestries Reported - United States (%)
Ancestries Reported - Welsh (%)
Ancestries Reported - West Indian (%)
Ancestries Reported - Other (%)
Educational Attainment - No schooling completed (%)
Educational Attainment - Less than high school (%)
Educational Attainment - High school or equivalent (%)
Educational Attainment - Less than 1 year of college (%)
Educational Attainment - 1 or more years of college (%)
Educational Attainment - Associate degree (%)
Educational Attainment - Bachelor's degree (%)
Educational Attainment - Master's degree (%)
Educational Attainment - Professional school degree (%)
Educational Attainment - Doctorate degree (%)
School Enrollment - Nursery, preschool (%)
School Enrollment - Kindergarten (%)
School Enrollment - Grade 1 to 4 (%)
School Enrollment - Grade 5 to 8 (%)
School Enrollment - Grade 9 to 12 (%)
School Enrollment - College undergrad (%)
School Enrollment - Graduate or professional (%)
School Enrollment - Not enrolled in school (%)
School enrollment - Public schools (%)
School enrollment - Private schools (%)
School enrollment - Not enrolled (%)
Median number of rooms in houses and condos
Median number of rooms in apartments
Housing units lacking complete plumbing facilities (%)
Housing units lacking complete kitchen facilities (%)
Density of houses
Urban houses (%)
Rural houses (%)
Households with people 60 years and over (%)
Households with people 65 years and over (%)
Households with people 75 years and over (%)
Households with one or more nonrelatives (%)
Households with no nonrelatives (%)
Population in households (%)
Family households (%)
Nonfamily households (%)
Population in families (%)
Family households with own children (%)
Median number of bedrooms in owner occupied houses
Mean number of bedrooms in owner occupied houses
Median number of bedrooms in renter occupied houses
Mean number of bedrooms in renter occupied houses
Median number of vehichles in owner occupied houses
Mean number of vehichles in owner occupied houses
Median number of vehichles in renter occupied houses
Mean number of vehichles in renter occupied houses
Mortgage status - with mortgage (%)
Mortgage status - with second mortgage (%)
Mortgage status - with home equity loan (%)
Mortgage status - with both second mortgage and home equity loan (%)
Mortgage status - without a mortgage (%)
Average family size
Average family size - White
Average family size - Black or African American
Average family size - Asian
Average family size - Hispanic or Latino
Average family size - American Indian and Alaska Native
Average family size - Multirace
Average family size - Other Race
Geographical mobility - Same house 1 year ago (%)
Geographical mobility - Moved within same county (%)
Geographical mobility - Moved from different county within same state (%)
Geographical mobility - Moved from different state (%)
Geographical mobility - Moved from abroad (%)
Place of birth - Born in state of residence (%)
Place of birth - Born in other state (%)
Place of birth - Native, outside of US (%)
Place of birth - Foreign born (%)
Housing units in structures - 1, detached (%)
Housing units in structures - 1, attached (%)
Housing units in structures - 2 (%)
Housing units in structures - 3 or 4 (%)
Housing units in structures - 5 to 9 (%)
Housing units in structures - 10 to 19 (%)
Housing units in structures - 20 to 49 (%)
Housing units in structures - 50 or more (%)
Housing units in structures - Mobile home (%)
Housing units in structures - Boat, RV, van, etc. (%)
House/condo owner moved in on average (years ago)
Renter moved in on average (years ago)
Year householder moved into unit - Moved in 1999 to March 2000 (%)
Year householder moved into unit - Moved in 1995 to 1998 (%)
Year householder moved into unit - Moved in 1990 to 1994 (%)
Year householder moved into unit - Moved in 1980 to 1989 (%)
Year householder moved into unit - Moved in 1970 to 1979 (%)
Year householder moved into unit - Moved in 1969 or earlier (%)
Means of transportation to work - Drove car alone (%)
Means of transportation to work - Carpooled (%)
Means of transportation to work - Public transportation (%)
Means of transportation to work - Bus or trolley bus (%)
Means of transportation to work - Streetcar or trolley car (%)
Means of transportation to work - Subway or elevated (%)
Means of transportation to work - Railroad (%)
Means of transportation to work - Ferryboat (%)
Means of transportation to work - Taxicab (%)
Means of transportation to work - Motorcycle (%)
Means of transportation to work - Bicycle (%)
Means of transportation to work - Walked (%)
Means of transportation to work - Other means (%)
Working at home (%)
Industry diversity
Most Common Industries - Agriculture, forestry, fishing and hunting, and mining (%)
Most Common Industries - Agriculture, forestry, fishing and hunting (%)
Most Common Industries - Mining, quarrying, and oil and gas extraction (%)
Most Common Industries - Construction (%)
Most Common Industries - Manufacturing (%)
Most Common Industries - Wholesale trade (%)
Most Common Industries - Retail trade (%)
Most Common Industries - Transportation and warehousing, and utilities (%)
Most Common Industries - Transportation and warehousing (%)
Most Common Industries - Utilities (%)
Most Common Industries - Information (%)
Most Common Industries - Finance and insurance, and real estate and rental and leasing (%)
Most Common Industries - Finance and insurance (%)
Most Common Industries - Real estate and rental and leasing (%)
Most Common Industries - Professional, scientific, and management, and administrative and waste management services (%)
Most Common Industries - Professional, scientific, and technical services (%)
Most Common Industries - Management of companies and enterprises (%)
Most Common Industries - Administrative and support and waste management services (%)
Most Common Industries - Educational services, and health care and social assistance (%)
Most Common Industries - Educational services (%)
Most Common Industries - Health care and social assistance (%)
Most Common Industries - Arts, entertainment, and recreation, and accommodation and food services (%)
Most Common Industries - Arts, entertainment, and recreation (%)
Most Common Industries - Accommodation and food services (%)
Most Common Industries - Other services, except public administration (%)
Most Common Industries - Public administration (%)
Occupation diversity
Most Common Occupations - Management, business, science, and arts occupations (%)
Most Common Occupations - Management, business, and financial occupations (%)
Most Common Occupations - Management occupations (%)
Most Common Occupations - Business and financial operations occupations (%)
Most Common Occupations - Computer, engineering, and science occupations (%)
Most Common Occupations - Computer and mathematical occupations (%)
Most Common Occupations - Architecture and engineering occupations (%)
Most Common Occupations - Life, physical, and social science occupations (%)
Most Common Occupations - Education, legal, community service, arts, and media occupations (%)
Most Common Occupations - Community and social service occupations (%)
Most Common Occupations - Legal occupations (%)
Most Common Occupations - Education, training, and library occupations (%)
Most Common Occupations - Arts, design, entertainment, sports, and media occupations (%)
Most Common Occupations - Healthcare practitioners and technical occupations (%)
Most Common Occupations - Health diagnosing and treating practitioners and other technical occupations (%)
Most Common Occupations - Health technologists and technicians (%)
Most Common Occupations - Service occupations (%)
Most Common Occupations - Healthcare support occupations (%)
Most Common Occupations - Protective service occupations (%)
Most Common Occupations - Fire fighting and prevention, and other protective service workers including supervisors (%)
Most Common Occupations - Law enforcement workers including supervisors (%)
Most Common Occupations - Food preparation and serving related occupations (%)
Most Common Occupations - Building and grounds cleaning and maintenance occupations (%)
Most Common Occupations - Personal care and service occupations (%)
Most Common Occupations - Sales and office occupations (%)
Most Common Occupations - Sales and related occupations (%)
Most Common Occupations - Office and administrative support occupations (%)
Most Common Occupations - Natural resources, construction, and maintenance occupations (%)
Most Common Occupations - Farming, fishing, and forestry occupations (%)
Most Common Occupations - Construction and extraction occupations (%)
Most Common Occupations - Installation, maintenance, and repair occupations (%)
Most Common Occupations - Production, transportation, and material moving occupations (%)
Most Common Occupations - Production occupations (%)
Most Common Occupations - Transportation occupations (%)
Most Common Occupations - Material moving occupations (%)
People in Group quarters - Institutionalized population (%)
People in Group quarters - Correctional institutions (%)
People in Group quarters - Federal prisons and detention centers (%)
People in Group quarters - Halfway houses (%)
People in Group quarters - Local jails and other confinement facilities (including police lockups) (%)
People in Group quarters - Military disciplinary barracks (%)
People in Group quarters - State prisons (%)
People in Group quarters - Other types of correctional institutions (%)
People in Group quarters - Nursing homes (%)
People in Group quarters - Hospitals/wards, hospices, and schools for the handicapped (%)
People in Group quarters - Hospitals/wards and hospices for chronically ill (%)
People in Group quarters - Hospices or homes for chronically ill (%)
People in Group quarters - Military hospitals or wards for chronically ill (%)
People in Group quarters - Other hospitals or wards for chronically ill (%)
People in Group quarters - Hospitals or wards for drug/alcohol abuse (%)
People in Group quarters - Mental (Psychiatric) hospitals or wards (%)
People in Group quarters - Schools, hospitals, or wards for the mentally retarded (%)
People in Group quarters - Schools, hospitals, or wards for the physically handicapped (%)
People in Group quarters - Institutions for the deaf (%)
People in Group quarters - Institutions for the blind (%)
People in Group quarters - Orthopedic wards and institutions for the physically handicapped (%)
People in Group quarters - Wards in general hospitals for patients who have no usual home elsewhere (%)
People in Group quarters - Wards in military hospitals for patients who have no usual home elsewhere (%)
People in Group quarters - Juvenile institutions (%)
People in Group quarters - Long-term care (%)
People in Group quarters - Homes for abused, dependent, and neglected children (%)
People in Group quarters - Residential treatment centers for emotionally disturbed children (%)
People in Group quarters - Training schools for juvenile delinquents (%)
People in Group quarters - Short-term care, detention or diagnostic centers for delinquent children (%)
People in Group quarters - Type of juvenile institution unknown (%)
People in Group quarters - Noninstitutionalized population (%)
People in Group quarters - College dormitories (includes college quarters off campus) (%)
People in Group quarters - Military quarters (%)
People in Group quarters - On base (%)
People in Group quarters - Barracks, unaccompanied personnel housing (UPH), (Enlisted/Officer), ;and similar group living quarters for military personnel (%)
People in Group quarters - Transient quarters for temporary residents (%)
People in Group quarters - Military ships (%)
People in Group quarters - Group homes (%)
People in Group quarters - Homes or halfway houses for drug/alcohol abuse (%)
People in Group quarters - Homes for the mentally ill (%)
People in Group quarters - Homes for the mentally retarded (%)
People in Group quarters - Homes for the physically handicapped (%)
People in Group quarters - Other group homes (%)
People in Group quarters - Religious group quarters (%)
People in Group quarters - Dormitories (%)
People in Group quarters - Agriculture workers' dormitories on farms (%)
People in Group quarters - Job Corps and vocational training facilities (%)
People in Group quarters - Other workers' dormitories (%)
People in Group quarters - Crews of maritime vessels (%)
People in Group quarters - Other nonhousehold living situations (%)
People in Group quarters - Other noninstitutional group quarters (%)
Residents speaking English at home (%)
Residents speaking English at home - Born in the United States (%)
Residents speaking English at home - Native, born elsewhere (%)
Residents speaking English at home - Foreign born (%)
Residents speaking Spanish at home (%)
Residents speaking Spanish at home - Born in the United States (%)
Residents speaking Spanish at home - Native, born elsewhere (%)
Residents speaking Spanish at home - Foreign born (%)
Residents speaking other language at home (%)
Residents speaking other language at home - Born in the United States (%)
Residents speaking other language at home - Native, born elsewhere (%)
Residents speaking other language at home - Foreign born (%)
Class of Workers - Employee of private company (%)
Class of Workers - Self-employed in own incorporated business (%)
Class of Workers - Private not-for-profit wage and salary workers (%)
Class of Workers - Local government workers (%)
Class of Workers - State government workers (%)
Class of Workers - Federal government workers (%)
Class of Workers - Self-employed workers in own not incorporated business and Unpaid family workers (%)
House heating fuel used in houses and condos - Utility gas (%)
House heating fuel used in houses and condos - Bottled, tank, or LP gas (%)
House heating fuel used in houses and condos - Electricity (%)
House heating fuel used in houses and condos - Fuel oil, kerosene, etc. (%)
House heating fuel used in houses and condos - Coal or coke (%)
House heating fuel used in houses and condos - Wood (%)
House heating fuel used in houses and condos - Solar energy (%)
House heating fuel used in houses and condos - Other fuel (%)
House heating fuel used in houses and condos - No fuel used (%)
House heating fuel used in apartments - Utility gas (%)
House heating fuel used in apartments - Bottled, tank, or LP gas (%)
House heating fuel used in apartments - Electricity (%)
House heating fuel used in apartments - Fuel oil, kerosene, etc. (%)
House heating fuel used in apartments - Coal or coke (%)
House heating fuel used in apartments - Wood (%)
House heating fuel used in apartments - Solar energy (%)
House heating fuel used in apartments - Other fuel (%)
House heating fuel used in apartments - No fuel used (%)
Armed forces status - In Armed Forces (%)
Armed forces status - Civilian (%)
Armed forces status - Civilian - Veteran (%)
Armed forces status - Civilian - Nonveteran (%)
Fatal accidents locations in years 2005-2021
Fatal accidents locations in 2005
Fatal accidents locations in 2006
Fatal accidents locations in 2007
Fatal accidents locations in 2008
Fatal accidents locations in 2009
Fatal accidents locations in 2010
Fatal accidents locations in 2011
Fatal accidents locations in 2012
Fatal accidents locations in 2013
Fatal accidents locations in 2014
Fatal accidents locations in 2015
Fatal accidents locations in 2016
Fatal accidents locations in 2017
Fatal accidents locations in 2018
Fatal accidents locations in 2019
Fatal accidents locations in 2020
Fatal accidents locations in 2021
Alcohol use - People drinking some alcohol every month (%)
Alcohol use - People not drinking at all (%)
Alcohol use - Average days/month drinking alcohol
Alcohol use - Average drinks/week
Alcohol use - Average days/year people drink much
Audiometry - Average condition of hearing (%)
Audiometry - People that can hear a whisper from across a quiet room (%)
Audiometry - People that can hear normal voice from across a quiet room (%)
Audiometry - Ears ringing, roaring, buzzing (%)
Audiometry - Had a job exposure to loud noise (%)
Audiometry - Had off-work exposure to loud noise (%)
Blood Pressure & Cholesterol - Has high blood pressure (%)
Blood Pressure & Cholesterol - Checking blood pressure at home (%)
Blood Pressure & Cholesterol - Frequently checking blood cholesterol (%)
Blood Pressure & Cholesterol - Has high cholesterol level (%)
Consumer Behavior - Money monthly spent on food at supermarket/grocery store
Consumer Behavior - Money monthly spent on food at other stores
Consumer Behavior - Money monthly spent on eating out
Consumer Behavior - Money monthly spent on carryout/delivered foods
Consumer Behavior - Income spent on food at supermarket/grocery store (%)
Consumer Behavior - Income spent on food at other stores (%)
Consumer Behavior - Income spent on eating out (%)
Consumer Behavior - Income spent on carryout/delivered foods (%)
Current Health Status - General health condition (%)
Current Health Status - Blood donors (%)
Current Health Status - Has blood ever tested for HIV virus (%)
Current Health Status - Left-handed people (%)
Dermatology - People using sunscreen (%)
Diabetes - Diabetics (%)
Diabetes - Had a blood test for high blood sugar (%)
Diabetes - People taking insulin (%)
Diet Behavior & Nutrition - Diet health (%)
Diet Behavior & Nutrition - Milk product consumption (# of products/month)
Diet Behavior & Nutrition - Meals not home prepared (#/week)
Diet Behavior & Nutrition - Meals from fast food or pizza place (#/week)
Diet Behavior & Nutrition - Ready-to-eat foods (#/month)
Diet Behavior & Nutrition - Frozen meals/pizza (#/month)
Drug Use - People that ever used marijuana or hashish (%)
Drug Use - Ever used hard drugs (%)
Drug Use - Ever used any form of cocaine (%)
Drug Use - Ever used heroin (%)
Drug Use - Ever used methamphetamine (%)
Health Insurance - People covered by health insurance (%)
Kidney Conditions-Urology - Avg. # of times urinating at night
Medical Conditions - People with asthma (%)
Medical Conditions - People with anemia (%)
Medical Conditions - People with psoriasis (%)
Medical Conditions - People with overweight (%)
Medical Conditions - Elderly people having difficulties in thinking or remembering (%)
Medical Conditions - People who ever received blood transfusion (%)
Medical Conditions - People having trouble seeing even with glass/contacts (%)
Medical Conditions - People with arthritis (%)
Medical Conditions - People with gout (%)
Medical Conditions - People with congestive heart failure (%)
Medical Conditions - People with coronary heart disease (%)
Medical Conditions - People with angina pectoris (%)
Medical Conditions - People who ever had heart attack (%)
Medical Conditions - People who ever had stroke (%)
Medical Conditions - People with emphysema (%)
Medical Conditions - People with thyroid problem (%)
Medical Conditions - People with chronic bronchitis (%)
Medical Conditions - People with any liver condition (%)
Medical Conditions - People who ever had cancer or malignancy (%)
Mental Health - People who have little interest in doing things (%)
Mental Health - People feeling down, depressed, or hopeless (%)
Mental Health - People who have trouble sleeping or sleeping too much (%)
Mental Health - People feeling tired or having little energy (%)
Mental Health - People with poor appetite or overeating (%)
Mental Health - People feeling bad about themself (%)
Mental Health - People who have trouble concentrating on things (%)
Mental Health - People moving or speaking slowly or too fast (%)
Mental Health - People having thoughts they would be better off dead (%)
Oral Health - Average years since last visit a dentist
Oral Health - People embarrassed because of mouth (%)
Oral Health - People with gum disease (%)
Oral Health - General health of teeth and gums (%)
Oral Health - Average days a week using dental floss/device
Oral Health - Average days a week using mouthwash for dental problem
Oral Health - Average number of teeth
Pesticide Use - Households using pesticides to control insects (%)
Pesticide Use - Households using pesticides to kill weeds (%)
Physical Activity - People doing vigorous-intensity work activities (%)
Physical Activity - People doing moderate-intensity work activities (%)
Physical Activity - People walking or bicycling (%)
Physical Activity - People doing vigorous-intensity recreational activities (%)
Physical Activity - People doing moderate-intensity recreational activities (%)
Physical Activity - Average hours a day doing sedentary activities
Physical Activity - Average hours a day watching TV or videos
Physical Activity - Average hours a day using computer
Physical Functioning - People having limitations keeping them from working (%)
Physical Functioning - People limited in amount of work they can do (%)
Physical Functioning - People that need special equipment to walk (%)
Physical Functioning - People experiencing confusion/memory problems (%)
Physical Functioning - People requiring special healthcare equipment (%)
Prescription Medications - Average number of prescription medicines taking
Preventive Aspirin Use - Adults 40+ taking low-dose aspirin (%)
Reproductive Health - Vaginal deliveries (%)
Reproductive Health - Cesarean deliveries (%)
Reproductive Health - Deliveries resulted in a live birth (%)
Reproductive Health - Pregnancies resulted in a delivery (%)
Reproductive Health - Women breastfeeding newborns (%)
Reproductive Health - Women that had a hysterectomy (%)
Reproductive Health - Women that had both ovaries removed (%)
Reproductive Health - Women that have ever taken birth control pills (%)
Reproductive Health - Women taking birth control pills (%)
Reproductive Health - Women that have ever used Depo-Provera or injectables (%)
Reproductive Health - Women that have ever used female hormones (%)
Sexual Behavior - People 18+ that ever had sex (vaginal, anal, or oral) (%)
Sexual Behavior - Males 18+ that ever had vaginal sex with a woman (%)
Sexual Behavior - Males 18+ that ever performed oral sex on a woman (%)
Sexual Behavior - Males 18+ that ever had anal sex with a woman (%)
Sexual Behavior - Males 18+ that ever had any sex with a man (%)
Sexual Behavior - Females 18+ that ever had vaginal sex with a man (%)
Sexual Behavior - Females 18+ that ever performed oral sex on a man (%)
Sexual Behavior - Females 18+ that ever had anal sex with a man (%)
Sexual Behavior - Females 18+ that ever had any kind of sex with a woman (%)
Sexual Behavior - Average age people first had sex
Sexual Behavior - Average number of female sex partners in lifetime (males 18+)
Sexual Behavior - Average number of female vaginal sex partners in lifetime (males 18+)
Sexual Behavior - Average age people first performed oral sex on a woman (18+)
Sexual Behavior - Average number of woman performed oral sex on in lifetime (18+)
Sexual Behavior - Average number of male sex partners in lifetime (males 18+)
Sexual Behavior - Average number of male anal sex partners in lifetime (males 18+)
Sexual Behavior - Average age people first performed oral sex on a man (18+)
Sexual Behavior - Average number of male oral sex partners in lifetime (18+)
Sexual Behavior - People using protection when performing oral sex (%)
Sexual Behavior - Average number of times people have vaginal or anal sex a year
Sexual Behavior - People having sex without condom (%)
Sexual Behavior - Average number of male sex partners in lifetime (females 18+)
Sexual Behavior - Average number of male vaginal sex partners in lifetime (females 18+)
Sexual Behavior - Average number of female sex partners in lifetime (females 18+)
Sexual Behavior - Circumcised males 18+ (%)
Sleep Disorders - Average hours sleeping at night
Sleep Disorders - People that has trouble sleeping (%)
Smoking-Cigarette Use - People smoking cigarettes (%)
Taste & Smell - People 40+ having problems with smell (%)
Taste & Smell - People 40+ having problems with taste (%)
Taste & Smell - People 40+ that ever had wisdom teeth removed (%)
Taste & Smell - People 40+ that ever had tonsils teeth removed (%)
Taste & Smell - People 40+ that ever had a loss of consciousness because of a head injury (%)
Taste & Smell - People 40+ that ever had a broken nose or other serious injury to face or skull (%)
Taste & Smell - People 40+ that ever had two or more sinus infections (%)
Weight - Average height (inches)
Weight - Average weight (pounds)
Weight - Average BMI
Weight - People that are obese (%)
Weight - People that ever were obese (%)
Weight - People trying to lose weight (%)
Urban population: 66,003
Rural population: 3,501
Estimated median house/condo value in 2022: $243,810
78045:
$243,810Texas:
$275,400
According to our research of Texas and other state lists, there were 29 registered sex offenders living in 78045 zip code as of May 03, 2024 . The ratio of all residents to sex offenders in zip code 78045 is 2,209 to 1.The ratio of registered sex offenders to all residents in this zip code is much lower than the state average.
Median resident age: This zip code:
32.6 yearsTexas median age:
35.6 years
Average household size: This zip code:
3.2 peopleTexas:
2.6 people
Averages for the 2020 tax year for zip code 78045, filed in 2021:
Average Adjusted Gross Income (AGI) in 2020: $61,936 (Individual Income Tax Returns) Here:
$61,936State:
$77,054
Salary/wage: $53,201 (reported on 84.8% of returns )Here:
$53,201State:
$62,766
(% of AGI for various income ranges: 1130.5% for AGIs below $25k , 3494.4% for AGIs $25k-50k , 6440.5% for AGIs $50k-75k , 9405.3% for AGIs $75k-100k , 16558.4% for AGIs $100k-200k , 75537.9% for AGIs over 200k ) Taxable interest for individuals: $2,840 (reported on 15.2% of returns )This zip code:
$2,840Texas:
$2,665
(% of AGI for various income ranges: 7.0% for AGIs below $25k , 10.5% for AGIs $25k-50k , 19.1% for AGIs $50k-75k , 37.4% for AGIs $75k-100k , 93.0% for AGIs $100k-200k , 3341.7% for AGIs over 200k ) Ordinary dividends: $12,132 (reported on 6.9% of returns )Here:
$12,132State:
$10,044
(% of AGI for various income ranges: 5.3% for AGIs below $25k , 12.8% for AGIs $25k-50k , 17.6% for AGIs $50k-75k , 45.1% for AGIs $75k-100k , 100.9% for AGIs $100k-200k , 8415.4% for AGIs over 200k ) Net capital gain/loss in AGI: +$19,784 (reported on 7.4% of returns )Here:
+$19,784State:
+$39,590
(% of AGI for various income ranges: 3.7% for AGIs below $25k , 15.9% for AGIs $25k-50k , 25.2% for AGIs $50k-75k , 83.7% for AGIs $75k-100k , 222.0% for AGIs $100k-200k , 14599.6% for AGIs over 200k ) Profit/loss from business: +$10,385 (reported on 24.6% of returns )Here:
+$10,385State:
+$10,888
(% of AGI for various income ranges: 238.0% for AGIs below $25k , 185.8% for AGIs $25k-50k , 140.6% for AGIs $50k-75k , 195.7% for AGIs $75k-100k , 375.1% for AGIs $100k-200k , 10750.0% for AGIs over 200k ) Taxable individual retirement arrangement distribution: $24,362 (reported on 2.6% of returns )78045:
$24,362Texas:
$24,740
(% of AGI for various income ranges: 10.3% for AGIs below $25k , 28.3% for AGIs $25k-50k , 46.5% for AGIs $50k-75k , 136.5% for AGIs $75k-100k , 226.9% for AGIs $100k-200k , 2609.2% for AGIs over 200k ) Self-employed (Keogh) retirement plans: $31,000 (reported on 0.1% of returns )78045:
$31,000Texas:
$29,298
(% of AGI for various income ranges: 387.5% for AGIs over 200k ) Total itemized deductions: $28,964 (reported on 4.5% of returns )Here:
$28,964State:
$40,428
(% of AGI for various income ranges: 15.7% for AGIs below $25k , 70.4% for AGIs $25k-50k , 201.4% for AGIs $50k-75k , 283.9% for AGIs $75k-100k , 412.0% for AGIs $100k-200k , 4165.8% for AGIs over 200k ) Charity contributions: $8,331 (reported on 3.1% of returns )(% of AGI for various income ranges: 0.6% for AGIs below $25k , 6.5% for AGIs $25k-50k , 24.7% for AGIs $50k-75k , 43.6% for AGIs $75k-100k , 81.0% for AGIs $100k-200k , 1491.7% for AGIs over 200k ) Taxes paid: $7,476 (reported on 4.4% of returns )(% of AGI for various income ranges: 3.0% for AGIs below $25k , 16.2% for AGIs $25k-50k , 54.1% for AGIs $50k-75k , 83.5% for AGIs $75k-100k , 118.3% for AGIs $100k-200k , 785.4% for AGIs over 200k ) Earned income credit: $2,740 (reported on 25.1% of returns )(% of AGI for various income ranges: 151.6% for AGIs below $25k , 115.4% for AGIs $25k-50k , 1.9% for AGIs $50k-75k ) Percentage of individuals using paid preparers for their 2020 taxes: 90.6%(% for various income ranges: 89.1% for AGIs below $25k , 90.8% for AGIs $25k-50k , 92.0% for AGIs $50k-75k , 92.0% for AGIs $75k-100k , 92.1% for AGIs $100k-200k , 90.1% for AGIs over 200k )
Averages for the 2012 tax year for zip code 78045, filed in 2013:
Average Adjusted Gross Income (AGI) in 2012: $55,010 (Individual Income Tax Returns) Here:
$55,010State:
$65,384
Salary/wage: $47,575 (reported on 87.4% of returns )Here:
$47,575State:
$52,524
(% of AGI for various income ranges: 79.9% for AGIs below $25k , 88.2% for AGIs $25k-50k , 89.3% for AGIs $50k-75k , 90.5% for AGIs $75k-100k , 85.5% for AGIs $100k-200k , 34.9% for AGIs over 200k ) Taxable interest for individuals: $2,075 (reported on 17.2% of returns )This zip code:
$2,075Texas:
$2,372
(% of AGI for various income ranges: 0.6% for AGIs below $25k , 0.3% for AGIs $25k-50k , 0.3% for AGIs $50k-75k , 0.3% for AGIs $75k-100k , 0.6% for AGIs $100k-200k , 1.4% for AGIs over 200k ) Ordinary dividends: $17,480 (reported on 6.5% of returns )(% of AGI for various income ranges: 0.7% for AGIs below $25k , 0.4% for AGIs $25k-50k , 0.4% for AGIs $50k-75k , 0.3% for AGIs $75k-100k , 0.5% for AGIs $100k-200k , 7.9% for AGIs over 200k ) Net capital gain/loss in AGI: +$20,109 (reported on 5.2% of returns )Here:
+$20,109State:
+$35,319
(% of AGI for various income ranges: 0.2% for AGIs $25k-50k , 0.4% for AGIs $50k-75k , 0.3% for AGIs $75k-100k , 0.6% for AGIs $100k-200k , 7.4% for AGIs over 200k ) Profit/loss from business: +$12,769 (reported on 21.1% of returns )Here:
+$12,769State:
+$13,732
(% of AGI for various income ranges: 15.3% for AGIs below $25k , 4.7% for AGIs $25k-50k , 2.4% for AGIs $50k-75k , 1.5% for AGIs $75k-100k , 2.1% for AGIs $100k-200k , 7.3% for AGIs over 200k ) Taxable individual retirement arrangement distribution: $18,131 (reported on 2.6% of returns )78045:
$18,131Texas:
$19,511
(% of AGI for various income ranges: 0.7% for AGIs below $25k , 0.8% for AGIs $25k-50k , 0.9% for AGIs $50k-75k , 0.9% for AGIs $75k-100k , 1.2% for AGIs $100k-200k , 0.6% for AGIs over 200k ) Self-employment retirement plans: $22,900 (reported on 0.2% of returns )78045:
$22,900Texas:
$23,938
Total itemized deductions: $20,440 (18% of AGI, reported on 26.5% of returns )Here:
$20,440State:
$24,724
Here:
18.1% of AGIState:
15.9% of AGI
(% of AGI for various income ranges: 4.4% for AGIs below $25k , 9.5% for AGIs $25k-50k , 12.6% for AGIs $50k-75k , 13.3% for AGIs $75k-100k , 11.8% for AGIs $100k-200k , 6.4% for AGIs over 200k ) Charity contributions: $3,143 (reported on 18.3% of returns )(% of AGI for various income ranges: 0.3% for AGIs below $25k , 0.6% for AGIs $25k-50k , 1.0% for AGIs $50k-75k , 1.1% for AGIs $75k-100k , 1.2% for AGIs $100k-200k , 1.5% for AGIs over 200k ) Taxes paid: $6,033 (reported on 25.8% of returns )(% of AGI for various income ranges: 1.0% for AGIs below $25k , 2.3% for AGIs $25k-50k , 3.3% for AGIs $50k-75k , 3.7% for AGIs $75k-100k , 3.7% for AGIs $100k-200k , 2.1% for AGIs over 200k ) Earned income credit: $2,881 (reported on 28.1% of returns )(% of AGI for various income ranges: 11.2% for AGIs below $25k , 2.2% for AGIs $25k-50k ) Percentage of individuals using paid preparers for their 2012 taxes: 55.6%(% for various income ranges: 50.3% for AGIs below $25k , 55.5% for AGIs $25k-50k , 58.6% for AGIs $50k-75k , 59.3% for AGIs $75k-100k , 64.2% for AGIs $100k-200k , 86.2% for AGIs over 200k )
Averages for the 2004 tax year for zip code 78045, filed in 2005:
Average Adjusted Gross Income (AGI) in 2004: $46,311 (Individual Income Tax Returns) Here:
$46,311State:
$47,881
Salary/wage: $40,589 (reported on 87.1% of returns )Here:
$40,589State:
$41,947
(% of AGI for various income ranges: 169.5% for AGIs below $10k , 82.5% for AGIs $10k-25k , 90.4% for AGIs $25k-50k , 90.1% for AGIs $50k-75k , 88.9% for AGIs $75k-100k , 52.9% for AGIs over 100k ) Taxable interest for individuals: $1,885 (reported on 23.4% of returns )This zip code:
$1,885Texas:
$2,255
(% of AGI for various income ranges: 5.1% for AGIs below $10k , 0.5% for AGIs $10k-25k , 0.5% for AGIs $25k-50k , 0.6% for AGIs $50k-75k , 0.4% for AGIs $75k-100k , 1.5% for AGIs over 100k ) Taxable dividends: $6,154 (reported on 9.2% of returns )(% of AGI for various income ranges: 3.7% for AGIs below $10k , 0.5% for AGIs $10k-25k , 0.4% for AGIs $25k-50k , 0.4% for AGIs $50k-75k , 0.5% for AGIs $75k-100k , 2.5% for AGIs over 100k ) Net capital gain/loss: +$24,885 (reported on 8.4% of returns )Here:
+$24,885State:
+$16,110
(% of AGI for various income ranges: -1.2% for AGIs below $10k , 0.2% for AGIs $10k-25k , 0.5% for AGIs $25k-50k , 0.5% for AGIs $50k-75k , 1.2% for AGIs $75k-100k , 11.1% for AGIs over 100k ) Profit/loss from business: +$11,828 (reported on 19.2% of returns )Here:
+$11,828State:
+$11,013
(% of AGI for various income ranges: 15.4% for AGIs below $10k , 10.8% for AGIs $10k-25k , 3.2% for AGIs $25k-50k , 1.9% for AGIs $50k-75k , 1.8% for AGIs $75k-100k , 6.7% for AGIs over 100k ) IRA payment deduction: $3,076 (reported on 0.9% of returns )(% of AGI for various income ranges: 0.3% for AGIs below $10k , 0.1% for AGIs $25k-50k , 0.1% for AGIs $50k-75k , 0.0% for AGIs $75k-100k , 0.1% for AGIs over 100k ) Self-employed pension: $18,811 (reported on 0.2% of returns )Here:
$18,811Texas:
$16,401
Total itemized deductions: $16,218 (18% of AGI, reported on 27.2% of returns )Here:
$16,218State:
$19,631
Here:
18.5% of AGIState:
18.9% of AGI
(% of AGI for various income ranges: 10.7% for AGIs below $10k , 5.4% for AGIs $10k-25k , 10.3% for AGIs $25k-50k , 11.9% for AGIs $50k-75k , 13.0% for AGIs $75k-100k , 7.6% for AGIs over 100k ) Charity contributions deductions: $2,180 (2% of AGI, reported on 19.9% of returns )Here:
2.2% of AGIState:
4.2% of AGI
(% of AGI for various income ranges: 0.5% for AGIs below $10k , 0.4% for AGIs $10k-25k , 0.7% for AGIs $25k-50k , 0.9% for AGIs $50k-75k , 1.1% for AGIs $75k-100k , 1.2% for AGIs over 100k ) Total tax: $7,862 (reported on 67.3% of returns )(% of AGI for various income ranges: 7.3% for AGIs below $10k , 3.6% for AGIs $10k-25k , 4.9% for AGIs $25k-50k , 7.5% for AGIs $50k-75k , 9.3% for AGIs $75k-100k , 19.8% for AGIs over 100k ) Earned income credit: $2,210 (reported on 27.9% of returns )Percentage of individuals using paid preparers for their 2004 taxes: 64.6%(% for various income ranges: 58.5% for AGIs below $10k , 68.8% for AGIs $10k-25k , 65.4% for AGIs $25k-50k , 61.2% for AGIs $50k-75k , 62.2% for AGIs $75k-100k , 70.9% for AGIs over 100k )
Estimated median household income in 2022: This zip code:
$84,343Texas:
$72,284
Nearest zip codes: 78019 ,
78041 ,
78040 ,
78836 ,
78043 ,
78044 .
Laredo Zip Code Map
Percentage of family households: This zip code:
67.1%Texas:
50.5%
Percentage of households with unmarried partners: This zip code:
3.7%Texas:
48.7%
Likely homosexual households (counted as self-reported same-sex unmarried-partner households)
Lesbian couples: 0.3% of all households Gay men: 0.1% of all households
Household received Food Stamps/SNAP in the past 12 months: 2,538Household did not receive Food Stamps/SNAP in the past 12 months: 19,032
Women who had a birth in the past 12 months: 1,001 (826 now married , 183 unmarried) Women who did not have a birth in the past 12 months: 17,447 (8,859 now married , 8,551 unmarried)
Housing units in zip code 78045 with a mortgage: 10,995 (296
second mortgage , 251
both second mortgage and home equity loan )
Houses without a mortgage: 109
Median monthly owner costs for units with a mortgage: $1,819
Median monthly owner costs for units without a mortgage: $728
Residents with income below the poverty level in 2022:
This zip code:
6.5%Whole state:
14.0%
Residents with income below 50% of the poverty level in 2022:
This zip code:
3.1%Whole state:
7.4%
Median number of rooms in houses and condos: Median number of rooms in apartments: Notable locations in this zip code not listed on our city pages
Click to draw/clear zip code borders Notable locations in zip code 78045: (A) , Apache Ranch (B) , Alexander Ranch (C) , Altos Windmill (D) , Apache Ranch (E) , Casa Blanca Ranch (F) , Chupadera Ranch (G) , Coleman Windmill (H) , Cuatralvo Ranch (I) , Del Alto Windmill (J) , Dolores Ranch (K) , El Jano Windmill (L) , El Laredo Windmill (M) , El Llano Windmill (N) , El Siete Windmill (O) , El Trevino Windmill (P) , Espada Ranch (Q) , Florete Windmill (R) , Fresno Ranch (S) , Fuller Ranch (T) . Display/hide their locations on the map
Churches in zip code 78045 include: (A) , Iglesia Bautista Hispana de Mines Road Church (B) . Display/hide their locations on the map
Cemeteries: (1) , Dolores Cemetery (2) , Tordillo Cemetery (3) . Display/hide their locations on the map
Reservoirs: (A) , North Apache Ranch Lake (B) , South Apache Ranch Lake (C) , Venancio Tank (D) , Venados Tank (E) , Twin Tanks (F) , Hirsch Estate Lake Number 2 (G) , Spohn Ranch Lake (H) . Display/hide their locations on the map
Creeks: (A) , Tejones Creek (B) , Santa Isabel Creek (C) , San Lorenzo Creek (D) , San Cirilo Creek (E) , Saint Heivelda Creek (F) , Pinto Valle Creek (G) , Los Indios Creek (H) , Santo Tomas Creek (I) . Display/hide their locations on the map
Parks in zip code 78045 include: (1) , Krueger Field (2) . Display/hide their locations on the map
Year house built (houses)
104 2020 or later6,353 2010 to 20197,640 2000 to 20094,778 1990 to 19992,097 1980 to 1989593 1970 to 1979414 1960 to 1969316 1950 to 195917 1940 to 19491 1939 or earlier
Zip code 78045 household income distribution in 2022 850 Less than $10,000318 $10,000 to $14,999497 $15,000 to $19,999364 $20,000 to $24,999571 $25,000 to $29,999414 $30,000 to $34,999664 $35,000 to $39,999735 $40,000 to $44,999492 $45,000 to $49,9991,455 $50,000 to $59,9992,425 $60,000 to $74,9994,045 $75,000 to $99,9992,714 $100,000 to $124,9992,284 $125,000 to $149,9991,843 $150,000 to $199,9991,825 $200,000 or moreEstimate of home value of owner-occupied houses/condos in 2022 in zip code 78045 179 Less than $10,00023 $10,000 to $14,99988 $15,000 to $19,99939 $20,000 to $24,99932 $25,000 to $29,99981 $30,000 to $34,9998 $35,000 to $39,99923 $40,000 to $49,99969 $50,000 to $59,99938 $60,000 to $69,999108 $70,000 to $79,99934 $80,000 to $89,99998 $90,000 to $99,9991,053 $100,000 to $124,999931 $125,000 to $149,9991,699 $150,000 to $174,9991,631 $175,000 to $199,9993,154 $200,000 to $249,9992,681 $250,000 to $299,9992,162 $300,000 to $399,999403 $400,000 to $499,999270 $500,000 to $749,999495 $750,000 to $999,99978 $1,000,000 to $1,499,99950 $2,000,000 or moreRent paid by renters in 2022 in zip code 78045 75 $150 to $1996 $200 to $24918 $250 to $29918 $300 to $34922 $350 to $3999 $400 to $44920 $450 to $49971 $500 to $549102 $550 to $59927 $600 to $649105 $650 to $69934 $700 to $74968 $750 to $799492 $800 to $899407 $900 to $9991,167 $1,000 to $1,2491,160 $1,250 to $1,499412 $1,500 to $1,999219 $2,000 to $2,49975 $2,500 to $2,999387 No cash rent
Median gross rent in 2022: $1,329.
Median price asked for vacant for-sale houses and condos in 2022: $209,578.
Estimated median house (or condo) value in 2022 for: White Non-Hispanic householders: $288,856Black or African American householders: $2,226,865American Indian or Alaska Native householders: $291,655Asian householders: $320,414Some other race householders: $241,010Two or more races householders: $349,936Hispanic or Latino householders: $251,953Estimated median house or condo value in 2022: $243,810
78045:
$243,810Texas:
$275,400
Lower value quartile - upper value quartile: $183,490 - $313,136
Mean price in 2022: Detached houses: $241,904Here:
$241,904State:
$369,058
Townhouses or other attached units: $142,809Here:
$142,809State:
$327,631
In 2-unit structures: $543,948Here:
$543,948State:
$374,947
In 3-to-4-unit structures: $33,553Here:
$33,553State:
$209,652
In 5-or-more-unit structures: $412,952Here:
$412,952State:
$413,944
Mobile homes: $95,286Here:
$95,286State:
$124,413
Housing units in structures:
One, detached: 17,588One, attached: 484Two: 453 or 4: 8055 to 9: 47810 to 19: 79020 to 49: 69450 or more: 774Mobile homes: 531Boats, RVs, vans, etc.: 20Unemployment : 3.0%
Means of transportation to work in zip code 78045 77.2% 25,983 Drove a car alone10.8% 3,649 Carpooled0.0% 4 Streetcar or trolley car0.9% 293 Walked1.9% 655 Other means7.3% 2,471 Worked at homeTravel time to work (commute) in zip code 78045 422 Less than 5 minutes3,658 5 to 9 minutes7,093 10 to 14 minutes7,652 15 to 19 minutes5,067 20 to 24 minutes1,242 25 to 29 minutes2,544 30 to 34 minutes262 35 to 39 minutes399 40 to 44 minutes788 45 to 59 minutes655 60 to 89 minutes757 90 or more minutes
Neighborhoods in zip code 78045: Percentage of zip code residents living and working in this county: 95.2%
Household type by relationship:
Households: 69,505
Male householders: 11,796 (1,511 living alone ), Female householders: 9,763 (1,897 living alone )13,858 spouses (13,771 opposite-sex spouses ), 808 unmarried partners , (743 opposite-sex unmarried partners ), 27,631 children (26,944 natural , 150 adopted , 525 stepchildren ), 2,178 grandchildren , 467 brothers or sisters , 717 parents , 14 foster children , 1,449 other relatives , 638 non-relatives In group quarters: 18 (-1 institutionalized population )
Size of family households: 3,987 2-persons , 4,140 3-persons , 4,725 4-persons , 3,061 5-persons , 962 6-persons , 379 7-or-more-persons
Size of nonfamily households: 3,407 1-person , 574 2-persons , 48 3-persons , 28 4-persons
15,951 married couples with children. single-parent households (695 men , 1,955 women ).
14.8% of residents of 78045 zip code speak English at home. of residents speak Spanish at home (66% very well, 20% well, 9% not well, 5% not at all ).of residents speak other Indo-European language at home (91% very well, 9% well ).of residents speak Asian or Pacific Island language at home (57% very well, 22% well, 20% not well ).of residents speak other language at home (49% very well, 51% well ).
Foreign born population: 16,990 (24.4%)
(47.4%
of them are naturalized citizens )
This zip code:
24.4%Whole state:
17.2%
90% Honduras 1% West Indies 1% El Salvador 0% Thailand 0% Guyana 0% Guatemala 0% Taiwan 1% American 1% English 0% German 0% Irish 0% Scotch-Irish 0% Cajun 0% Italian
Year of entry for the foreign-born population
5,317 2010 or later 4,869 2000 to 2009 2,881 1990 to 1999 5,175 Before 1990
Facilities with environmental interests located in this zip code:
ALESA FORWARDING (8400 SAN LORENZO DR in LAREDO, TX)
Conditionally Exempt Small Quantity Generators, less than 100 kg/month of hazardous waste (Resource Conservation and Recovery Act (tracking hazardous waste)) Organizations: UNKNOWN (CONTACT/OWNER)
ALCALOSA FWDG INC. (SB) (8300 SAN LORENZO DR. in LAREDO, TX)
ENFORCEMENT/COMPLIANCE ACTIVITY (Integrated Compliance Information System)
BARRERA FWDG & STORAGE (SB) (8401 LAS CRUCES DR. in LAREDO, TX)
ENFORCEMENT/COMPLIANCE ACTIVITY (Integrated Compliance Information System)
Housing units lacking complete plumbing facilities: 0.7%
Housing units lacking complete kitchen facilities: 1.3%
84.5% Electricity 13.3% Utility gas 1.1% Solar energy 1.0% Bottled, tank, or LP gas
Place of birth for U.S.-born residents:
This state: 46,561Northeast: 499Midwest: 1,566South: 550West: 1,491
53% of the 78045 zip code residents lived in the same house 5 years ago.
Out of people who lived in different houses, 74% lived in this county.
Out of people who lived in different counties, 50% lived in Texas.
91% of the 78045 zip code residents lived in the same house 1 year ago.
Out of people who lived in different houses, 72% moved from this county.
Out of people who lived in different houses, 11% moved from different county within same state.
Out of people who lived in different houses, 6% moved from different state.
Out of people who lived in different houses, 9% moved from abroad.
Private vs. public school enrollment:
Students in private schools in grades 1 to 8 (elementary and middle school): 1,385
Students in private schools in grades 9 to 12 (high school): 75
Students in private undergraduate colleges: 465
Occupation by median earnings in the past 12 months ($)
103,943 Architecture and engineering occupations 103,500 Legal occupations 96,744 Law enforcement workers including supervisors 81,752 Health diagnosing and treating practitioners and other technical occupations 63,006 Management occupations 60,830 Education, training, and library occupations
Companies with federal contracts located in this zip code:
WEST TEXAS DOORS LLC (125 FLECHA LN B in LAREDO, TX; small business)
$17,012 with Army for Construction of Structures and Facilities -- Maintenance Buildings. Signed on 2004-12-07. Completion date: 2005-01-06.
Top industries in this zip code by the number of employees in 2005:
Administrative and Support and Waste Management and Remediation Services: Telemarketing Bureaus (over 1000 employees: 1 establishment)Health Care and Social Assistance: General Medical and Surgical Hospitals (500-999: 1)Accommodation and Food Services: Limited-Service Restaurants (100-249: 1, 50-99: 4, 20-49: 6, 10-19: 1, 5-9: 3, 1-4: 5)Accommodation and Food Services: Full-Service Restaurants (50-99: 3, 20-49: 4, 10-19: 1, 5-9: 1, 1-4: 9)Finance and Insurance: Commercial Banking (100-249: 1, 20-49: 3, 10-19: 3, 1-4: 1)Professional, Scientific, and Technical Services: Process, Physical Distribution, and Logistics Consulting Services (100-249: 1, 20-49: 2, 5-9: 2, 1-4: 5)
People in group quarters in 2010:
32 people in other noninstitutional facilities
3 people in group homes intended for adults
3 people in residential treatment centers for adults
People in group quarters in 2000:
33 people in other noninstitutional group quarters
13 people in other nonhousehold living situations
Fatal accident statistics in 2014:
Fatal accident count: 2Vehicles involved in fatal accidents: 5Fatal accidents caused by drunken drivers: 1Fatalities: 3Persons involved in fatal accidents: 5Pedestrians involved in fatal accidents: 1
Fatal accident statistics in 2013:
Fatal accident count: 7Vehicles involved in fatal accidents: 11Fatal accidents caused by drunken drivers: 2Fatalities: 7Persons involved in fatal accidents: 16Pedestrians involved in fatal accidents: 0
Home Mortgage Disclosure Act Aggregated Statistics For Year 2009(Based on 2 full and 4 partial tracts) A) FHA, FSA/RHS & VA B) Conventional C) Refinancings D) Home Improvement Loans E) Loans on Dwellings For 5+ Families F) Non-occupant Loans on G) Loans On Manufactured Number Average Value Number Average Value Number Average Value Number Average Value Number Average Value Number Average Value Number Average Value
LOANS ORIGINATED 419 $156,652 148 $200,826 538 $155,757 56 $67,231 2 $459,570 59 $145,522 0 $0 APPLICATIONS APPROVED, NOT ACCEPTED 22 $161,193 21 $130,350 169 $144,237 8 $50,710 0 $0 4 $73,435 0 $0 APPLICATIONS DENIED 50 $139,221 35 $147,106 447 $127,117 123 $51,651 0 $0 15 $107,953 7 $49,511 APPLICATIONS WITHDRAWN 58 $142,817 15 $198,686 174 $140,332 27 $59,067 0 $0 7 $140,901 2 $48,545 FILES CLOSED FOR INCOMPLETENESS 10 $136,491 8 $168,272 77 $158,026 26 $73,974 0 $0 6 $103,185 0 $0
Aggregated Statistics For Year 2008(Based on 2 full and 4 partial tracts) A) FHA, FSA/RHS & VA B) Conventional C) Refinancings D) Home Improvement Loans F) Non-occupant Loans on G) Loans On Manufactured Number Average Value Number Average Value Number Average Value Number Average Value Number Average Value Number Average Value
LOANS ORIGINATED 240 $156,932 319 $198,786 388 $150,602 143 $60,309 84 $148,014 3 $24,863 APPLICATIONS APPROVED, NOT ACCEPTED 13 $135,615 48 $215,321 149 $128,125 11 $36,818 15 $169,758 1 $96,530 APPLICATIONS DENIED 62 $166,244 64 $126,150 618 $136,369 292 $45,784 18 $109,416 11 $43,994 APPLICATIONS WITHDRAWN 24 $139,405 30 $208,932 151 $138,502 48 $85,476 9 $112,643 0 $0 FILES CLOSED FOR INCOMPLETENESS 22 $125,378 18 $169,869 37 $130,807 44 $89,214 6 $135,802 0 $0
Aggregated Statistics For Year 2007(Based on 2 full and 4 partial tracts) A) FHA, FSA/RHS & VA B) Conventional C) Refinancings D) Home Improvement Loans E) Loans on Dwellings For 5+ Families F) Non-occupant Loans on G) Loans On Manufactured Number Average Value Number Average Value Number Average Value Number Average Value Number Average Value Number Average Value Number Average Value
LOANS ORIGINATED 178 $147,484 866 $144,666 498 $134,724 177 $53,285 0 $0 109 $145,911 9 $27,607 APPLICATIONS APPROVED, NOT ACCEPTED 12 $147,571 144 $134,091 133 $121,337 42 $28,171 0 $0 10 $96,595 0 $0 APPLICATIONS DENIED 31 $153,377 299 $139,256 767 $134,900 337 $51,548 2 $24,930 41 $98,059 5 $56,528 APPLICATIONS WITHDRAWN 13 $159,077 130 $146,562 333 $126,444 84 $97,305 0 $0 16 $139,562 2 $49,365 FILES CLOSED FOR INCOMPLETENESS 2 $69,655 69 $147,965 153 $187,944 41 $82,535 0 $0 5 $99,526 0 $0
Aggregated Statistics For Year 2006(Based on 2 full and 4 partial tracts) A) FHA, FSA/RHS & VA B) Conventional C) Refinancings D) Home Improvement Loans E) Loans on Dwellings For 5+ Families F) Non-occupant Loans on G) Loans On Manufactured Number Average Value Number Average Value Number Average Value Number Average Value Number Average Value Number Average Value Number Average Value
LOANS ORIGINATED 174 $137,825 1,590 $119,654 520 $135,374 192 $38,798 3 $451,787 143 $106,066 9 $33,558 APPLICATIONS APPROVED, NOT ACCEPTED 12 $137,802 207 $102,847 122 $125,380 27 $31,466 0 $0 16 $113,419 2 $39,950 APPLICATIONS DENIED 10 $122,250 355 $104,258 701 $132,481 269 $31,441 0 $0 49 $86,121 6 $29,227 APPLICATIONS WITHDRAWN 9 $132,120 175 $120,599 475 $126,801 58 $82,548 0 $0 10 $111,963 0 $0 FILES CLOSED FOR INCOMPLETENESS 2 $66,430 42 $87,462 150 $121,995 26 $73,985 0 $0 3 $94,127 0 $0
Aggregated Statistics For Year 2005(Based on 2 full and 4 partial tracts) A) FHA, FSA/RHS & VA B) Conventional C) Refinancings D) Home Improvement Loans E) Loans on Dwellings For 5+ Families F) Non-occupant Loans on G) Loans On Manufactured Number Average Value Number Average Value Number Average Value Number Average Value Number Average Value Number Average Value Number Average Value
LOANS ORIGINATED 194 $123,483 1,326 $117,736 701 $123,082 206 $70,365 2 $788,310 152 $112,629 4 $41,222 APPLICATIONS APPROVED, NOT ACCEPTED 9 $109,781 219 $93,064 131 $111,994 50 $40,854 0 $0 11 $90,173 5 $60,618 APPLICATIONS DENIED 12 $117,632 380 $107,816 882 $115,252 277 $29,965 0 $0 47 $73,847 22 $27,391 APPLICATIONS WITHDRAWN 5 $115,094 210 $114,031 503 $148,270 168 $235,027 0 $0 23 $112,076 3 $77,883 FILES CLOSED FOR INCOMPLETENESS 0 $0 38 $92,865 298 $117,550 6 $39,788 0 $0 1 $119,930 0 $0
Aggregated Statistics For Year 2004(Based on 2 full and 4 partial tracts) A) FHA, FSA/RHS & VA B) Conventional C) Refinancings D) Home Improvement Loans E) Loans on Dwellings For 5+ Families F) Non-occupant Loans on G) Loans On Manufactured Number Average Value Number Average Value Number Average Value Number Average Value Number Average Value Number Average Value Number Average Value
LOANS ORIGINATED 223 $114,711 821 $133,233 838 $109,261 114 $39,865 4 $334,570 113 $106,921 6 $39,632 APPLICATIONS APPROVED, NOT ACCEPTED 12 $90,956 122 $132,751 224 $93,137 35 $36,605 0 $0 11 $98,334 3 $29,543 APPLICATIONS DENIED 11 $107,827 191 $101,006 919 $103,215 187 $30,260 0 $0 50 $79,019 13 $44,117 APPLICATIONS WITHDRAWN 23 $107,877 113 $156,747 528 $115,630 33 $47,006 0 $0 19 $74,233 3 $25,840 FILES CLOSED FOR INCOMPLETENESS 4 $166,765 37 $125,528 421 $122,052 9 $138,181 0 $0 4 $100,830 0 $0
Aggregated Statistics For Year 2003(Based on 2 full and 4 partial tracts) A) FHA, FSA/RHS & VA B) Conventional C) Refinancings D) Home Improvement Loans E) Loans on Dwellings For 5+ Families F) Non-occupant Loans on Number Average Value Number Average Value Number Average Value Number Average Value Number Average Value Number Average Value
LOANS ORIGINATED 285 $112,869 684 $138,902 1,295 $114,384 133 $20,648 5 $314,224 105 $89,660 APPLICATIONS APPROVED, NOT ACCEPTED 21 $113,555 112 $134,489 256 $97,718 14 $24,356 0 $0 17 $78,578 APPLICATIONS DENIED 35 $106,841 128 $115,857 742 $89,861 132 $28,624 0 $0 32 $84,686 APPLICATIONS WITHDRAWN 14 $102,926 94 $142,745 645 $102,088 8 $33,428 0 $0 27 $76,608 FILES CLOSED FOR INCOMPLETENESS 6 $113,092 21 $104,178 83 $110,721 8 $18,649 0 $0 2 $54,320
Aggregated Statistics For Year 2002(Based on 4 partial tracts) A) FHA, FSA/RHS & VA B) Conventional C) Refinancings D) Home Improvement Loans F) Non-occupant Loans on Number Average Value Number Average Value Number Average Value Number Average Value Number Average Value
LOANS ORIGINATED 137 $91,935 149 $96,311 218 $80,868 31 $12,395 12 $74,330 APPLICATIONS APPROVED, NOT ACCEPTED 4 $91,038 18 $97,942 41 $72,177 4 $26,812 3 $58,050 APPLICATIONS DENIED 11 $91,623 43 $72,650 123 $69,912 38 $17,233 6 $60,763 APPLICATIONS WITHDRAWN 24 $94,565 25 $80,779 97 $78,443 5 $7,220 7 $55,889 FILES CLOSED FOR INCOMPLETENESS 4 $69,010 3 $120,117 52 $88,466 0 $0 0 $0
Aggregated Statistics For Year 2001(Based on 4 partial tracts) A) FHA, FSA/RHS & VA B) Conventional C) Refinancings D) Home Improvement Loans F) Non-occupant Loans on Number Average Value Number Average Value Number Average Value Number Average Value Number Average Value
LOANS ORIGINATED 147 $85,476 142 $79,161 155 $75,466 62 $10,859 54 $71,491 APPLICATIONS APPROVED, NOT ACCEPTED 4 $90,295 11 $77,013 24 $69,772 5 $8,220 4 $67,260 APPLICATIONS DENIED 29 $92,054 94 $68,082 107 $72,955 29 $7,152 13 $62,763 APPLICATIONS WITHDRAWN 40 $79,376 125 $81,555 61 $63,490 1 $14,630 4 $109,920 FILES CLOSED FOR INCOMPLETENESS 6 $75,432 4 $102,812 23 $76,105 0 $0 2 $90,820
Aggregated Statistics For Year 2000(Based on 4 partial tracts) A) FHA, FSA/RHS & VA B) Conventional C) Refinancings D) Home Improvement Loans E) Loans on Dwellings For 5+ Families F) Non-occupant Loans on Number Average Value Number Average Value Number Average Value Number Average Value Number Average Value Number Average Value
LOANS ORIGINATED 103 $81,019 126 $83,219 27 $110,059 37 $7,161 1 $548,470 11 $142,858 APPLICATIONS APPROVED, NOT ACCEPTED 10 $58,648 26 $63,304 18 $58,065 6 $15,725 0 $0 1 $54,480 APPLICATIONS DENIED 22 $68,833 79 $61,878 56 $46,989 39 $7,135 0 $0 7 $69,214 APPLICATIONS WITHDRAWN 13 $82,535 23 $79,544 25 $65,591 2 $11,035 0 $0 0 $0 FILES CLOSED FOR INCOMPLETENESS 2 $100,160 8 $58,915 64 $65,895 0 $0 0 $0 0 $0
Aggregated Statistics For Year 1999(Based on 1 full and 2 partial tracts) A) FHA, FSA/RHS & VA B) Conventional C) Refinancings D) Home Improvement Loans F) Non-occupant Loans on Number Average Value Number Average Value Number Average Value Number Average Value Number Average Value
LOANS ORIGINATED 155 $83,791 259 $106,583 171 $96,620 61 $13,821 25 $69,550 APPLICATIONS APPROVED, NOT ACCEPTED 2 $122,680 52 $60,026 17 $65,503 8 $29,958 2 $56,860 APPLICATIONS DENIED 17 $85,504 123 $54,593 65 $83,992 34 $13,426 5 $51,244 APPLICATIONS WITHDRAWN 12 $83,763 36 $116,840 84 $86,005 5 $49,758 0 $0 FILES CLOSED FOR INCOMPLETENESS 3 $99,433 7 $178,347 44 $76,639 0 $0 1 $103,180
Detailed HMDA statistics for the following Tracts:
0017.02
,
0017.05 ,
0017.08
Private Mortgage Insurance Companies Aggregated Statistics For Year 2009(Based on 2 full and 4 partial tracts) A) Conventional B) Refinancings C) Non-occupant Loans on Number Average Value Number Average Value Number Average Value
LOANS ORIGINATED 36 $218,818 15 $163,079 0 $0 APPLICATIONS APPROVED, NOT ACCEPTED 15 $173,845 9 $163,010 1 $242,790 APPLICATIONS DENIED 1 $126,720 10 $175,738 0 $0 APPLICATIONS WITHDRAWN 5 $159,526 2 $139,610 0 $0 FILES CLOSED FOR INCOMPLETENESS 2 $232,140 0 $0 0 $0
Aggregated Statistics For Year 2008(Based on 2 full and 4 partial tracts) A) Conventional B) Refinancings C) Non-occupant Loans on Number Average Value Number Average Value Number Average Value
LOANS ORIGINATED 160 $174,240 31 $170,675 8 $134,132 APPLICATIONS APPROVED, NOT ACCEPTED 62 $222,078 14 $155,100 1 $157,960 APPLICATIONS DENIED 28 $212,924 0 $0 0 $0 APPLICATIONS WITHDRAWN 4 $181,070 4 $147,800 0 $0 FILES CLOSED FOR INCOMPLETENESS 8 $142,911 0 $0 0 $0
Aggregated Statistics For Year 2007(Based on 2 full and 4 partial tracts) A) Conventional B) Refinancings C) Non-occupant Loans on Number Average Value Number Average Value Number Average Value
LOANS ORIGINATED 240 $164,312 39 $151,663 7 $119,253 APPLICATIONS APPROVED, NOT ACCEPTED 35 $159,285 4 $96,165 0 $0 APPLICATIONS DENIED 2 $212,040 0 $0 0 $0 APPLICATIONS WITHDRAWN 5 $177,424 2 $143,425 0 $0 FILES CLOSED FOR INCOMPLETENESS 0 $0 0 $0 0 $0
Aggregated Statistics For Year 2006(Based on 2 full and 4 partial tracts) A) Conventional B) Refinancings C) Non-occupant Loans on D) Loans On Manufactured Number Average Value Number Average Value Number Average Value Number Average Value
LOANS ORIGINATED 185 $160,029 23 $177,216 0 $0 1 $86,290 APPLICATIONS APPROVED, NOT ACCEPTED 33 $161,330 10 $104,487 3 $108,233 2 $59,830 APPLICATIONS DENIED 0 $0 0 $0 0 $0 0 $0 APPLICATIONS WITHDRAWN 8 $180,326 0 $0 0 $0 0 $0 FILES CLOSED FOR INCOMPLETENESS 0 $0 0 $0 0 $0 0 $0
Aggregated Statistics For Year 2005(Based on 2 full and 4 partial tracts) A) Conventional B) Refinancings C) Non-occupant Loans on Number Average Value Number Average Value Number Average Value
LOANS ORIGINATED 203 $153,787 42 $106,493 8 $150,258 APPLICATIONS APPROVED, NOT ACCEPTED 33 $125,369 17 $137,011 1 $109,690 APPLICATIONS DENIED 5 $169,100 2 $123,655 0 $0 APPLICATIONS WITHDRAWN 5 $103,646 4 $138,452 1 $109,690 FILES CLOSED FOR INCOMPLETENESS 0 $0 0 $0 0 $0
Aggregated Statistics For Year 2004(Based on 2 full and 4 partial tracts) A) Conventional B) Refinancings C) Non-occupant Loans on D) Loans On Manufactured Number Average Value Number Average Value Number Average Value Number Average Value
LOANS ORIGINATED 193 $154,801 77 $118,434 5 $101,018 0 $0 APPLICATIONS APPROVED, NOT ACCEPTED 40 $181,072 19 $129,257 2 $68,235 2 $199,440 APPLICATIONS DENIED 1 $127,250 0 $0 0 $0 0 $0 APPLICATIONS WITHDRAWN 8 $130,409 3 $127,093 1 $100,920 0 $0 FILES CLOSED FOR INCOMPLETENESS 0 $0 0 $0 0 $0 0 $0
Aggregated Statistics For Year 2003(Based on 2 full and 4 partial tracts) A) Conventional B) Refinancings C) Non-occupant Loans on Number Average Value Number Average Value Number Average Value
LOANS ORIGINATED 258 $134,601 153 $133,728 13 $86,137 APPLICATIONS APPROVED, NOT ACCEPTED 37 $116,967 35 $142,354 4 $65,485 APPLICATIONS DENIED 8 $114,959 4 $119,782 0 $0 APPLICATIONS WITHDRAWN 3 $231,420 11 $104,931 0 $0 FILES CLOSED FOR INCOMPLETENESS 5 $160,246 0 $0 0 $0
Aggregated Statistics For Year 2002(Based on 4 partial tracts) A) Conventional B) Refinancings C) Non-occupant Loans on Number Average Value Number Average Value Number Average Value
LOANS ORIGINATED 64 $104,590 34 $89,658 4 $70,915 APPLICATIONS APPROVED, NOT ACCEPTED 7 $119,127 6 $101,198 0 $0 APPLICATIONS DENIED 2 $100,800 1 $149,040 0 $0 APPLICATIONS WITHDRAWN 2 $109,160 1 $114,240 0 $0 FILES CLOSED FOR INCOMPLETENESS 1 $131,040 0 $0 0 $0
Aggregated Statistics For Year 2001(Based on 4 partial tracts) A) Conventional B) Refinancings C) Non-occupant Loans on Number Average Value Number Average Value Number Average Value
LOANS ORIGINATED 43 $103,780 20 $87,336 3 $80,363 APPLICATIONS APPROVED, NOT ACCEPTED 2 $107,640 3 $108,167 0 $0 APPLICATIONS DENIED 2 $124,200 0 $0 0 $0 APPLICATIONS WITHDRAWN 0 $0 1 $73,200 0 $0 FILES CLOSED FOR INCOMPLETENESS 2 $108,820 0 $0 0 $0
Aggregated Statistics For Year 2000(Based on 4 partial tracts) A) Conventional B) Refinancings C) Non-occupant Loans on Number Average Value Number Average Value Number Average Value
LOANS ORIGINATED 38 $89,448 8 $82,680 5 $79,890 APPLICATIONS APPROVED, NOT ACCEPTED 3 $84,737 1 $63,840 0 $0 APPLICATIONS DENIED 0 $0 1 $111,160 0 $0 APPLICATIONS WITHDRAWN 0 $0 0 $0 0 $0 FILES CLOSED FOR INCOMPLETENESS 3 $82,960 0 $0 0 $0
Aggregated Statistics For Year 1999(Based on 1 full and 2 partial tracts) A) Conventional B) Refinancings C) Non-occupant Loans on Number Average Value Number Average Value Number Average Value
LOANS ORIGINATED 83 $109,885 20 $106,197 1 $91,530 APPLICATIONS APPROVED, NOT ACCEPTED 7 $112,796 2 $94,735 0 $0 APPLICATIONS DENIED 6 $100,507 0 $0 0 $0 APPLICATIONS WITHDRAWN 2 $112,545 0 $0 0 $0 FILES CLOSED FOR INCOMPLETENESS 0 $0 0 $0 0 $0
Detailed PMIC statistics for the following Tracts:
0017.02
,
0017.05 ,
0017.08
2002 - 2018 National Fire Incident Reporting System (NFIRS) incidents See full 2006 National Fire Incident Reporting System statistics for zip code 78045, Texas
Most common first names in zip code 78045 among deceased individuals Name Count Lived (average)
Maria 47 76.2 years Jose 34 76.3 years Juan 13 63.6 years Guadalupe 13 77.7 years Jesus 11 68.7 years Robert 10 74.2 years Manuel 10 71.7 years Alicia 9 75.8 years Carlos 8 65.9 years Francisco 8 74.4 years
Most common last names in zip code 78045 among deceased individuals Last name Count Lived (average)
Martinez 32 71.3 years Rodriguez 24 72.8 years Garza 21 74.9 years Garcia 21 75.3 years Gonzalez 21 73.3 years Flores 14 73.5 years Gutierrez 11 70.3 years Sanchez 11 76.1 years Villarreal 11 74.0 years Perez 10 76.7 years
Businesses in zip code 78045
Name Count Name Count
Academy Sports + Outdoors 1 Jack In The Box 1 Advance Auto Parts 1 Lane Bryant 1 Applebee's 1 McDonald's 4 Arby's 1 Old Navy 1 Bed Bath & Beyond 1 Papa John's Pizza 1 Best Western 1 Payless 2 Blockbuster 1 Penske 1 Burger King 2 Pizza Hut 1 Carl\s Jr. 1 Popeyes 1 Chick-Fil-A 1 Quiznos 2 Church's Chicken 2 RadioShack 1 Dennys 1 SONIC Drive-In 1 FedEx 8 Skechers USA 1 GNC 1 T-Mobile 2 GameStop 2 T.J.Maxx 1 H&R Block 2 Target 1 Hilton 1 U-Haul 1 Hobby Lobby 1 UPS 10 IHOP 1 Wendy's 1

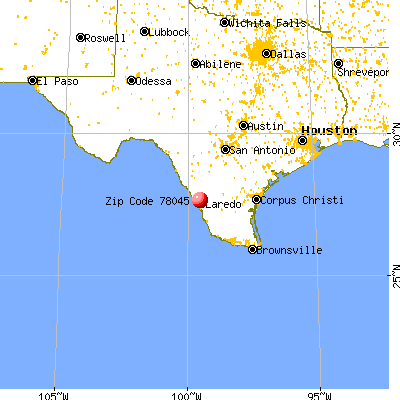


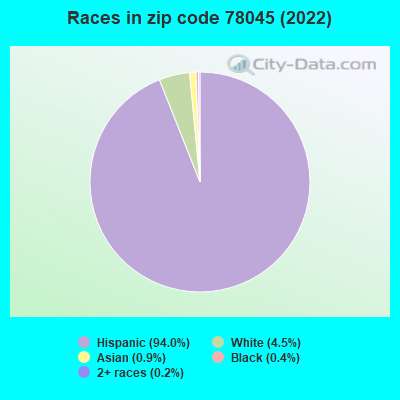


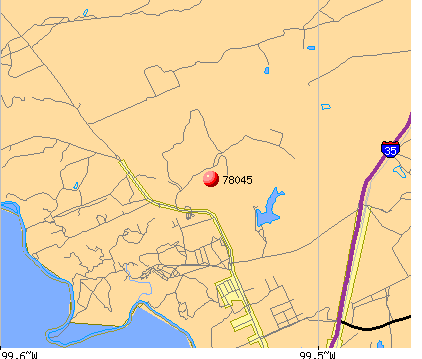 Nearest zip codes: 78019, 78041, 78040, 78836, 78043, 78044.
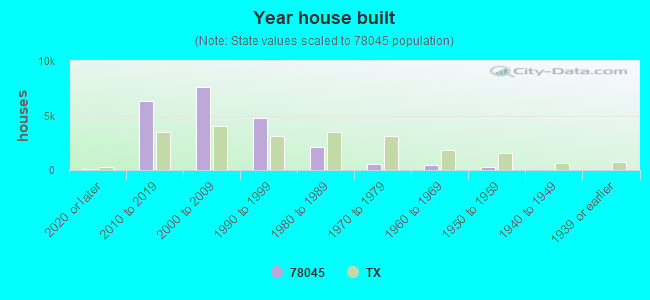

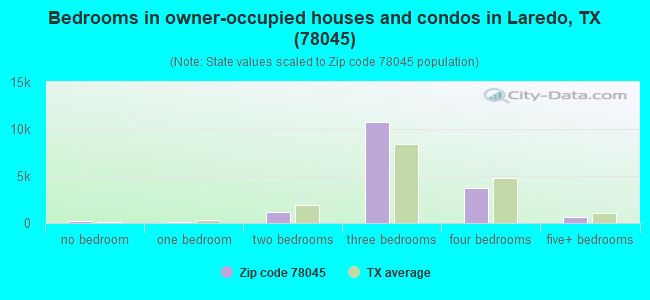
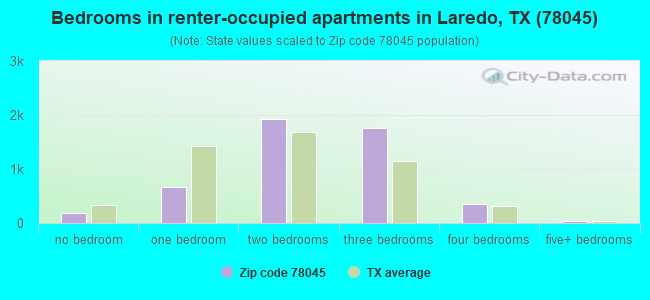
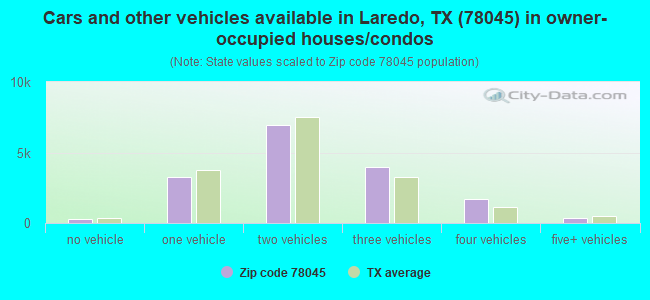
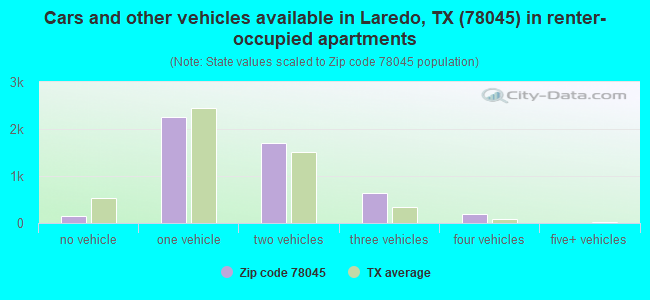


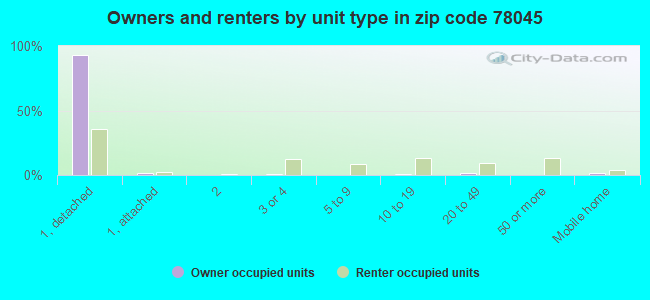
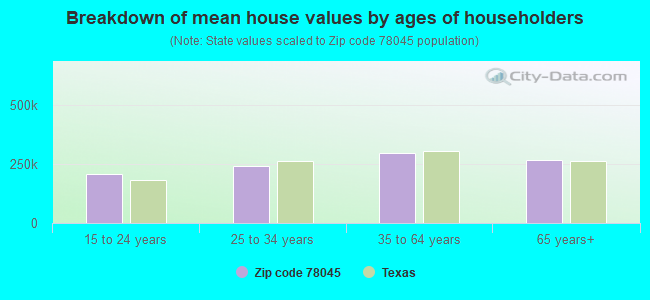


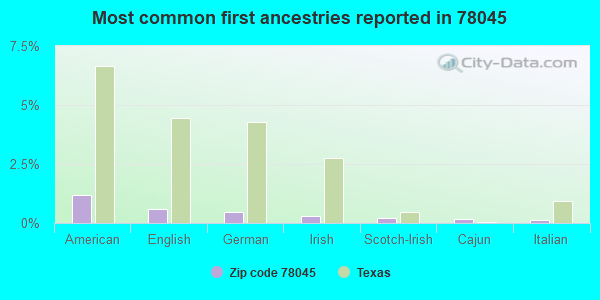
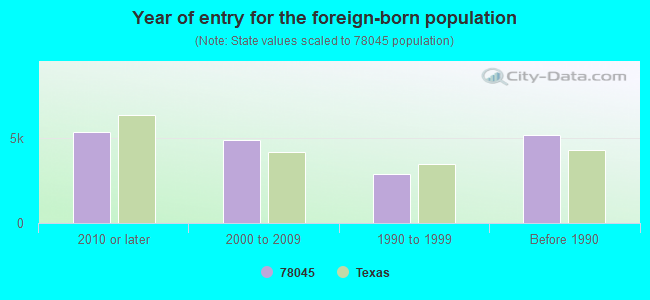


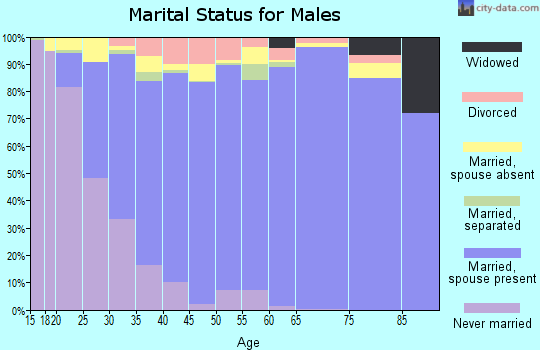
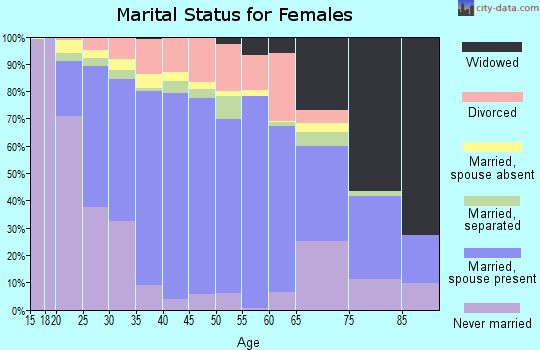
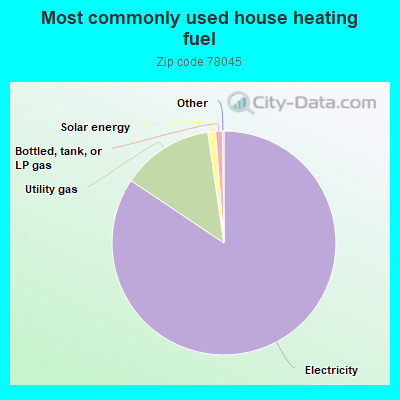
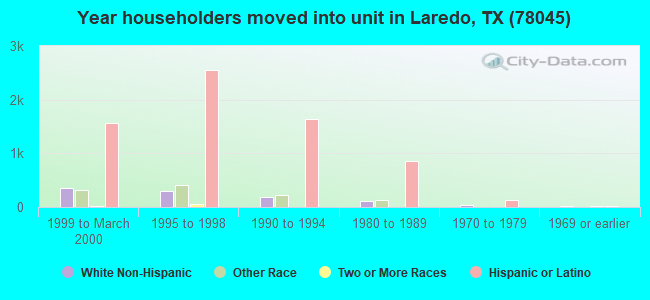
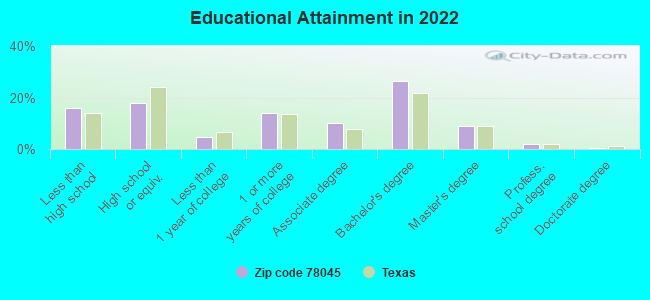


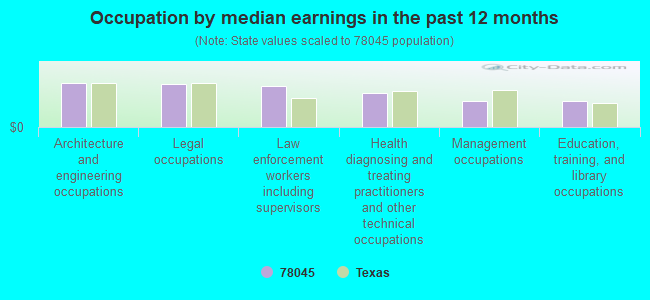
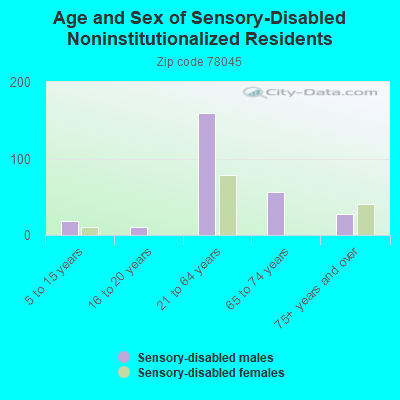
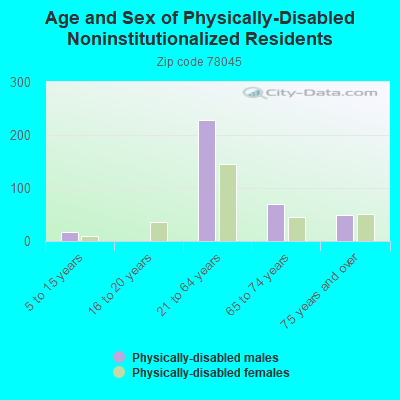
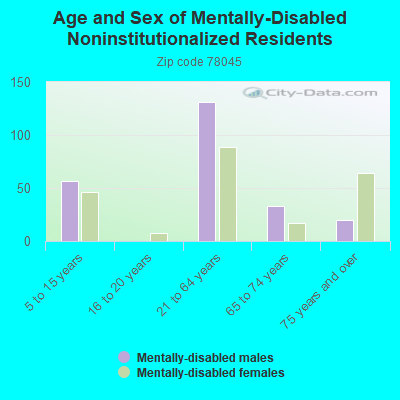
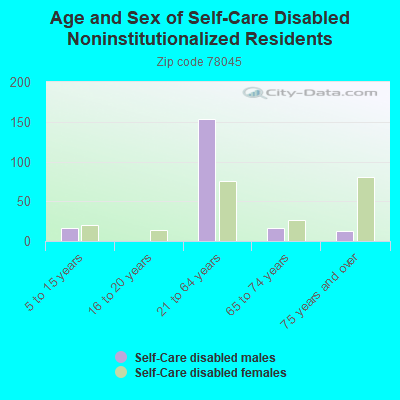
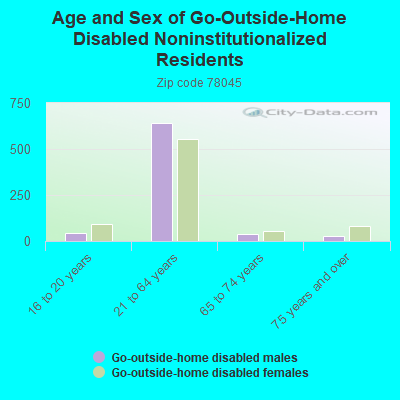
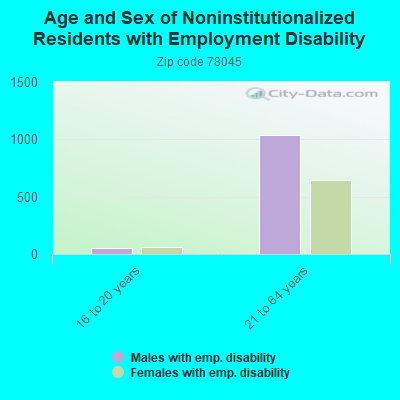
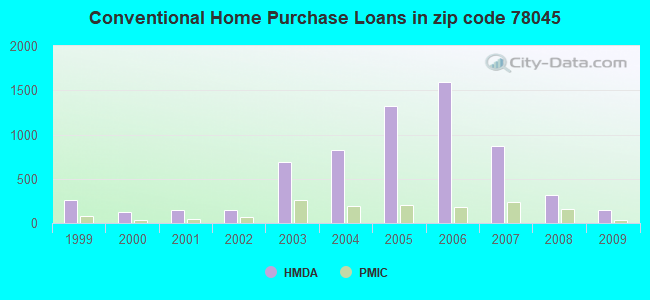
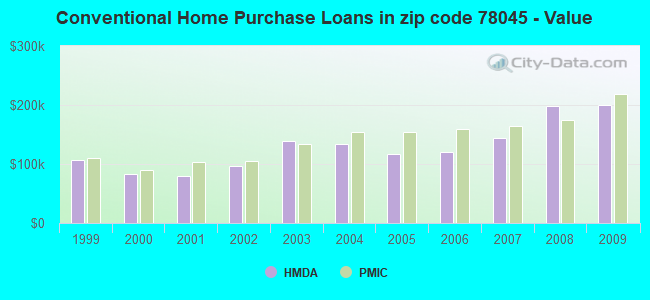
 Based on the data from the years 2002 - 2018 the average number of fire incidents per year is 152. The highest number of reported fire incidents - 226 took place in 2006, and the least - 92 in 2002. The data has a growing trend.
 When looking into fire subcategories, the most incidents belonged to: Outside Fires (57.5%), and Mobile Property/Vehicle Fires (25.7%).