Estimated zip code population in 2022: 7,145 Zip code population in 2010: 5,509 Zip code population in 2000: 1,113
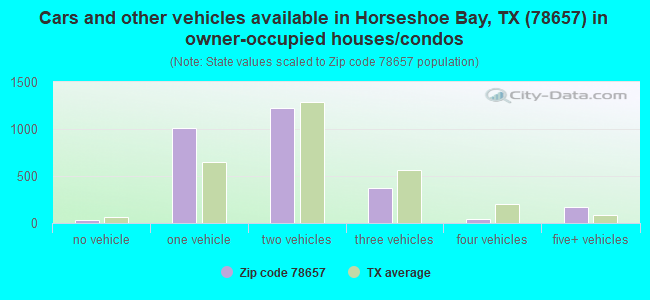
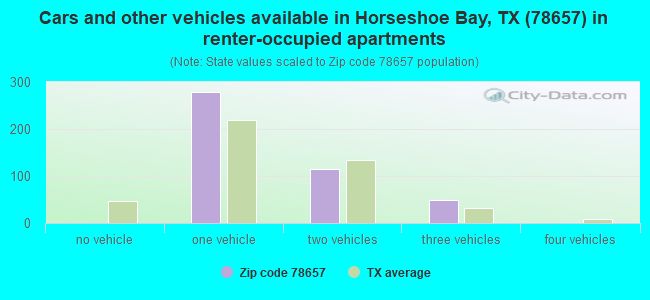
Houses and condos: 5,541 Renter-occupied apartments: 443
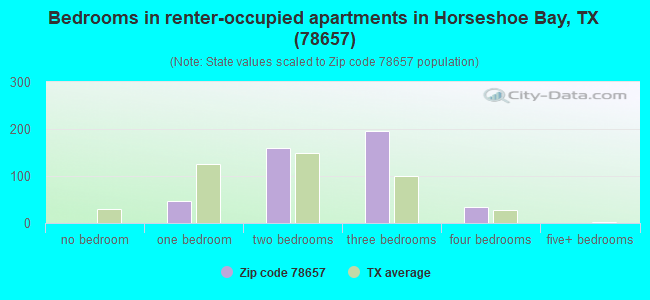
% of renters here:
14%
State:
38%
March 2022 cost of living index in zip code 78657: 88.3 (less than average, U.S. average is 100)
Land area: 39.5 sq. mi. Water area: 3.2 sq. mi.
Population density: 181 people per square mile
(very low).
OSM Map
General Map
Google Map
MSN Map
OSM Map
General Map
Google Map
MSN Map
OSM Map
General Map
Google Map
MSN Map
OSM Map
General Map
Google Map
MSN Map
Please wait while loading the map...
Real estate property taxes paid for housing units in 2022:
This zip code:
0.9% ($4,076)
Texas:
1.5% ($4,050)
Median real estate property taxes paid for housing units with mortgages in 2022: $4,142 (0.9%) Median real estate property taxes paid for housing units with no mortgage in 2022: $4,123 (0.9%)
Estimated median house/condo value in 2022: $473,619
78657:
$473,619
Texas:
$275,400
According to our research of Texas and other state lists, there were 5 registered sex offenders living in 78657 zip code as of May 13, 2024. The ratio of all residents to sex offenders in zip code 78657 is 1,091 to 1. The ratio of registered sex offenders to all residents in this zip code is much lower than the state average.
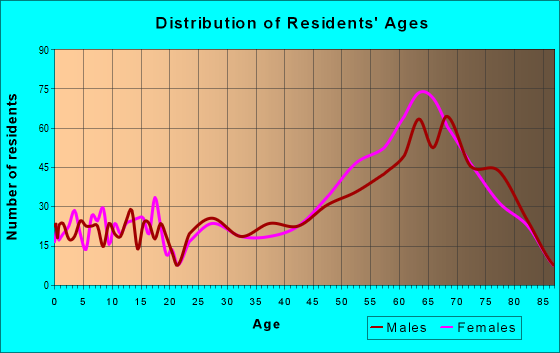
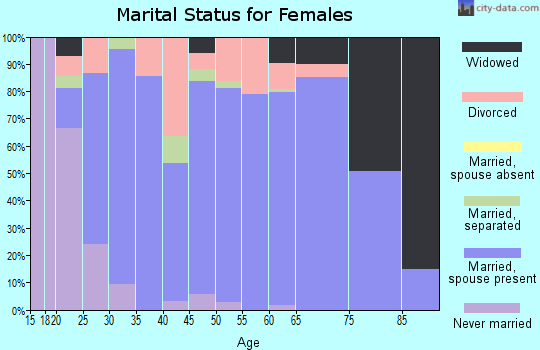
Median resident age:
This zip code:
60.5 years
Texas median age:
35.6 years
Average household size:
This zip code:
2.2 people
Texas:
2.6 people
Averages for the 2020 tax year for zip code 78657, filed in 2021:
Average Adjusted Gross Income (AGI) in 2020: $182,987 (Individual Income Tax Returns)
Here:
$182,987
State:
$77,054
Salary/wage: $101,299 (reported on 60.6% of returns)
Here:
$101,299
State:
$62,766
(% of AGI for various income ranges: 1089.5% for AGIs below $25k, 3287.8% for AGIs $25k-50k, 5376.1% for AGIs $50k-75k, 7838.8% for AGIs $75k-100k, 12994.8% for AGIs $100k-200k, 135670.0% for AGIs over 200k)
Taxable interest for individuals: $6,627 (reported on 51.6% of returns)
This zip code:
$6,627
Texas:
$2,665
(% of AGI for various income ranges: 40.7% for AGIs below $25k, 94.3% for AGIs $25k-50k, 152.6% for AGIs $50k-75k, 240.6% for AGIs $75k-100k, 551.9% for AGIs $100k-200k, 9177.0% for AGIs over 200k)
Ordinary dividends: $51,700 (reported on 40.5% of returns)
Here:
$51,700
State:
$10,044
(% of AGI for various income ranges: 111.8% for AGIs below $25k, 213.3% for AGIs $25k-50k, 548.3% for AGIs $50k-75k, 993.8% for AGIs $75k-100k, 2346.7% for AGIs $100k-200k, 63148.0% for AGIs over 200k)
Net capital gain/loss in AGI: +$91,973 (reported on 40.2% of returns)
Here:
+$91,973
State:
+$39,590
(% of AGI for various income ranges: 26.7% for AGIs below $25k, 113.0% for AGIs $25k-50k, 166.1% for AGIs $50k-75k, 617.5% for AGIs $75k-100k, 2475.9% for AGIs $100k-200k, 121879.0% for AGIs over 200k)
Profit/loss from business: +$25,788 (reported on 23.2% of returns)
Here:
+$25,788
State:
+$10,888
(% of AGI for various income ranges: 259.6% for AGIs below $25k, 291.3% for AGIs $25k-50k, 444.3% for AGIs $50k-75k, 340.0% for AGIs $75k-100k, 1830.7% for AGIs $100k-200k, 11869.0% for AGIs over 200k)
Taxable individual retirement arrangement distribution: $45,103 (reported on 22.1% of returns)
78657:
$45,103
Texas:
$24,740
(% of AGI for various income ranges: 110.5% for AGIs below $25k, 237.6% for AGIs $25k-50k, 734.3% for AGIs $50k-75k, 1444.4% for AGIs $75k-100k, 4255.6% for AGIs $100k-200k, 17989.0% for AGIs over 200k)
Self-employed (Keogh) retirement plans: $43,125 (reported on 1.1% of returns)
78657:
$43,125
Texas:
$29,298
(% of AGI for various income ranges: 1725.0% for AGIs over 200k)
Total itemized deductions: $50,835 (reported on 17.8% of returns)
Here:
$50,835
State:
$40,428
(% of AGI for various income ranges: 144.7% for AGIs below $25k, 314.3% for AGIs $25k-50k, 901.3% for AGIs $50k-75k, 741.2% for AGIs $75k-100k, 2440.4% for AGIs $100k-200k, 19936.0% for AGIs over 200k)
Charity contributions: $23,279 (reported on 15.9% of returns)
Here:
$23,279
State:
$18,201
(% of AGI for various income ranges: 12.2% for AGIs below $25k, 36.1% for AGIs $25k-50k, 121.3% for AGIs $50k-75k, 149.4% for AGIs $75k-100k, 736.7% for AGIs $100k-200k, 10296.0% for AGIs over 200k)
Taxes paid: $8,283 (reported on 17.8% of returns)
78657:
$8,283
State:
$7,821
(% of AGI for various income ranges: 32.4% for AGIs below $25k, 47.8% for AGIs $25k-50k, 131.7% for AGIs $50k-75k, 156.2% for AGIs $75k-100k, 568.1% for AGIs $100k-200k, 2733.0% for AGIs over 200k)
Earned income credit: $2,262 (reported on 9.6% of returns)
Here:
$2,262
State:
$2,584
(% of AGI for various income ranges: 80.2% for AGIs below $25k, 71.3% for AGIs $25k-50k)
Percentage of individuals using paid preparers for their 2020 taxes: 90.4%
Here:
90%
State:
92%
(% for various income ranges: 89.8% for AGIs below $25k, 90.0% for AGIs $25k-50k, 92.3% for AGIs $50k-75k, 90.3% for AGIs $75k-100k, 89.7% for AGIs $100k-200k, 91.2% for AGIs over 200k)
Averages for the 2012 tax year for zip code 78657, filed in 2013:
Average Adjusted Gross Income (AGI) in 2012: $158,853 (Individual Income Tax Returns)
Here:
$158,853
State:
$65,384
Salary/wage: $67,515 (reported on 61.5% of returns)
Here:
$67,515
State:
$52,524
(% of AGI for various income ranges: 62.2% for AGIs below $25k, 60.2% for AGIs $25k-50k, 46.9% for AGIs $50k-75k, 42.0% for AGIs $75k-100k, 34.1% for AGIs $100k-200k, 18.4% for AGIs over 200k)
Taxable interest for individuals: $6,853 (reported on 50.2% of returns)
This zip code:
$6,853
Texas:
$2,372
(% of AGI for various income ranges: 4.2% for AGIs below $25k, 1.7% for AGIs $25k-50k, 2.1% for AGIs $50k-75k, 3.2% for AGIs $75k-100k, 2.0% for AGIs $100k-200k, 2.1% for AGIs over 200k)
Ordinary dividends: $40,928 (reported on 39.2% of returns)
Here:
$40,928
State:
$9,721
(% of AGI for various income ranges: 4.8% for AGIs below $25k, 5.1% for AGIs $25k-50k, 4.8% for AGIs $50k-75k, 7.3% for AGIs $75k-100k, 5.6% for AGIs $100k-200k, 12.1% for AGIs over 200k)
Net capital gain/loss in AGI: +$88,671 (reported on 37.7% of returns)
Here:
+$88,671
State:
+$35,319
(% of AGI for various income ranges: 0.7% for AGIs $25k-50k, 1.3% for AGIs $50k-75k, 1.3% for AGIs $75k-100k, 4.5% for AGIs $100k-200k, 29.4% for AGIs over 200k)
Profit/loss from business: +$18,597 (reported on 23.4% of returns)
Here:
+$18,597
State:
+$13,732
(% of AGI for various income ranges: 11.3% for AGIs below $25k, 7.8% for AGIs $25k-50k, 5.0% for AGIs $50k-75k, 1.9% for AGIs $75k-100k, 5.6% for AGIs $100k-200k, 1.4% for AGIs over 200k)
Taxable individual retirement arrangement distribution: $38,181 (reported on 25.3% of returns)
78657:
$38,181
Texas:
$19,511
(% of AGI for various income ranges: 7.6% for AGIs below $25k, 6.0% for AGIs $25k-50k, 7.4% for AGIs $50k-75k, 10.2% for AGIs $75k-100k, 13.6% for AGIs $100k-200k, 4.1% for AGIs over 200k)
Self-employment retirement plans: $27,175 (reported on 1.5% of returns)
78657:
$27,175
Texas:
$23,938
Total itemized deductions: $38,909 (13% of AGI, reported on 44.0% of returns)
Here:
$38,909
State:
$24,724
Here:
12.8% of AGI
State:
15.9% of AGI
(% of AGI for various income ranges: 21.0% for AGIs below $25k, 15.9% for AGIs $25k-50k, 16.4% for AGIs $50k-75k, 17.4% for AGIs $75k-100k, 17.1% for AGIs $100k-200k, 7.9% for AGIs over 200k)
Charity contributions: $9,642 (reported on 37.4% of returns)
Here:
$9,642
State:
$6,808
(% of AGI for various income ranges: 1.4% for AGIs below $25k, 2.2% for AGIs $25k-50k, 1.6% for AGIs $50k-75k, 2.3% for AGIs $75k-100k, 3.2% for AGIs $100k-200k, 2.2% for AGIs over 200k)
Taxes paid: $13,356 (reported on 43.2% of returns)
78657:
$13,356
State:
$6,921
(% of AGI for various income ranges: 5.2% for AGIs below $25k, 4.6% for AGIs $25k-50k, 3.9% for AGIs $50k-75k, 5.3% for AGIs $75k-100k, 5.7% for AGIs $100k-200k, 2.9% for AGIs over 200k)
Earned income credit: $2,374 (reported on 13.9% of returns)
Here:
$2,374
State:
$2,570
(% of AGI for various income ranges: 6.4% for AGIs below $25k, 1.1% for AGIs $25k-50k)
Percentage of individuals using paid preparers for their 2012 taxes: 57.5%
Here:
58%
State:
51%
(% for various income ranges: 48.2% for AGIs below $25k, 48.1% for AGIs $25k-50k, 57.6% for AGIs $50k-75k, 57.7% for AGIs $75k-100k, 68.2% for AGIs $100k-200k, 81.8% for AGIs over 200k)
Averages for the 2004 tax year for zip code 78657, filed in 2005:
Average Adjusted Gross Income (AGI) in 2004: $87,786 (Individual Income Tax Returns)
Here:
$87,786
State:
$47,881
Salary/wage: $54,726 (reported on 57.8% of returns)
Here:
$54,726
State:
$41,947
(% of AGI for various income ranges: 57.4% for AGIs $10k-25k, 56.2% for AGIs $25k-50k, 37.0% for AGIs $50k-75k, 37.2% for AGIs $75k-100k, 30.1% for AGIs over 100k)
Taxable interest for individuals: $5,483 (reported on 64.2% of returns)
This zip code:
$5,483
Texas:
$2,255
(% of AGI for various income ranges: 5.3% for AGIs $10k-25k, 4.1% for AGIs $25k-50k, 5.0% for AGIs $50k-75k, 2.9% for AGIs $75k-100k, 3.4% for AGIs over 100k)
Taxable dividends: $13,511 (reported on 47.1% of returns)
Here:
$13,511
State:
$4,261
(% of AGI for various income ranges: 4.4% for AGIs $10k-25k, 4.3% for AGIs $25k-50k, 4.5% for AGIs $50k-75k, 6.0% for AGIs $75k-100k, 7.8% for AGIs over 100k)
Net capital gain/loss: +$37,977 (reported on 46.0% of returns)
Here:
+$37,977
State:
+$16,110
(% of AGI for various income ranges: -0.8% for AGIs $10k-25k, 0.9% for AGIs $25k-50k, 2.5% for AGIs $50k-75k, 3.3% for AGIs $75k-100k, 26.8% for AGIs over 100k)
Profit/loss from business: +$20,917 (reported on 26.2% of returns)
Here:
+$20,917
State:
+$11,013
(% of AGI for various income ranges: 9.5% for AGIs $10k-25k, 6.2% for AGIs $25k-50k, 2.8% for AGIs $50k-75k, 4.3% for AGIs $75k-100k, 6.3% for AGIs over 100k)
Profit/loss from farming: +$4,500 (reported on 2.7% of returns)
Here:
+$4,500
State:
-$9,403
IRA payment deduction: $3,753 (reported on 3.2% of returns)
78657:
$3,753
Texas:
$3,120
(% of AGI for various income ranges: 0.2% for AGIs $25k-50k, 0.4% for AGIs $50k-75k, 0.1% for AGIs over 100k)
Self-employed pension: $19,031 (reported on 1.4% of returns)
Here:
$19,031
Texas:
$16,401
Total itemized deductions: $27,307 (19% of AGI, reported on 45.9% of returns)
Here:
$27,307
State:
$19,631
Here:
19.0% of AGI
State:
18.9% of AGI
(% of AGI for various income ranges: 24.5% for AGIs $10k-25k, 18.0% for AGIs $25k-50k, 17.6% for AGIs $50k-75k, 19.1% for AGIs $75k-100k, 11.2% for AGIs over 100k)
Charity contributions deductions: $6,027 (4% of AGI, reported on 39.9% of returns)
Here:
$6,027
State:
$4,753
Here:
3.8% of AGI
State:
4.2% of AGI
(% of AGI for various income ranges: 2.4% for AGIs $10k-25k, 2.1% for AGIs $25k-50k, 2.0% for AGIs $50k-75k, 2.5% for AGIs $75k-100k, 2.8% for AGIs over 100k)
Total tax: $18,251 (reported on 80.0% of returns)
78657:
$18,251
State:
$9,058
(% of AGI for various income ranges: 4.3% for AGIs $10k-25k, 7.2% for AGIs $25k-50k, 9.5% for AGIs $50k-75k, 10.8% for AGIs $75k-100k, 19.5% for AGIs over 100k)
Earned income credit: $1,782 (reported on 10.5% of returns)
Here:
$1,782
State:
$2,024
Percentage of individuals using paid preparers for their 2004 taxes: 64.8%
Here:
65%
State:
57%
(% for various income ranges: 60.5% for AGIs below $10k, 61.7% for AGIs $10k-25k, 62.1% for AGIs $25k-50k, 64.4% for AGIs $50k-75k, 56.9% for AGIs $75k-100k, 77.5% for AGIs over 100k)
Household received Food Stamps/SNAP in the past 12 months: 124 Household did not receive Food Stamps/SNAP in the past 12 months: 3,128
Women who had a birth in the past 12 months: 6 (0 now married, 5 unmarried) Women who did not have a birth in the past 12 months: 1,091 (451 now married, 640 unmarried)
Housing units in zip code 78657 with a mortgage: 1,194 (49 second mortgage, 50 both second mortgage and home equity loan) Median monthly owner costs for units with a mortgage: $1,877 Median monthly owner costs for units without a mortgage: $827
Residents with income below the poverty level in 2022:
This zip code:
4.9%
Whole state:
14.0%
Residents with income below 50% of the poverty level in 2022:
This zip code:
3.2%
Whole state:
7.4%
Median number of rooms in houses and condos:
Here:
6.3
State:
6.3
Median number of rooms in apartments:
Here:
4.9
State:
4.0
Notable locations in this zip code not listed on our city pages
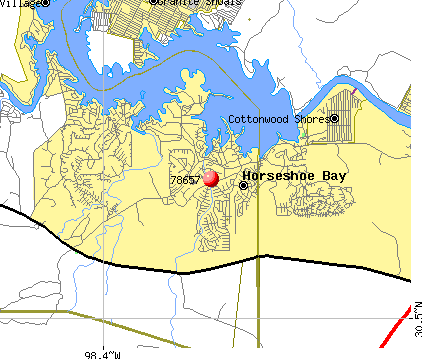
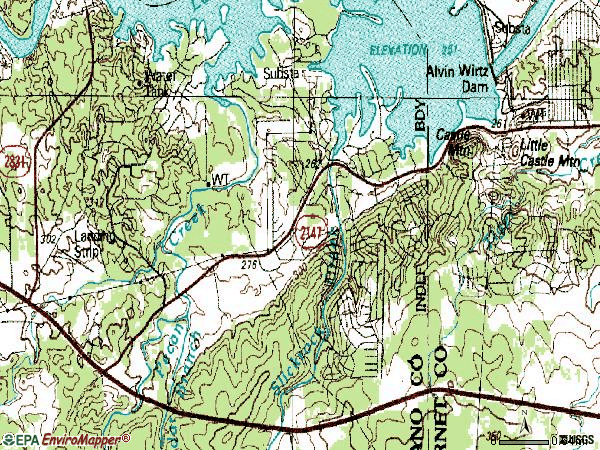
Notable locations in zip code 78657: Horseshoe Bay Fire Department Station 3 (A), Cottonwood Shores Area Volunteer Fire Department (B), Blue Lake Subdivision Fire Station (C), Sandy Harbor Subdivision Fire Station (D), Horseshoe Bay Fire Department Station 2 (E), Cottonwood Shores Community Center (F), Llano County Courthouse (G), Horseshoe Bay Police Station (H), Horseshoe Bay Fire Department Station 1 (I). Display/hide their locations on the map
Streams, rivers, and creeks: Varnhagan Creek (A), Walnut Creek (B), Slickrock Creek (C), Tiger Creek (D), Cedar Branch (E), Pecan Creek (F), Horseshoe Creek (G), Dry Branch (H). Display/hide their locations on the map
Size of family households: 1,528 2-persons, 219 3-persons, 182 4-persons, 144 5-persons, 30 6-persons, 76 7-or-more-persons
Size of nonfamily households: 1,059 1-person, 36 2-persons, 9 3-persons
602 married couples with children.
134 single-parent households (37 men, 97 women).
85.2% of residents of 78657 zip code speak English at home.
14.9% of residents speak Spanish at home (60% very well, 4% well, 25% not well, 10% not at all).
0.5% of residents speak other Indo-European language at home (100% very well).
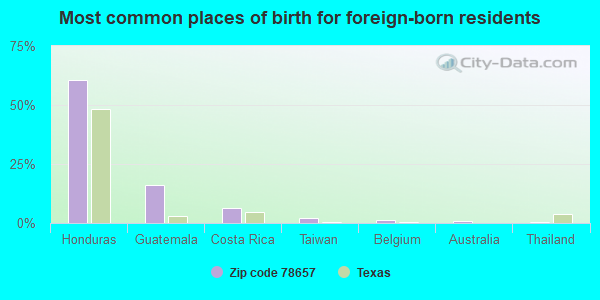
Foreign born population: 837 (11.7%) (26.4% of them are naturalized citizens)
This zip code:
11.7%
Whole state:
17.2%
61%Honduras
16%Guatemala
6%Costa Rica
2%Taiwan
1%Belgium
1%Australia
1%Thailand
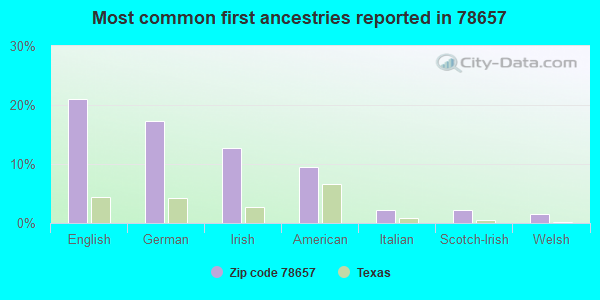
21%English
17%German
13%Irish
9%American
2%Italian
2%Scotch-Irish
2%Welsh
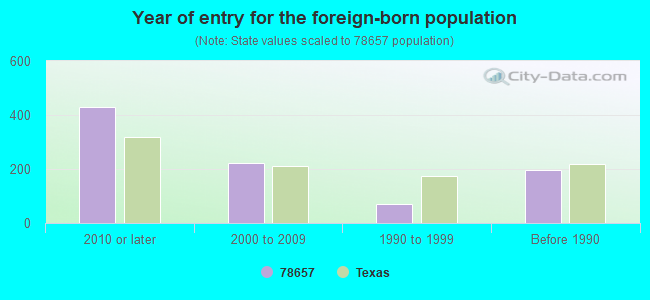
Year of entry for the foreign-born population
4292010 or later
2222000 to 2009
721990 to 1999
197Before 1990
Housing units lacking complete plumbing facilities: 1.2% Housing units lacking complete kitchen facilities: 0.4%
91.9%Electricity
3.4%Utility gas
2.9%Bottled, tank, or LP gas
1.4%No fuel used
Place of birth for U.S.-born residents:
This state: 3,805
Northeast: 367
Midwest: 771
South: 750
West: 570
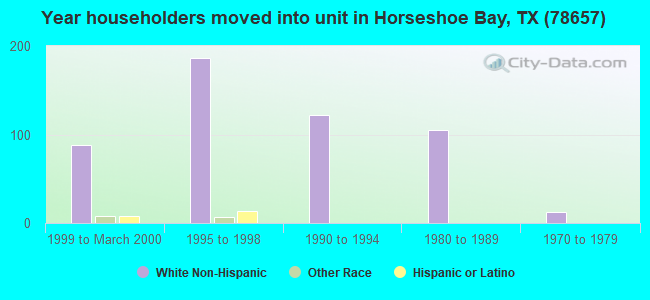
51% of the 78657 zip code residents lived in the same house 5 years ago. Out of people who lived in different houses, 17% lived in this county. Out of people who lived in different counties, 50% lived in Texas.
87% of the 78657 zip code residents lived in the same house 1 year ago. Out of people who lived in different houses, 23% moved from this county. Out of people who lived in different houses, 72% moved from different county within same state. Out of people who lived in different houses, 6% moved from different state.
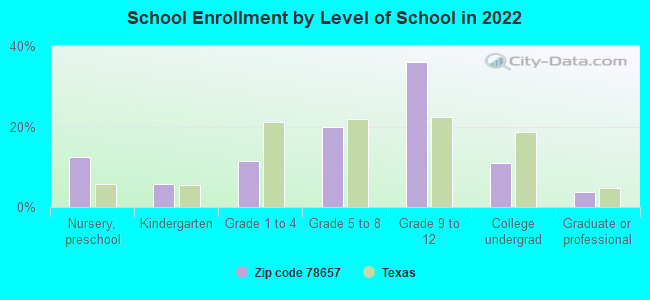
Private vs. public school enrollment:
Students in private schools in grades 1 to 8 (elementary and middle school): 43
Here:
14.7%
Texas:
8.8%
Students in private schools in grades 9 to 12 (high school): 60
Here:
17.9%
Texas:
8.0%
Students in private undergraduate colleges: 14
Here:
14.3%
Texas:
16.2%
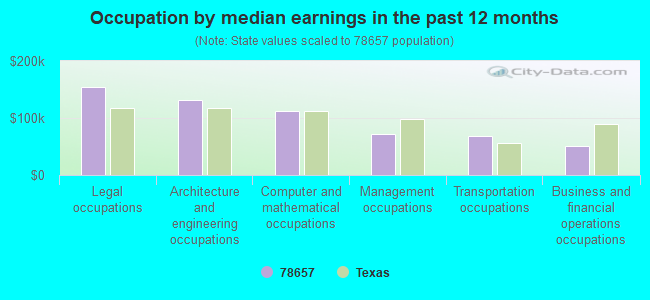
Occupation by median earnings in the past 12 months ($)
154,841Legal occupations
131,935Architecture and engineering occupations
112,049Computer and mathematical occupations
71,139Management occupations
68,190Transportation occupations
50,432Business and financial operations occupations
Companies with federal contracts located in this zip code:
CANTER ASSOCIATES, INC (810 WESTERN BIT in HORSESHOE BAY, TX; small business) : $1,849,399 in 54 contractsfrom 2000 to 2006
Contracts for Other Education and Training Services, Education Services, Training/Curriculum Development, ADP Software, Equipment, and Telecommunications Training, and moreby U.S. Army Corps of Engineers - civil program financing only, Army, National Oceanic and Atmospheric Administration/Under Secretary for Oceans and Atmosphere Signed by year:2000: $74,778; 2001: $110,000; 2002: $354,455; 2003: $418,984; 2004: $160,450; 2005: $726,782; 2006: $3,950.
Biggest contracts:
$147,400 with U.S. Army Corps of Engineers - civil program financing only for Other Education and Training Services. Signed on 2005-04-29. Completion date: 2005-09-30.
$147,400 with Army for Other Education and Training Services. Signed on 2005-04-29. Completion date: 2005-09-30.
$139,028 with U.S. Army Corps of Engineers - civil program financing only for Education Services. Taking place in AL. Signed on 2002-09-11. Completion date: 2002-06-28.
$116,427, same as above.Signed on 2002-03-01. Completion date: 2002-06-28.
R R M INC (522 LONG BRANCH RD in HORSESHOE BAY, TX; small business) : $578,700 in 13 contractsfrom 2003 to 2006
Contracts for Educational Services by Army Signed by year:2000: $0; 2001: $0; 2002: $0; 2003: $140,500; 2004: $165,500; 2005: $180,100; 2006: $92,600.
Biggest contracts:
$98,000 with Army for Educational Services. Taking place in IA. Signed on 2005-10-01. Completion date: 2006-09-30.
$92,600, same as above.Signed on 2006-01-27. Completion date: 2006-09-30.
$70,000 with Army for Educational Services. Taking place in WI. Signed on 2004-10-19. Completion date: 2005-09-30.
$55,500 with Army for Educational Services. Taking place in IA. Signed on 2004-11-17. Completion date: 2005-08-05.
HIGH CIRCLE NORTH LESSE (200 HI CIR N in MARBLE FALLS, TX) : $23,246 in 3 contractsfrom 2005 to 2006
$20,760 with Army for Lodging - Hotel/Motel. Signed on 2005-11-08. Completion date: 2005-11-17.
$2,486, same as above.Signed on 2005-12-22. Completion date: 2005-11-17.
$0, same as above.Signed on 2006-05-01. Effective on 2006-04-28. Completion date: 2005-11-17.
Top industries in this zip code by the number of employees in 2005:
Accommodation and Food Services: Hotels (except Casino Hotels) and Motels (250-499 employees: 1 establishment, 100-249 employees: 1 establishment)
Other Services (except Public Administration): Civic and Social Organizations (20-49: 1, 5-9: 1, 1-4: 1)
Finance and Insurance: Commercial Banking (10-19: 1)
Accommodation and Food Services: Limited-Service Restaurants (10-19: 1)
Wholesale Trade: Other Miscellaneous Durable Goods Merchant Wholesalers (10-19: 1)
Other Services (except Public Administration): Parking Lots and Garages (10-19: 1)
Professional, Scientific, and Technical Services: Title Abstract and Settlement Offices (5-9: 2)
Administrative and Support and Waste Management and Remediation Services: Office Administrative Services (5-9: 1, 1-4: 2)
Fatal accident statistics in 2013:
Fatal accident count: 1
Vehicles involved in fatal accidents: 2
Fatal accidents caused by drunken drivers: 0
Fatalities: 1
Persons involved in fatal accidents: 4
Pedestrians involved in fatal accidents: 0
Fatal accident statistics in 2011:
Fatal accident count: 1
Vehicles involved in fatal accidents: 1
Fatal accidents caused by drunken drivers: 0
Fatalities: 1
Persons involved in fatal accidents: 1
Pedestrians involved in fatal accidents: 0
2002 - 2018 National Fire Incident Reporting System (NFIRS) incidents
Based on the data from the years 2002 - 2018 the average number of fire incidents per year is 31. The highest number of reported fire incidents - 59 took place in 2018, and the least - 14 in 2014. The data has an increasing trend.
When looking into fire subcategories, the most reports belonged to: Outside Fires (54.6%), and Structure Fires (27.8%).
Fire incident types reported to NFIRS in Zip Code 78657


+$4,500
-$9,403
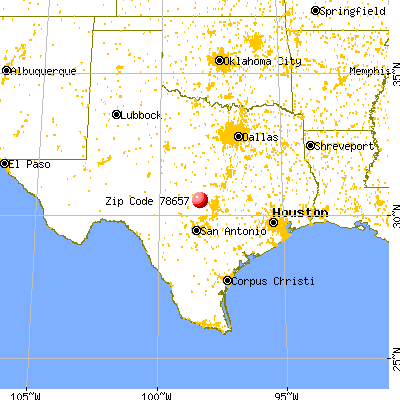
 Nearest zip codes: 78663, 78639, 78654, 78636, 78609, 78669.


 : $1,849,399 in 54 contracts from 2000 to 2006

 Based on the data from the years 2002 - 2018 the average number of fire incidents per year is 31. The highest number of reported fire incidents - 59 took place in 2018, and the least - 14 in 2014. The data has an increasing trend.
 When looking into fire subcategories, the most reports belonged to: Outside Fires (54.6%), and Structure Fires (27.8%).