Estimated zip code population in 2022: 5,654 Zip code population in 2010: 5,369 Zip code population in 2000: 4,795
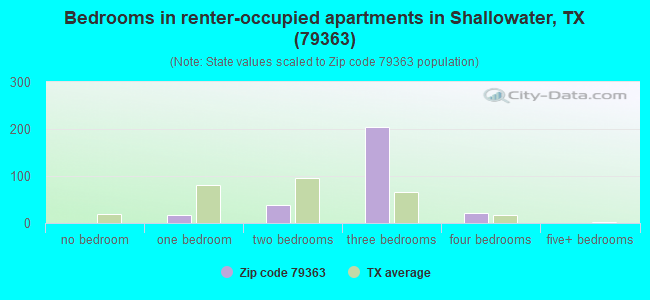
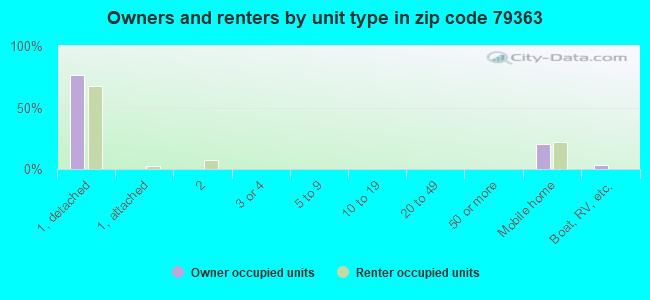
Houses and condos: 2,320 Renter-occupied apartments: 289
% of renters here:
13%
State:
38%
March 2022 cost of living index in zip code 79363: 83.8 (less than average, U.S. average is 100)
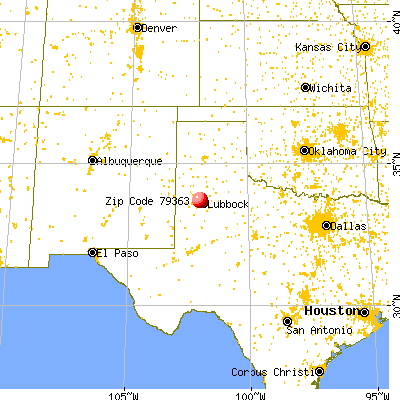
Land area: 115.7 sq. mi. Water area: 0.5 sq. mi.
Population density: 49 people per square mile
(very low).
OSM Map
General Map
Google Map
MSN Map
OSM Map
General Map
Google Map
MSN Map
OSM Map
General Map
Google Map
MSN Map
OSM Map
General Map
Google Map
MSN Map
Please wait while loading the map...
Real estate property taxes paid for housing units in 2022:
This zip code:
1.4% ($3,124)
Texas:
1.5% ($4,050)
Median real estate property taxes paid for housing units with mortgages in 2022: $4,356 (1.6%) Median real estate property taxes paid for housing units with no mortgage in 2022: $1,436 (1.3%)
Business Search- 14 Million verified businesses
Males: 2,873
(50.8%)
Females: 2,780
(49.2%)
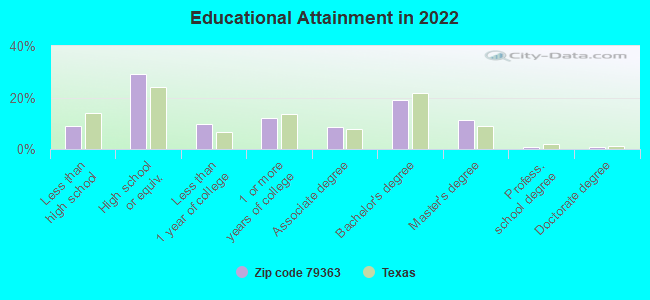
For population 25 years and over in 79363:
High school or higher: 90.9%
Bachelor's degree or higher: 31.7%
Graduate or professional degree: 12.6%
Unemployed: 3.9%
Mean travel time to work (commute): 22.1 minutes
For population 15 years and over in 79363:
Never married: 21.3%
Now married: 61.8%
Separated: 0.7%
Widowed: 6.6%
Divorced: 9.5%
Zip code 79363 compared to state average:
Black race population percentage significantly below state average.
Median age above state average.
Foreign-born population percentage significantly below state average.
Renting percentage significantly below state average.
Averages for the 2020 tax year for zip code 79363, filed in 2021:
Average Adjusted Gross Income (AGI) in 2020: $75,140 (Individual Income Tax Returns)
Here:
$75,140
State:
$77,054
Salary/wage: $63,610 (reported on 85.7% of returns)
Here:
$63,610
State:
$62,766
(% of AGI for various income ranges: 1227.4% for AGIs below $25k, 3552.9% for AGIs $25k-50k, 6452.6% for AGIs $50k-75k, 10358.9% for AGIs $75k-100k, 19290.0% for AGIs $100k-200k, 54216.7% for AGIs over 200k)
Taxable interest for individuals: $1,044 (reported on 28.3% of returns)
This zip code:
$1,044
Texas:
$2,665
(% of AGI for various income ranges: 14.3% for AGIs below $25k, 24.2% for AGIs $25k-50k, 26.7% for AGIs $50k-75k, 47.4% for AGIs $75k-100k, 93.8% for AGIs $100k-200k, 286.7% for AGIs over 200k)
Ordinary dividends: $3,400 (reported on 11.8% of returns)
Here:
$3,400
State:
$10,044
(% of AGI for various income ranges: 4.9% for AGIs below $25k, 11.5% for AGIs $25k-50k, 51.5% for AGIs $50k-75k, 28.4% for AGIs $75k-100k, 134.5% for AGIs $100k-200k, 745.0% for AGIs over 200k)
Net capital gain/loss in AGI: +$18,238 (reported on 13.3% of returns)
Here:
+$18,238
State:
+$39,590
(% of AGI for various income ranges: 4.6% for AGIs below $25k, 38.3% for AGIs $25k-50k, 103.7% for AGIs $50k-75k, 146.8% for AGIs $75k-100k, 313.1% for AGIs $100k-200k, 8420.0% for AGIs over 200k)
Profit/loss from business: +$11,683 (reported on 19.0% of returns)
Here:
+$11,683
State:
+$10,888
(% of AGI for various income ranges: 87.5% for AGIs below $25k, 160.0% for AGIs $25k-50k, 132.6% for AGIs $50k-75k, 441.6% for AGIs $75k-100k, 410.3% for AGIs $100k-200k, 4006.7% for AGIs over 200k)
Taxable individual retirement arrangement distribution: $15,221 (reported on 6.8% of returns)
79363:
$15,221
Texas:
$24,740
(% of AGI for various income ranges: 26.0% for AGIs below $25k, 58.5% for AGIs $25k-50k, 146.3% for AGIs $50k-75k, 310.5% for AGIs $75k-100k, 494.5% for AGIs $100k-200k)
Total itemized deductions: $39,722 (reported on 6.5% of returns)
Here:
$39,722
State:
$40,428
(% of AGI for various income ranges: 97.2% for AGIs below $25k, 417.8% for AGIs $50k-75k, 645.2% for AGIs $100k-200k, 5865.0% for AGIs over 200k)
Charity contributions: $20,613 (reported on 5.4% of returns)
Here:
$20,613
State:
$18,201
(% of AGI for various income ranges: 159.6% for AGIs $50k-75k, 198.6% for AGIs $100k-200k, 3475.0% for AGIs over 200k)
Taxes paid: $7,859 (reported on 6.1% of returns)
79363:
$7,859
State:
$7,821
(% of AGI for various income ranges: 13.8% for AGIs below $25k, 65.9% for AGIs $50k-75k, 167.2% for AGIs $100k-200k, 971.7% for AGIs over 200k)
Earned income credit: $2,471 (reported on 17.6% of returns)
Here:
$2,471
State:
$2,584
(% of AGI for various income ranges: 109.7% for AGIs below $25k, 95.8% for AGIs $25k-50k)
Percentage of individuals using paid preparers for their 2020 taxes: 92.8%
Here:
93%
State:
92%
(% for various income ranges: 92.0% for AGIs below $25k, 92.1% for AGIs $25k-50k, 91.7% for AGIs $50k-75k, 93.1% for AGIs $75k-100k, 95.9% for AGIs $100k-200k, 93.3% for AGIs over 200k)
Averages for the 2012 tax year for zip code 79363, filed in 2013:
Average Adjusted Gross Income (AGI) in 2012: $56,050 (Individual Income Tax Returns)
Here:
$56,050
State:
$65,384
Salary/wage: $47,285 (reported on 89.0% of returns)
Here:
$47,285
State:
$52,524
(% of AGI for various income ranges: 85.2% for AGIs below $25k, 83.6% for AGIs $25k-50k, 77.8% for AGIs $50k-75k, 82.0% for AGIs $75k-100k, 78.9% for AGIs $100k-200k, 47.3% for AGIs over 200k)
Taxable interest for individuals: $942 (reported on 27.0% of returns)
This zip code:
$942
Texas:
$2,372
(% of AGI for various income ranges: 0.5% for AGIs below $25k, 0.3% for AGIs $25k-50k, 0.7% for AGIs $50k-75k, 0.2% for AGIs $75k-100k, 0.5% for AGIs $100k-200k, 0.5% for AGIs over 200k)
Ordinary dividends: $1,826 (reported on 11.4% of returns)
Here:
$1,826
State:
$9,721
(% of AGI for various income ranges: 0.3% for AGIs below $25k, 0.2% for AGIs $25k-50k, 0.5% for AGIs $50k-75k, 0.2% for AGIs $75k-100k, 0.5% for AGIs $100k-200k, 0.4% for AGIs over 200k)
Net capital gain/loss in AGI: +$5,745 (reported on 9.3% of returns)
Here:
+$5,745
State:
+$35,319
(% of AGI for various income ranges: 0.2% for AGIs $25k-50k, 0.6% for AGIs $50k-75k, 1.6% for AGIs $100k-200k, 2.1% for AGIs over 200k)
Profit/loss from business: +$9,625 (reported on 18.6% of returns)
Here:
+$9,625
State:
+$13,732
(% of AGI for various income ranges: 6.2% for AGIs below $25k, 3.1% for AGIs $25k-50k, 2.6% for AGIs $50k-75k, 1.9% for AGIs $75k-100k, 3.8% for AGIs $100k-200k, 2.3% for AGIs over 200k)
Taxable individual retirement arrangement distribution: $11,635 (reported on 7.2% of returns)
79363:
$11,635
Texas:
$19,511
(% of AGI for various income ranges: 1.3% for AGIs below $25k, 1.7% for AGIs $25k-50k, 2.1% for AGIs $50k-75k, 1.6% for AGIs $75k-100k, 1.9% for AGIs $100k-200k)
Total itemized deductions: $21,020 (19% of AGI, reported on 22.8% of returns)
Here:
$21,020
State:
$24,724
Here:
18.7% of AGI
State:
15.9% of AGI
(% of AGI for various income ranges: 5.3% for AGIs below $25k, 5.5% for AGIs $25k-50k, 7.2% for AGIs $50k-75k, 8.3% for AGIs $75k-100k, 11.0% for AGIs $100k-200k, 9.8% for AGIs over 200k)
Charity contributions: $6,548 (reported on 18.6% of returns)
Here:
$6,548
State:
$6,808
(% of AGI for various income ranges: 1.3% for AGIs $25k-50k, 1.5% for AGIs $50k-75k, 1.5% for AGIs $75k-100k, 2.8% for AGIs $100k-200k, 4.0% for AGIs over 200k)
Taxes paid: $5,174 (reported on 22.8% of returns)
79363:
$5,174
State:
$6,921
(% of AGI for various income ranges: 0.6% for AGIs below $25k, 1.0% for AGIs $25k-50k, 1.5% for AGIs $50k-75k, 2.3% for AGIs $75k-100k, 3.2% for AGIs $100k-200k, 2.2% for AGIs over 200k)
Earned income credit: $2,477 (reported on 21.9% of returns)
Here:
$2,477
State:
$2,570
(% of AGI for various income ranges: 8.6% for AGIs below $25k, 1.6% for AGIs $25k-50k)
Percentage of individuals using paid preparers for their 2012 taxes: 50.2%
Here:
50%
State:
51%
(% for various income ranges: 45.6% for AGIs below $25k, 46.4% for AGIs $25k-50k, 50.0% for AGIs $50k-75k, 52.2% for AGIs $75k-100k, 64.5% for AGIs $100k-200k, 71.4% for AGIs over 200k)
Averages for the 2004 tax year for zip code 79363, filed in 2005:
Average Adjusted Gross Income (AGI) in 2004: $37,352 (Individual Income Tax Returns)
Here:
$37,352
State:
$47,881
Salary/wage: $35,224 (reported on 88.1% of returns)
Here:
$35,224
State:
$41,947
(% of AGI for various income ranges: 165.0% for AGIs below $10k, 84.8% for AGIs $10k-25k, 83.3% for AGIs $25k-50k, 85.4% for AGIs $50k-75k, 82.1% for AGIs $75k-100k, 74.5% for AGIs over 100k)
Taxable interest for individuals: $1,157 (reported on 30.5% of returns)
This zip code:
$1,157
Texas:
$2,255
(% of AGI for various income ranges: 4.2% for AGIs below $10k, 1.5% for AGIs $10k-25k, 1.0% for AGIs $25k-50k, 0.5% for AGIs $50k-75k, 0.6% for AGIs $75k-100k, 1.0% for AGIs over 100k)
Taxable dividends: $1,177 (reported on 13.1% of returns)
Here:
$1,177
State:
$4,261
(% of AGI for various income ranges: 2.2% for AGIs below $10k, 0.3% for AGIs $10k-25k, 0.4% for AGIs $25k-50k, 0.2% for AGIs $50k-75k, 0.4% for AGIs $75k-100k, 0.6% for AGIs over 100k)
Net capital gain/loss: +$4,257 (reported on 11.2% of returns)
Here:
+$4,257
State:
+$16,110
(% of AGI for various income ranges: -1.5% for AGIs below $10k, 0.1% for AGIs $10k-25k, 0.6% for AGIs $25k-50k, 0.3% for AGIs $50k-75k, 0.8% for AGIs $75k-100k, 4.1% for AGIs over 100k)
Profit/loss from business: +$6,885 (reported on 18.5% of returns)
Here:
+$6,885
State:
+$11,013
(% of AGI for various income ranges: 12.7% for AGIs below $10k, 3.3% for AGIs $10k-25k, 4.1% for AGIs $25k-50k, 3.5% for AGIs $50k-75k, 1.5% for AGIs $75k-100k, 3.4% for AGIs over 100k)
Profit/loss from farming: +$1,960 (reported on 4.6% of returns)
Here:
+$1,960
State:
-$9,403
(% of AGI for various income ranges: -22.4% for AGIs below $10k, 0.3% for AGIs $10k-25k, 0.5% for AGIs $25k-50k, 0.1% for AGIs $50k-75k, -0.3% for AGIs $75k-100k, 2.0% for AGIs over 100k)
IRA payment deduction: $3,630 (reported on 2.1% of returns)
79363:
$3,630
Texas:
$3,120
(% of AGI for various income ranges: 0.2% for AGIs $10k-25k, 0.3% for AGIs $25k-50k, 0.2% for AGIs $50k-75k, 0.4% for AGIs $75k-100k)
Total itemized deductions: $16,960 (22% of AGI, reported on 18.4% of returns)
Here:
$16,960
State:
$19,631
Here:
21.9% of AGI
State:
18.9% of AGI
(% of AGI for various income ranges: 14.3% for AGIs below $10k, 4.5% for AGIs $10k-25k, 6.6% for AGIs $25k-50k, 7.1% for AGIs $50k-75k, 11.1% for AGIs $75k-100k, 11.3% for AGIs over 100k)
Charity contributions deductions: $5,280 (6% of AGI, reported on 14.9% of returns)
Here:
$5,280
State:
$4,753
Here:
6.4% of AGI
State:
4.2% of AGI
(% of AGI for various income ranges: 0.8% for AGIs $10k-25k, 0.9% for AGIs $25k-50k, 1.6% for AGIs $50k-75k, 2.9% for AGIs $75k-100k, 4.1% for AGIs over 100k)
Total tax: $4,956 (reported on 69.5% of returns)
79363:
$4,956
State:
$9,058
(% of AGI for various income ranges: 4.4% for AGIs below $10k, 3.7% for AGIs $10k-25k, 5.8% for AGIs $25k-50k, 8.3% for AGIs $50k-75k, 10.1% for AGIs $75k-100k, 16.3% for AGIs over 100k)
Earned income credit: $1,968 (reported on 23.1% of returns)
Here:
$1,968
State:
$2,024
Percentage of individuals using paid preparers for their 2004 taxes: 57.2%
Here:
57%
State:
57%
(% for various income ranges: 51.9% for AGIs below $10k, 61.3% for AGIs $10k-25k, 58.8% for AGIs $25k-50k, 53.9% for AGIs $50k-75k, 54.7% for AGIs $75k-100k, 60.8% for AGIs over 100k)
Household received Food Stamps/SNAP in the past 12 months: 173 Household did not receive Food Stamps/SNAP in the past 12 months: 1,969
Women who had a birth in the past 12 months: 18 (18 now married, 0 unmarried) Women who did not have a birth in the past 12 months: 1,272 (769 now married, 496 unmarried)
Housing units in zip code 79363 with a mortgage: 1,018 (19 second mortgage, 21 both second mortgage and home equity loan) Median monthly owner costs for units with a mortgage: $1,806 Median monthly owner costs for units without a mortgage: $502
Residents with income below the poverty level in 2022:
This zip code:
6.9%
Whole state:
14.0%
Residents with income below 50% of the poverty level in 2022:
This zip code:
4.2%
Whole state:
7.4%
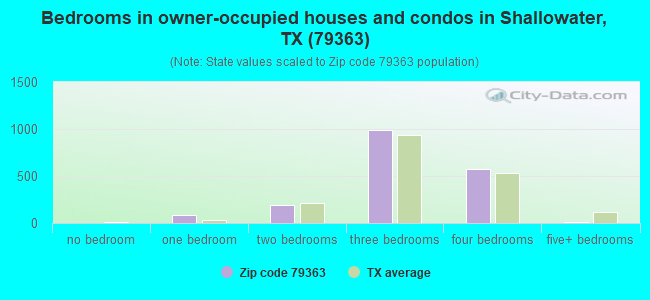
Median number of rooms in houses and condos:
Here:
6.2
State:
6.3
Median number of rooms in apartments:
Here:
5.1
State:
4.0
Notable locations in this zip code not listed on our city pages
Notable locations in zip code 79363: County Line (A), Shallowater Water Field (B), Shallowater Volunteer Fire Department (C), Shallowater Emergency Medical Services (D). Display/hide their locations on the map
Size of family households: 709 2-persons, 386 3-persons, 330 4-persons, 130 5-persons, 60 6-persons, 8 7-or-more-persons
Size of nonfamily households: 386 1-person, 125 2-persons, 4 4-persons
1,086 married couples with children.
269 single-parent households (59 men, 210 women).
85.2% of residents of 79363 zip code speak English at home.
14.6% of residents speak Spanish at home (81% very well, 6% well, 11% not well, 2% not at all).
0.1% of residents speak other Indo-European language at home (100% very well).
0.1% of residents speak Asian or Pacific Island language at home (100% very well).
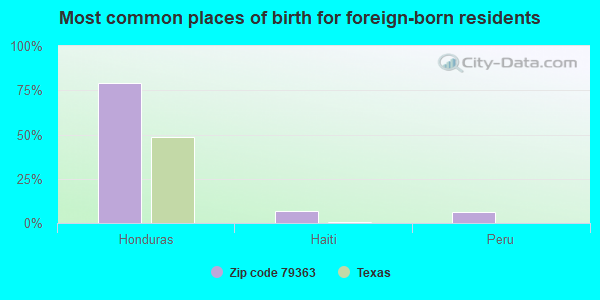
Foreign born population: 129 (2.3%) (40.1% of them are naturalized citizens)
This zip code:
2.3%
Whole state:
17.2%
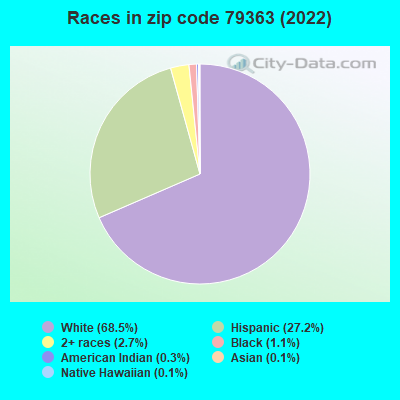
79%Honduras
7%Haiti
6%Peru
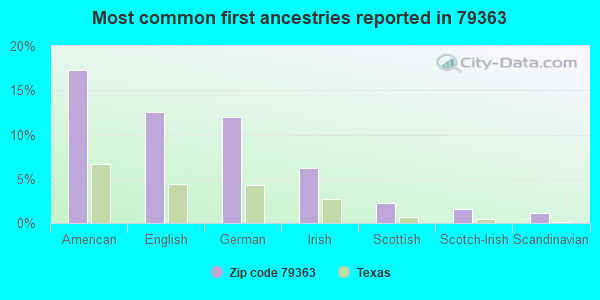
17%American
12%English
12%German
6%Irish
2%Scottish
2%Scotch-Irish
1%Scandinavian
Year of entry for the foreign-born population
02010 or later
592000 to 2009
01990 to 1999
80Before 1990
Facilities with environmental interests located in this zip code:
ACID DELINTERS INC (400 AVENUE E in SHALLOWATER, TX)
(Integrated Compliance Information System) - ICIS-06-1992-0007, FORMAL ENFORCEMENT ACTION TSD (Resource Conservation and Recovery Act (tracking hazardous waste)) Business SIC classification: CROP PREPARATION SERVICES FOR MARKET, EXCEPT COTTON GINNING
Housing units lacking complete plumbing facilities: 3.7% Housing units lacking complete kitchen facilities: 3.1%
54.1%Electricity
43.2%Utility gas
2.4%Bottled, tank, or LP gas
Population in 1990: 4,342. Population change in the 1990s: +453 (+10.4%).
Place of birth for U.S.-born residents:
This state: 4,449
Northeast: 18
Midwest: 169
South: 377
West: 460
57% of the 79363 zip code residents lived in the same house 5 years ago. Out of people who lived in different houses, 65% lived in this county. Out of people who lived in different counties, 50% lived in Texas.
86% of the 79363 zip code residents lived in the same house 1 year ago. Out of people who lived in different houses, 59% moved from this county. Out of people who lived in different houses, 24% moved from different county within same state. Out of people who lived in different houses, 11% moved from different state. Out of people who lived in different houses, 4% moved from abroad.
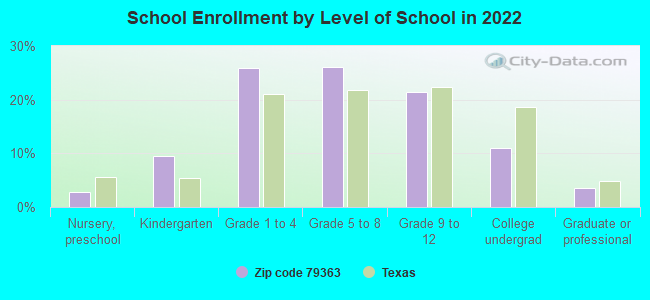
Private vs. public school enrollment:
Students in private schools in grades 1 to 8 (elementary and middle school): 25
Here:
3.4%
Texas:
8.8%
Students in private schools in grades 9 to 12 (high school): 20
Here:
6.6%
Texas:
8.0%
Students in private undergraduate colleges:
Here:
0.6%
Texas:
16.2%
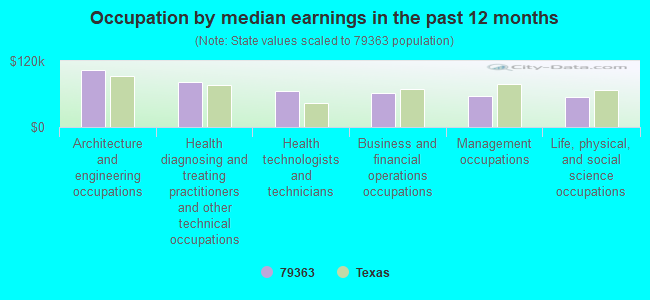
Occupation by median earnings in the past 12 months ($)
104,133Architecture and engineering occupations
81,491Health diagnosing and treating practitioners and other technical occupations
64,863Health technologists and technicians
62,151Business and financial operations occupations
56,741Management occupations
54,788Life, physical, and social science occupations
Companies with federal contracts located in this zip code:
HOMER'S ASPHALT REPAIR (N ON AVE L AND LEFT ON 1 in SHALLOWATER, TX; small business) 2 employees, $120000 revenue. : $19,000 in 2 contractsfrom 2001 to 2002
$18,000 with Agricultural Research Service (disused code) for Maintenance, Repair or Alteration of Real Property -- Highways, Roads, Streets, Bridges, and Railways (includes resurfacing). Signed on 2002-09-15. Completion date: 2002-10-15.
$1,000, same as above.Signed on 2001-09-15. Completion date: 2001-09-15.
Top industries in this zip code by the number of employees in 2005:
Other Services (except Public Administration): Religious Organizations (20-49 employees: 1 establishment, 10-19 employees: 1 establishment, 1-4 employees: 1 establishment)
Accommodation and Food Services: Full-Service Restaurants (20-49: 1)
Construction: Poured Concrete Foundation and Structure Contractors (10-19: 1, 1-4: 1)
Accommodation and Food Services: Limited-Service Restaurants (10-19: 1, 1-4: 1)
Construction: Plumbing, Heating, and Air-Conditioning Contractors (5-9: 1, 1-4: 4)
Finance and Insurance: Commercial Banking (10-19: 1)
Construction: Power and Communication Line and Related Structures Construction (10-19: 1)
Finance and Insurance: Insurance Agencies and Brokerages (5-9: 1, 1-4: 1)
Fatal accident statistics in 2014:
Fatal accident count: 1
Vehicles involved in fatal accidents: 1
Fatal accidents caused by drunken drivers: 1
Fatalities: 1
Persons involved in fatal accidents: 1
Pedestrians involved in fatal accidents: 0
Fatal accident statistics in 2013:
Fatal accident count: 3
Vehicles involved in fatal accidents: 3
Fatal accidents caused by drunken drivers: 1
Fatalities: 3
Persons involved in fatal accidents: 3
Pedestrians involved in fatal accidents: 0
Home Mortgage Disclosure Act Aggregated Statistics For Year 2009 (Based on 1 full and 2 partial tracts)
A) FHA, FSA/RHS & VA Home Purchase Loans
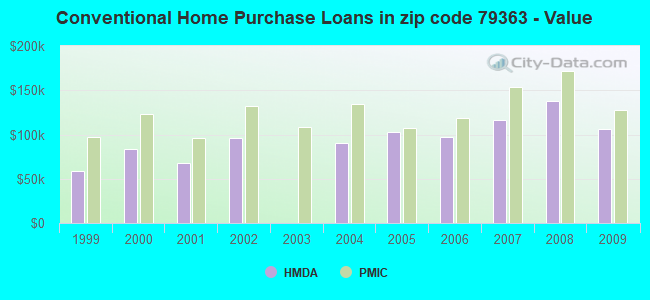
B) Conventional Home Purchase Loans
C) Refinancings
D) Home Improvement Loans
F) Non-occupant Loans on < 5 Family Dwellings (A B C & D)
G) Loans On Manufactured Home Dwelling (A B C & D)
Number
Average Value
Number
Average Value
Number
Average Value
Number
Average Value
Number
Average Value
Number
Average Value
LOANS ORIGINATED
30
$127,216
38
$106,411
94
$149,241
14
$31,181
4
$32,000
14
$56,628
APPLICATIONS APPROVED, NOT ACCEPTED
1
$35,720
1
$170,000
7
$107,261
1
$27,100
0
$0
3
$49,363
APPLICATIONS DENIED
2
$37,820
10
$72,782
21
$91,274
7
$60,290
2
$223,180
12
$68,728
APPLICATIONS WITHDRAWN
4
$164,015
5
$148,578
18
$119,102
4
$62,338
0
$0
4
$63,438
FILES CLOSED FOR INCOMPLETENESS
0
$0
0
$0
3
$44,710
2
$47,000
0
$0
2
$42,000
Aggregated Statistics For Year 2008 (Based on 1 full and 2 partial tracts)
A) FHA, FSA/RHS & VA Home Purchase Loans
B) Conventional Home Purchase Loans
C) Refinancings
D) Home Improvement Loans
F) Non-occupant Loans on < 5 Family Dwellings (A B C & D)
G) Loans On Manufactured Home Dwelling (A B C & D)
Number
Average Value
Number
Average Value
Number
Average Value
Number
Average Value
Number
Average Value
Number
Average Value
LOANS ORIGINATED
32
$121,894
53
$138,360
45
$121,046
18
$13,606
11
$46,775
13
$60,232
APPLICATIONS APPROVED, NOT ACCEPTED
2
$122,815
2
$60,000
7
$87,894
2
$10,240
1
$50,000
2
$60,000
APPLICATIONS DENIED
0
$0
3
$56,233
12
$108,092
20
$39,513
5
$70,458
1
$68,980
APPLICATIONS WITHDRAWN
4
$93,000
1
$247,590
13
$102,687
1
$80,070
3
$61,333
1
$114,560
FILES CLOSED FOR INCOMPLETENESS
0
$0
1
$75,000
0
$0
1
$49,270
0
$0
0
$0
Aggregated Statistics For Year 2007 (Based on 1 full and 2 partial tracts)
A) FHA, FSA/RHS & VA Home Purchase Loans
B) Conventional Home Purchase Loans
C) Refinancings
D) Home Improvement Loans
F) Non-occupant Loans on < 5 Family Dwellings (A B C & D)
G) Loans On Manufactured Home Dwelling (A B C & D)
Number
Average Value
Number
Average Value
Number
Average Value
Number
Average Value
Number
Average Value
Number
Average Value
LOANS ORIGINATED
21
$118,731
77
$116,556
25
$127,611
26
$31,078
20
$66,128
18
$51,842
APPLICATIONS APPROVED, NOT ACCEPTED
0
$0
5
$65,894
2
$28,240
6
$19,837
0
$0
4
$27,408
APPLICATIONS DENIED
4
$120,770
27
$99,537
41
$89,656
42
$21,756
9
$41,368
18
$39,111
APPLICATIONS WITHDRAWN
1
$183,540
5
$58,022
13
$114,153
7
$35,173
1
$98,540
4
$33,568
FILES CLOSED FOR INCOMPLETENESS
0
$0
3
$174,680
7
$115,017
1
$67,750
3
$165,373
1
$67,750
Aggregated Statistics For Year 2006 (Based on 1 full and 2 partial tracts)
A) FHA, FSA/RHS & VA Home Purchase Loans
B) Conventional Home Purchase Loans
C) Refinancings
D) Home Improvement Loans
F) Non-occupant Loans on < 5 Family Dwellings (A B C & D)
G) Loans On Manufactured Home Dwelling (A B C & D)
Number
Average Value
Number
Average Value
Number
Average Value
Number
Average Value
Number
Average Value
Number
Average Value
LOANS ORIGINATED
12
$99,886
94
$97,521
32
$88,860
19
$40,604
10
$55,583
20
$60,743
APPLICATIONS APPROVED, NOT ACCEPTED
1
$84,000
4
$117,832
8
$66,010
1
$25,000
1
$120,720
5
$40,722
APPLICATIONS DENIED
4
$74,732
22
$70,043
44
$74,765
22
$20,448
5
$48,922
21
$45,277
APPLICATIONS WITHDRAWN
1
$186,000
10
$107,424
12
$67,092
2
$66,590
1
$63,000
2
$64,025
FILES CLOSED FOR INCOMPLETENESS
1
$123,000
0
$0
7
$135,289
0
$0
0
$0
0
$0
Aggregated Statistics For Year 2005 (Based on 1 full and 2 partial tracts)
A) FHA, FSA/RHS & VA Home Purchase Loans
B) Conventional Home Purchase Loans
C) Refinancings
D) Home Improvement Loans
F) Non-occupant Loans on < 5 Family Dwellings (A B C & D)
G) Loans On Manufactured Home Dwelling (A B C & D)
Number
Average Value
Number
Average Value
Number
Average Value
Number
Average Value
Number
Average Value
Number
Average Value
LOANS ORIGINATED
24
$94,610
77
$102,428
47
$110,497
12
$73,087
9
$70,556
11
$67,478
APPLICATIONS APPROVED, NOT ACCEPTED
2
$107,445
18
$91,925
5
$85,984
2
$24,635
3
$103,567
14
$58,249
APPLICATIONS DENIED
2
$99,160
26
$52,459
64
$69,085
21
$31,891
6
$48,135
30
$47,471
APPLICATIONS WITHDRAWN
2
$86,180
10
$140,781
25
$146,256
6
$158,082
6
$103,863
6
$73,702
FILES CLOSED FOR INCOMPLETENESS
0
$0
2
$99,890
16
$113,058
2
$105,465
0
$0
0
$0
Aggregated Statistics For Year 2004 (Based on 1 full and 2 partial tracts)
A) FHA, FSA/RHS & VA Home Purchase Loans
B) Conventional Home Purchase Loans
C) Refinancings
D) Home Improvement Loans
F) Non-occupant Loans on < 5 Family Dwellings (A B C & D)
G) Loans On Manufactured Home Dwelling (A B C & D)
Number
Average Value
Number
Average Value
Number
Average Value
Number
Average Value
Number
Average Value
Number
Average Value
LOANS ORIGINATED
22
$100,689
69
$90,489
78
$116,549
8
$37,625
11
$71,786
10
$54,599
APPLICATIONS APPROVED, NOT ACCEPTED
1
$50,000
10
$85,393
7
$78,971
0
$0
1
$51,740
5
$40,756
APPLICATIONS DENIED
2
$66,515
23
$48,422
55
$72,434
10
$23,907
2
$31,400
27
$48,702
APPLICATIONS WITHDRAWN
1
$71,440
2
$188,360
34
$85,628
1
$15,000
0
$0
4
$73,600
FILES CLOSED FOR INCOMPLETENESS
1
$115,790
5
$89,076
5
$118,240
1
$30,800
1
$83,760
0
$0
Aggregated Statistics For Year 2002 (Based on 1 full and 2 partial tracts)
A) FHA, FSA/RHS & VA Home Purchase Loans
B) Conventional Home Purchase Loans
C) Refinancings
D) Home Improvement Loans
F) Non-occupant Loans on < 5 Family Dwellings (A B C & D)
Number
Average Value
Number
Average Value
Number
Average Value
Number
Average Value
Number
Average Value
LOANS ORIGINATED
21
$80,137
40
$96,523
90
$94,587
9
$10,191
10
$83,716
APPLICATIONS APPROVED, NOT ACCEPTED
1
$75,000
12
$58,060
12
$88,338
4
$33,308
0
$0
APPLICATIONS DENIED
3
$60,960
32
$41,705
42
$64,631
17
$15,209
4
$22,172
APPLICATIONS WITHDRAWN
2
$132,420
3
$67,000
14
$89,682
3
$31,703
1
$98,000
FILES CLOSED FOR INCOMPLETENESS
0
$0
1
$62,000
8
$67,985
0
$0
0
$0
Aggregated Statistics For Year 2001 (Based on 1 full and 2 partial tracts)
A) FHA, FSA/RHS & VA Home Purchase Loans
B) Conventional Home Purchase Loans
C) Refinancings
D) Home Improvement Loans
F) Non-occupant Loans on < 5 Family Dwellings (A B C & D)
Number
Average Value
Number
Average Value
Number
Average Value
Number
Average Value
Number
Average Value
LOANS ORIGINATED
24
$76,784
47
$68,137
39
$88,219
15
$6,413
4
$47,000
APPLICATIONS APPROVED, NOT ACCEPTED
0
$0
11
$38,907
9
$67,348
7
$12,380
2
$23,000
APPLICATIONS DENIED
1
$110,860
67
$41,497
13
$55,982
22
$11,365
0
$0
APPLICATIONS WITHDRAWN
1
$73,000
5
$24,096
14
$76,441
0
$0
1
$95,000
FILES CLOSED FOR INCOMPLETENESS
1
$74,000
0
$0
0
$0
0
$0
0
$0
Aggregated Statistics For Year 2000 (Based on 1 full and 2 partial tracts)
A) FHA, FSA/RHS & VA Home Purchase Loans
B) Conventional Home Purchase Loans
C) Refinancings
D) Home Improvement Loans
F) Non-occupant Loans on < 5 Family Dwellings (A B C & D)
Number
Average Value
Number
Average Value
Number
Average Value
Number
Average Value
Number
Average Value
LOANS ORIGINATED
15
$74,739
50
$83,669
23
$78,108
14
$12,744
5
$40,378
APPLICATIONS APPROVED, NOT ACCEPTED
0
$0
9
$47,494
3
$38,303
1
$5,000
1
$29,000
APPLICATIONS DENIED
9
$54,150
28
$40,692
14
$45,566
6
$12,488
3
$55,780
APPLICATIONS WITHDRAWN
3
$67,220
8
$86,142
5
$59,822
0
$0
0
$0
FILES CLOSED FOR INCOMPLETENESS
0
$0
1
$176,000
3
$53,333
0
$0
0
$0
Aggregated Statistics For Year 1999 (Based on 1 full and 1 partial tracts)
A) FHA, FSA/RHS & VA Home Purchase Loans
B) Conventional Home Purchase Loans
C) Refinancings
D) Home Improvement Loans
E) Loans on Dwellings For 5+ Families
F) Non-occupant Loans on < 5 Family Dwellings (A B C & D)
Detailed PMIC statistics for the following Tracts:0103.01
, 0103.02
2004 - 2018 National Fire Incident Reporting System (NFIRS) incidents
Based on the data from the years 2004 - 2018 the average number of fire incidents per year is 72. The highest number of reported fire incidents - 101 took place in 2011, and the least - 42 in 2004. The data has a rising trend.
When looking into fire subcategories, the most reports belonged to: Outside Fires (71.8%), and Structure Fires (18.8%).
Fire incident types reported to NFIRS in Zip Code 79363


+$1,960
-$9,403
(% of AGI for various income ranges: -22.4% for AGIs below $10k, 0.3% for AGIs $10k-25k, 0.5% for AGIs $25k-50k, 0.1% for AGIs $50k-75k, -0.3% for AGIs $75k-100k, 2.0% for AGIs over 100k) Nearest zip codes: 79416, 79407, 79415, 79313, 79367, 79414.


 Based on the data from the years 2004 - 2018 the average number of fire incidents per year is 72. The highest number of reported fire incidents - 101 took place in 2011, and the least - 42 in 2004. The data has a rising trend.
 When looking into fire subcategories, the most reports belonged to: Outside Fires (71.8%), and Structure Fires (18.8%).