Estimated zip code population in 2022: 7,959 Zip code population in 2010: 5,772 Zip code population in 2000: 5,658
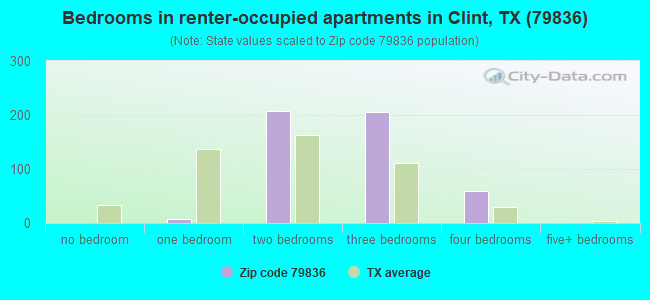
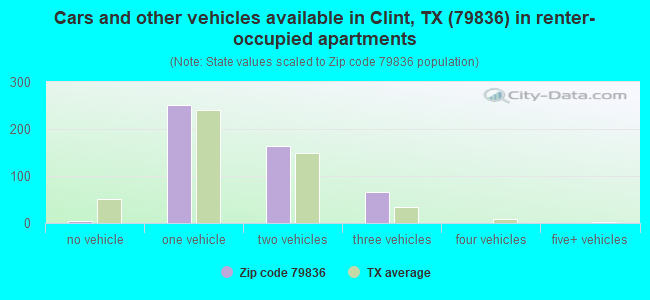
Houses and condos: 2,640 Renter-occupied apartments: 487
% of renters here:
19%
State:
38%
March 2022 cost of living index in zip code 79836: 80.9 (low, U.S. average is 100)
Land area: 19.2 sq. mi. Water area: 0.0 sq. mi.
Population density: 415 people per square mile
(low).
OSM Map
General Map
Google Map
MSN Map
OSM Map
General Map
Google Map
MSN Map
OSM Map
General Map
Google Map
MSN Map
OSM Map
General Map
Google Map
MSN Map
Please wait while loading the map...
Real estate property taxes paid for housing units in 2022:
This zip code:
1.3% ($1,539)
Texas:
1.5% ($4,050)
Median real estate property taxes paid for housing units with mortgages in 2022: $2,548 (2.2%) Median real estate property taxes paid for housing units with no mortgage in 2022: $1,332 (1.2%)
Business Search- 14 Million verified businesses
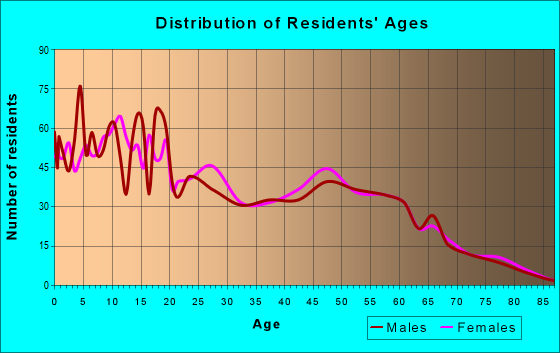
Males: 3,868
(48.6%)
Females: 4,091
(51.4%)
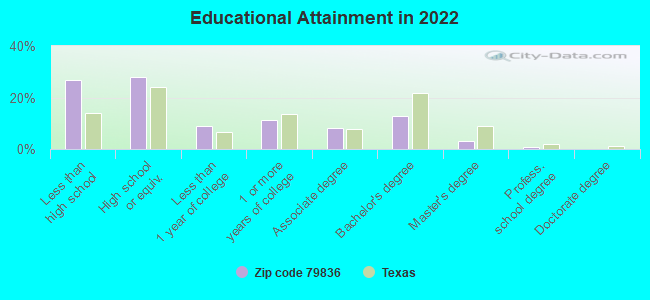
For population 25 years and over in 79836:
High school or higher: 71.8%
Bachelor's degree or higher: 16.4%
Graduate or professional degree: 4.0%
Unemployed: 4.4%
Mean travel time to work (commute): 27.3 minutes
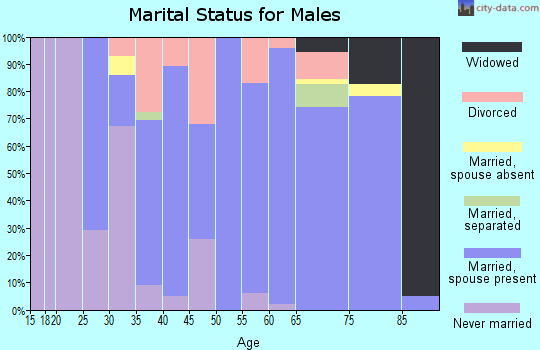
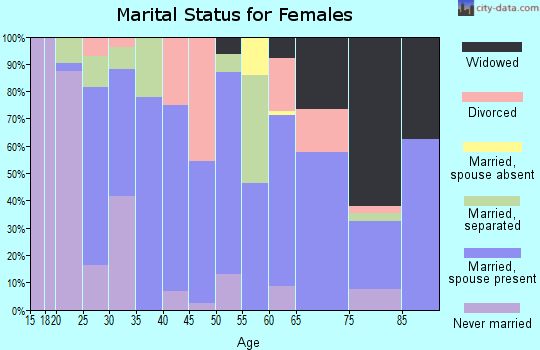
For population 15 years and over in 79836:
Never married: 29.5%
Now married: 51.4%
Separated: 3.9%
Widowed: 9.0%
Divorced: 6.3%
Zip code 79836 compared to state average:
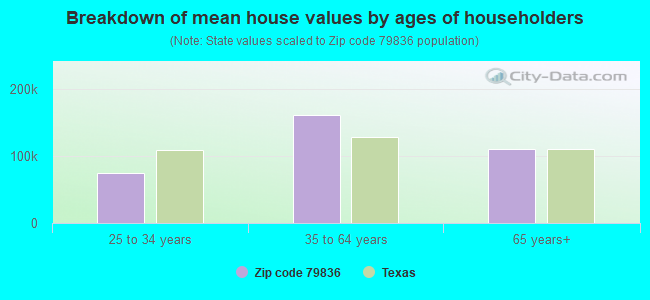
Median house value significantly below state average.
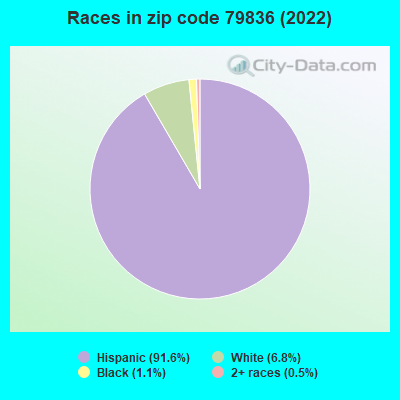
Black race population percentage significantly below state average.
Hispanic race population percentage above state average.
Median age below state average.
Foreign-born population percentage above state average.
Renting percentage below state average.
Length of stay since moving in above state average.
Percentage of population with a bachelor's degree or higher significantly below state average.
Estimated median house/condo value in 2022: $115,136
79836:
$115,136
Texas:
$275,400
According to our research of Texas and other state lists, there were 13 registered sex offenders living in 79836 zip code as of May 03, 2024. The ratio of all residents to sex offenders in zip code 79836 is 444 to 1. The ratio of registered sex offenders to all residents in this zip code is near the state average.
Median resident age:
This zip code:
27.9 years
Texas median age:
35.6 years
Average household size:
This zip code:
3.2 people
Texas:
2.6 people
Averages for the 2020 tax year for zip code 79836, filed in 2021:
Average Adjusted Gross Income (AGI) in 2020: $41,283 (Individual Income Tax Returns)
Here:
$41,283
State:
$77,054
Salary/wage: $36,214 (reported on 82.5% of returns)
Here:
$36,214
State:
$62,766
(% of AGI for various income ranges: 1101.8% for AGIs below $25k, 3411.9% for AGIs $25k-50k, 6238.3% for AGIs $50k-75k, 9052.1% for AGIs $75k-100k, 15334.5% for AGIs $100k-200k)
Taxable interest for individuals: $1,212 (reported on 12.9% of returns)
This zip code:
$1,212
Texas:
$2,665
(% of AGI for various income ranges: 3.9% for AGIs below $25k, 3.2% for AGIs $25k-50k, 14.3% for AGIs $50k-75k, 36.4% for AGIs $75k-100k, 93.6% for AGIs $100k-200k)
Ordinary dividends: $1,260 (reported on 3.1% of returns)
Here:
$1,260
State:
$10,044
(% of AGI for various income ranges: 2.2% for AGIs below $25k, 2.0% for AGIs $50k-75k, 82.7% for AGIs $100k-200k)
Net capital gain/loss in AGI: +$20,300 (reported on 3.1% of returns)
Here:
+$20,300
State:
+$39,590
(% of AGI for various income ranges: 0.6% for AGIs below $25k, 5.7% for AGIs $25k-50k, 82.1% for AGIs $75k-100k)
Profit/loss from business: +$9,976 (reported on 24.2% of returns)
Here:
+$9,976
State:
+$10,888
(% of AGI for various income ranges: 302.2% for AGIs below $25k, 352.3% for AGIs $25k-50k, 251.1% for AGIs $50k-75k, 20.0% for AGIs $75k-100k, 376.4% for AGIs $100k-200k)
Taxable individual retirement arrangement distribution: $12,300 (reported on 2.1% of returns)
79836:
$12,300
Texas:
$24,740
(% of AGI for various income ranges: 54.1% for AGIs $25k-50k, 310.0% for AGIs $75k-100k)
Total itemized deductions: $31,317 (reported on 1.8% of returns)
Here:
$31,317
State:
$40,428
(% of AGI for various income ranges: 63.7% for AGIs $25k-50k, 155.7% for AGIs $50k-75k, 755.5% for AGIs $100k-200k)
Charity contributions: $8,000 (reported on 1.5% of returns)
Here:
$8,000
State:
$18,201
(% of AGI for various income ranges: 14.4% for AGIs $25k-50k, 204.3% for AGIs $75k-100k)
Taxes paid: $8,133 (reported on 1.8% of returns)
79836:
$8,133
State:
$7,821
(% of AGI for various income ranges: 18.0% for AGIs $25k-50k, 38.9% for AGIs $50k-75k, 190.9% for AGIs $100k-200k)
Earned income credit: $2,957 (reported on 36.2% of returns)
Here:
$2,957
State:
$2,584
(% of AGI for various income ranges: 191.8% for AGIs below $25k, 135.8% for AGIs $25k-50k, 5.4% for AGIs $50k-75k)
Percentage of individuals using paid preparers for their 2020 taxes: 90.2%
Here:
90%
State:
92%
(% for various income ranges: 90.1% for AGIs below $25k, 89.5% for AGIs $25k-50k, 90.7% for AGIs $50k-75k, 94.1% for AGIs $75k-100k, 87.5% for AGIs $100k-200k, 100.0% for AGIs over 200k)
Averages for the 2012 tax year for zip code 79836, filed in 2013:
Average Adjusted Gross Income (AGI) in 2012: $35,184 (Individual Income Tax Returns)
Here:
$35,184
State:
$65,384
Salary/wage: $30,409 (reported on 83.7% of returns)
Here:
$30,409
State:
$52,524
(% of AGI for various income ranges: 73.7% for AGIs below $25k, 87.8% for AGIs $25k-50k, 83.2% for AGIs $50k-75k, 80.2% for AGIs $75k-100k, 101.5% for AGIs $100k-200k)
Taxable interest for individuals: $3,152 (reported on 12.0% of returns)
This zip code:
$3,152
Texas:
$2,372
(% of AGI for various income ranges: 0.3% for AGIs $25k-50k, 0.3% for AGIs $50k-75k, 0.5% for AGIs $75k-100k, 0.4% for AGIs $100k-200k, 5.9% for AGIs over 200k)
Ordinary dividends: $1,462 (reported on 3.1% of returns)
Here:
$1,462
State:
$9,721
(% of AGI for various income ranges: 0.2% for AGIs below $25k, 0.6% for AGIs $100k-200k)
Net capital gain/loss in AGI: +$6,033 (reported on 2.3% of returns)
Here:
+$6,033
State:
+$35,319
Profit/loss from business: +$10,722 (reported on 23.3% of returns)
Here:
+$10,722
State:
+$13,732
(% of AGI for various income ranges: 20.8% for AGIs below $25k, 5.2% for AGIs $25k-50k, 5.2% for AGIs $50k-75k, 3.2% for AGIs $100k-200k)
Taxable individual retirement arrangement distribution: $9,214 (reported on 2.7% of returns)
79836:
$9,214
Texas:
$19,511
Total itemized deductions: $21,326 (21% of AGI, reported on 10.5% of returns)
Here:
$21,326
State:
$24,724
Here:
21.5% of AGI
State:
15.9% of AGI
(% of AGI for various income ranges: 1.4% for AGIs below $25k, 5.4% for AGIs $25k-50k, 10.7% for AGIs $50k-75k, 9.2% for AGIs $75k-100k, 16.9% for AGIs $100k-200k)
Charity contributions: $3,006 (reported on 7.0% of returns)
Here:
$3,006
State:
$6,808
(% of AGI for various income ranges: 0.4% for AGIs $25k-50k, 0.8% for AGIs $50k-75k, 0.8% for AGIs $75k-100k, 2.2% for AGIs $100k-200k)
Taxes paid: $4,674 (reported on 10.5% of returns)
79836:
$4,674
State:
$6,921
(% of AGI for various income ranges: 0.3% for AGIs below $25k, 1.0% for AGIs $25k-50k, 2.4% for AGIs $50k-75k, 2.0% for AGIs $75k-100k, 4.0% for AGIs $100k-200k)
Earned income credit: $3,080 (reported on 46.5% of returns)
Here:
$3,080
State:
$2,570
(% of AGI for various income ranges: 14.7% for AGIs below $25k, 3.1% for AGIs $25k-50k)
Percentage of individuals using paid preparers for their 2012 taxes: 69.0%
Here:
69%
State:
51%
(% for various income ranges: 69.9% for AGIs below $25k, 66.2% for AGIs $25k-50k, 68.2% for AGIs $50k-75k, 72.7% for AGIs $75k-100k, 66.7% for AGIs $100k-200k, 100.0% for AGIs over 200k)
Averages for the 2004 tax year for zip code 79836, filed in 2005:
Average Adjusted Gross Income (AGI) in 2004: $30,927 (Individual Income Tax Returns)
Here:
$30,927
State:
$47,881
Salary/wage: $24,906 (reported on 87.3% of returns)
Here:
$24,906
State:
$41,947
(% of AGI for various income ranges: 89.6% for AGIs below $10k, 84.9% for AGIs $10k-25k, 89.9% for AGIs $25k-50k, 82.6% for AGIs $50k-75k, 80.0% for AGIs $75k-100k, 32.7% for AGIs over 100k)
Taxable interest for individuals: $2,278 (reported on 18.7% of returns)
This zip code:
$2,278
Texas:
$2,255
(% of AGI for various income ranges: 0.8% for AGIs below $10k, 0.3% for AGIs $10k-25k, 0.7% for AGIs $25k-50k, 0.4% for AGIs $50k-75k, 0.8% for AGIs $75k-100k, 3.3% for AGIs over 100k)
Taxable dividends: $777 (reported on 5.6% of returns)
Here:
$777
State:
$4,261
(% of AGI for various income ranges: 0.3% for AGIs below $10k, 0.3% for AGIs $10k-25k, 0.1% for AGIs $25k-50k, 0.1% for AGIs $50k-75k, 0.1% for AGIs over 100k)
Net capital gain/loss: +$42,385 (reported on 5.2% of returns)
Here:
+$42,385
State:
+$16,110
(% of AGI for various income ranges: -0.7% for AGIs below $10k, 0.1% for AGIs $10k-25k, 0.8% for AGIs $25k-50k, 1.1% for AGIs $50k-75k, 22.6% for AGIs over 100k)
Profit/loss from business: +$7,554 (reported on 19.4% of returns)
Here:
+$7,554
State:
+$11,013
(% of AGI for various income ranges: 18.3% for AGIs below $10k, 10.0% for AGIs $10k-25k, 2.7% for AGIs $25k-50k, 2.3% for AGIs $50k-75k, 3.0% for AGIs over 100k)
Profit/loss from farming: +$6,907 (reported on 2.7% of returns)
Here:
+$6,907
State:
-$9,403
(% of AGI for various income ranges: 1.6% for AGIs below $10k, 0.0% for AGIs $50k-75k, 1.8% for AGIs over 100k)
IRA payment deduction: $2,600 (reported on 1.2% of returns)
79836:
$2,600
Texas:
$3,120
Total itemized deductions: $16,594 (18% of AGI, reported on 11.3% of returns)
Here:
$16,594
State:
$19,631
Here:
18.1% of AGI
State:
18.9% of AGI
(% of AGI for various income ranges: 2.8% for AGIs $10k-25k, 7.7% for AGIs $25k-50k, 10.4% for AGIs $50k-75k, 5.9% for AGIs $75k-100k, 6.0% for AGIs over 100k)
Charity contributions deductions: $3,071 (4% of AGI, reported on 9.1% of returns)
Here:
$3,071
State:
$4,753
Here:
3.6% of AGI
State:
4.2% of AGI
(% of AGI for various income ranges: 0.3% for AGIs $10k-25k, 0.6% for AGIs $25k-50k, 1.6% for AGIs $50k-75k, 1.5% for AGIs $75k-100k, 1.3% for AGIs over 100k)
Total tax: $5,313 (reported on 54.4% of returns)
79836:
$5,313
State:
$9,058
(% of AGI for various income ranges: 3.7% for AGIs below $10k, 3.1% for AGIs $10k-25k, 4.4% for AGIs $25k-50k, 7.9% for AGIs $50k-75k, 11.7% for AGIs $75k-100k, 19.0% for AGIs over 100k)
Earned income credit: $2,341 (reported on 47.3% of returns)
Here:
$2,341
State:
$2,024
Percentage of individuals using paid preparers for their 2004 taxes: 72.4%
Here:
72%
State:
57%
(% for various income ranges: 68.0% for AGIs below $10k, 79.3% for AGIs $10k-25k, 68.7% for AGIs $25k-50k, 61.5% for AGIs $50k-75k, 52.2% for AGIs $75k-100k, 80.6% for AGIs over 100k)
Household received Food Stamps/SNAP in the past 12 months: 588 Household did not receive Food Stamps/SNAP in the past 12 months: 1,924
Women who had a birth in the past 12 months: 223 (128 now married, 93 unmarried) Women who did not have a birth in the past 12 months: 1,574 (722 now married, 851 unmarried)
Housing units in zip code 79836 with a mortgage: 675 Houses without a mortgage: 41
Median monthly owner costs for units with a mortgage: $1,122 Median monthly owner costs for units without a mortgage: $433
Residents with income below the poverty level in 2022:
This zip code:
21.0%
Whole state:
14.0%
Residents with income below 50% of the poverty level in 2022:
This zip code:
17.0%
Whole state:
7.4%
Median number of rooms in houses and condos:
Here:
5.1
State:
6.3
Median number of rooms in apartments:
Here:
4.2
State:
4.0
Notable locations in this zip code not listed on our city pages
Notable locations in zip code 79836: Clint Volunteer Fire Department Station 3 (A), Clint Volunteer Fire Department Station 1 (B). Display/hide their locations on the map
In group quarters: 40 (-1 institutionalized population)
Size of family households: 495 2-persons, 434 3-persons, 301 4-persons, 181 5-persons, 185 6-persons, 172 7-or-more-persons
Size of nonfamily households: 715 1-person, 3 2-persons
1,452 married couples with children.
488 single-parent households (42 men, 446 women).
18.8% of residents of 79836 zip code speak English at home.
80.5% of residents speak Spanish at home (62% very well, 16% well, 11% not well, 11% not at all).
0.4% of residents speak other language at home (100% very well).
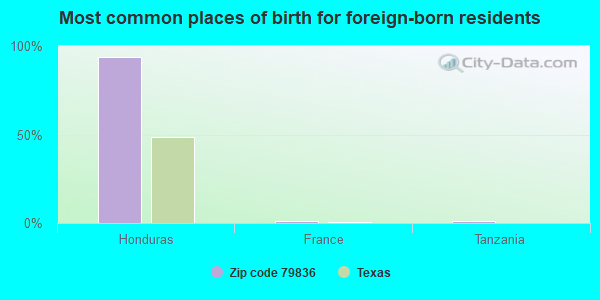
Foreign born population: 2,002 (25.2%) (52.2% of them are naturalized citizens)
This zip code:
25.2%
Whole state:
17.2%
94%Honduras
1%France
1%Tanzania
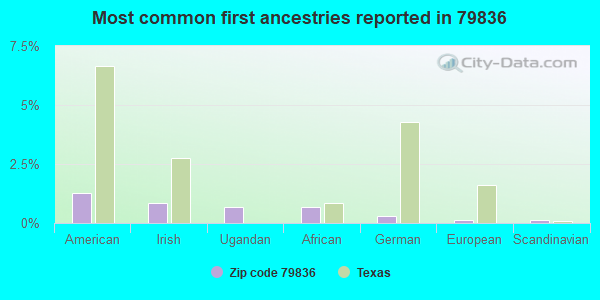
1%American
1%Irish
1%Ugandan
1%African
0%German
0%European
0%Scandinavian
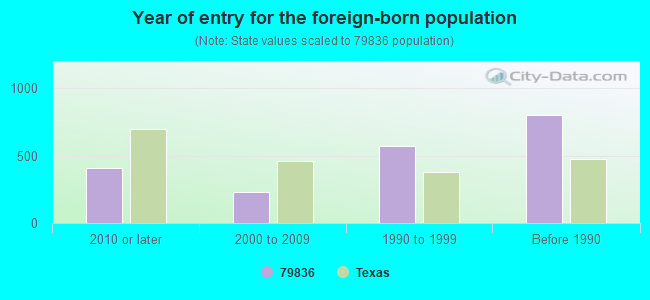
Year of entry for the foreign-born population
4082010 or later
2322000 to 2009
5691990 to 1999
801Before 1990
Housing units lacking complete plumbing facilities: 2.4% Housing units lacking complete kitchen facilities: 4.4%
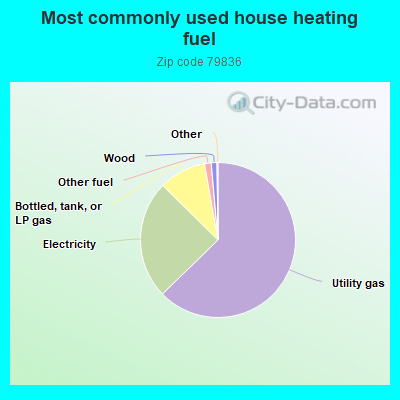
62.8%Utility gas
24.7%Electricity
9.8%Bottled, tank, or LP gas
1.4%Other fuel
1.2%Wood
Population in 1990: 17,337.
Place of birth for U.S.-born residents:
This state: 5,260
Northeast: 48
Midwest: 128
South: 126
West: 272
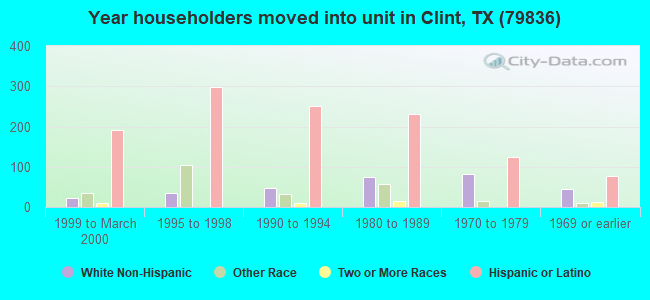
74% of the 79836 zip code residents lived in the same house 5 years ago. Out of people who lived in different houses, 81% lived in this county. Out of people who lived in different counties, 50% lived in Texas.
92% of the 79836 zip code residents lived in the same house 1 year ago. Out of people who lived in different houses, 76% moved from this county. Out of people who lived in different houses, 17% moved from different county within same state. Out of people who lived in different houses, 4% moved from different state.
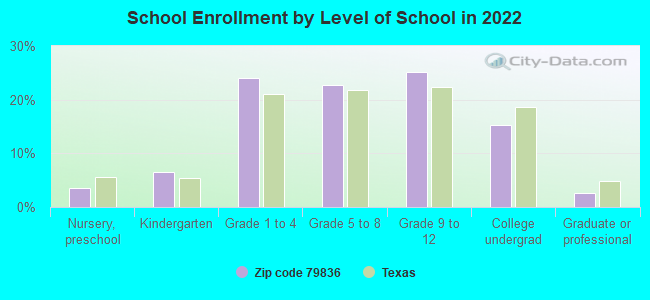
Private vs. public school enrollment:
Students in private schools in grades 1 to 8 (elementary and middle school): 13
Here:
1.2%
Texas:
8.8%
Students in private schools in grades 9 to 12 (high school): 46
Here:
7.6%
Texas:
8.0%
Students in private undergraduate colleges: 12
Here:
3.4%
Texas:
16.2%
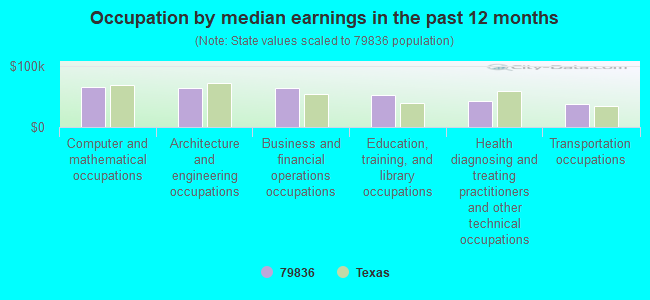
Occupation by median earnings in the past 12 months ($)
65,129Computer and mathematical occupations
64,472Architecture and engineering occupations
63,856Business and financial operations occupations
52,614Education, training, and library occupations
43,258Health diagnosing and treating practitioners and other technical occupations
38,369Transportation occupations
Companies with federal contracts located in this zip code:
EL PASO FENCE CO (358 ROSARIO in CLINT, TX; small business)
$12,500 with Army for Construction of Structures and Facilities -- Other Non-Building Facilities. Signed on 2002-04-11. Completion date: 2002-05-10.
CHAPPELLS MOBILE HOME SERVICE (12222 MANKATO RD in CLINT, TX; small business) : $10,124 in 3 contractsin 2004
$7,320 with Army for Motor Charter for Things. Signed on 2004-06-03. Completion date: 2004-06-18.
$5,608 with Army for Packing/Crating Services. Signed on 2004-06-30. Completion date: 2004-09-25.
-$2,804, same as above.Signed on 2004-09-15. Completion date: 2004-09-25.
Top industries in this zip code by the number of employees in 2005:
Health Care and Social Assistance: Services for the Elderly and Persons with Disabilities (250-499 employees: 1 establishment)
Accommodation and Food Services: Full-Service Restaurants (5-9: 1)
Construction: Land Subdivision (5-9: 1)
People in group quarters in 2000:
16 people in other noninstitutional group quarters
Fatal accident statistics in 2014:
Fatal accident count: 1
Vehicles involved in fatal accidents: 1
Fatal accidents caused by drunken drivers: 1
Fatalities: 1
Persons involved in fatal accidents: 1
Pedestrians involved in fatal accidents: 0
Home Mortgage Disclosure Act Aggregated Statistics For Year 2009 (Based on 8 partial tracts)
A) FHA, FSA/RHS & VA Home Purchase Loans
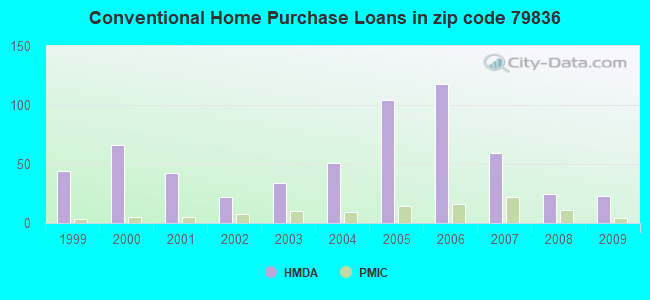
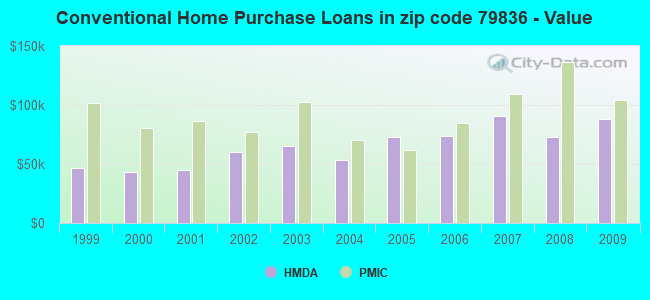
B) Conventional Home Purchase Loans
C) Refinancings
D) Home Improvement Loans
F) Non-occupant Loans on < 5 Family Dwellings (A B C & D)
G) Loans On Manufactured Home Dwelling (A B C & D)
Number
Average Value
Number
Average Value
Number
Average Value
Number
Average Value
Number
Average Value
Number
Average Value
LOANS ORIGINATED
18
$98,893
23
$88,057
39
$82,148
37
$12,071
3
$83,687
7
$44,967
APPLICATIONS APPROVED, NOT ACCEPTED
3
$79,353
11
$61,930
16
$83,832
1
$69,580
0
$0
9
$59,019
APPLICATIONS DENIED
5
$123,310
16
$63,309
82
$80,615
57
$27,922
5
$69,946
18
$47,346
APPLICATIONS WITHDRAWN
3
$88,037
3
$57,247
19
$119,473
6
$65,302
1
$69,030
0
$0
FILES CLOSED FOR INCOMPLETENESS
0
$0
0
$0
4
$129,795
0
$0
0
$0
0
$0
Aggregated Statistics For Year 2008 (Based on 8 partial tracts)
A) FHA, FSA/RHS & VA Home Purchase Loans
B) Conventional Home Purchase Loans
C) Refinancings
D) Home Improvement Loans
F) Non-occupant Loans on < 5 Family Dwellings (A B C & D)
G) Loans On Manufactured Home Dwelling (A B C & D)
Number
Average Value
Number
Average Value
Number
Average Value
Number
Average Value
Number
Average Value
Number
Average Value
LOANS ORIGINATED
17
$105,415
25
$72,558
60
$83,098
60
$19,140
8
$72,455
7
$55,294
APPLICATIONS APPROVED, NOT ACCEPTED
0
$0
16
$59,854
25
$69,870
7
$42,430
1
$41,830
12
$56,263
APPLICATIONS DENIED
5
$108,970
25
$65,427
118
$74,884
97
$31,026
8
$124,911
23
$44,972
APPLICATIONS WITHDRAWN
4
$84,415
5
$55,374
41
$84,202
9
$46,100
4
$60,050
4
$55,808
FILES CLOSED FOR INCOMPLETENESS
2
$91,115
4
$61,785
5
$76,634
4
$52,398
0
$0
0
$0
Aggregated Statistics For Year 2007 (Based on 8 partial tracts)
A) FHA, FSA/RHS & VA Home Purchase Loans
B) Conventional Home Purchase Loans
C) Refinancings
D) Home Improvement Loans
F) Non-occupant Loans on < 5 Family Dwellings (A B C & D)
G) Loans On Manufactured Home Dwelling (A B C & D)
Number
Average Value
Number
Average Value
Number
Average Value
Number
Average Value
Number
Average Value
Number
Average Value
LOANS ORIGINATED
6
$99,428
59
$90,629
61
$81,731
43
$30,466
13
$75,282
14
$45,953
APPLICATIONS APPROVED, NOT ACCEPTED
2
$113,980
20
$78,032
23
$60,663
10
$38,785
4
$46,908
11
$64,043
APPLICATIONS DENIED
2
$93,045
49
$97,670
135
$73,992
102
$45,384
15
$63,455
32
$60,592
APPLICATIONS WITHDRAWN
1
$153,420
9
$79,889
52
$75,292
16
$50,634
5
$103,510
4
$60,425
FILES CLOSED FOR INCOMPLETENESS
0
$0
3
$65,533
12
$78,194
3
$61,177
0
$0
0
$0
Aggregated Statistics For Year 2006 (Based on 8 partial tracts)
A) FHA, FSA/RHS & VA Home Purchase Loans
B) Conventional Home Purchase Loans
C) Refinancings
D) Home Improvement Loans
F) Non-occupant Loans on < 5 Family Dwellings (A B C & D)
G) Loans On Manufactured Home Dwelling (A B C & D)
Number
Average Value
Number
Average Value
Number
Average Value
Number
Average Value
Number
Average Value
Number
Average Value
LOANS ORIGINATED
10
$80,382
118
$73,405
68
$73,952
43
$29,487
26
$71,223
9
$34,934
APPLICATIONS APPROVED, NOT ACCEPTED
2
$68,515
36
$67,262
17
$62,276
11
$21,469
6
$52,677
13
$48,714
APPLICATIONS DENIED
3
$60,347
67
$59,453
144
$67,905
87
$34,090
19
$57,377
30
$34,753
APPLICATIONS WITHDRAWN
1
$88,900
25
$85,225
70
$77,212
20
$38,064
7
$56,181
0
$0
FILES CLOSED FOR INCOMPLETENESS
0
$0
0
$0
14
$122,078
2
$18,030
0
$0
0
$0
Aggregated Statistics For Year 2005 (Based on 8 partial tracts)
A) FHA, FSA/RHS & VA Home Purchase Loans
B) Conventional Home Purchase Loans
C) Refinancings
D) Home Improvement Loans
F) Non-occupant Loans on < 5 Family Dwellings (A B C & D)
G) Loans On Manufactured Home Dwelling (A B C & D)
Number
Average Value
Number
Average Value
Number
Average Value
Number
Average Value
Number
Average Value
Number
Average Value
LOANS ORIGINATED
20
$67,880
104
$73,237
73
$64,108
40
$35,306
16
$63,371
12
$45,114
APPLICATIONS APPROVED, NOT ACCEPTED
1
$52,460
20
$63,616
27
$49,913
10
$47,674
5
$35,144
9
$42,013
APPLICATIONS DENIED
2
$59,915
55
$57,099
172
$59,591
74
$32,074
21
$58,078
34
$42,000
APPLICATIONS WITHDRAWN
6
$84,275
18
$132,551
69
$63,568
25
$98,142
12
$118,894
2
$43,905
FILES CLOSED FOR INCOMPLETENESS
1
$23,190
3
$65,550
16
$68,871
4
$28,492
3
$58,757
1
$95,620
Aggregated Statistics For Year 2004 (Based on 8 partial tracts)
A) FHA, FSA/RHS & VA Home Purchase Loans
B) Conventional Home Purchase Loans
C) Refinancings
D) Home Improvement Loans
F) Non-occupant Loans on < 5 Family Dwellings (A B C & D)
G) Loans On Manufactured Home Dwelling (A B C & D)
Number
Average Value
Number
Average Value
Number
Average Value
Number
Average Value
Number
Average Value
Number
Average Value
LOANS ORIGINATED
48
$68,599
51
$53,166
91
$61,855
50
$21,501
11
$57,149
16
$46,904
APPLICATIONS APPROVED, NOT ACCEPTED
4
$119,575
17
$46,415
29
$49,639
11
$20,669
2
$93,935
12
$51,564
APPLICATIONS DENIED
14
$76,619
55
$54,134
156
$65,860
71
$21,681
9
$73,879
30
$43,679
APPLICATIONS WITHDRAWN
9
$67,394
15
$45,771
86
$61,899
16
$36,337
2
$72,615
5
$34,164
FILES CLOSED FOR INCOMPLETENESS
0
$0
1
$76,200
14
$78,441
1
$17,930
1
$35,340
0
$0
Aggregated Statistics For Year 2003 (Based on 8 partial tracts)
A) FHA, FSA/RHS & VA Home Purchase Loans
B) Conventional Home Purchase Loans
C) Refinancings
D) Home Improvement Loans
E) Loans on Dwellings For 5+ Families
F) Non-occupant Loans on < 5 Family Dwellings (A B C & D)
Number
Average Value
Number
Average Value
Number
Average Value
Number
Average Value
Number
Average Value
Number
Average Value
LOANS ORIGINATED
22
$79,269
34
$65,112
83
$63,501
47
$10,444
0
$0
6
$56,220
APPLICATIONS APPROVED, NOT ACCEPTED
1
$45,830
15
$60,142
12
$69,553
3
$5,700
0
$0
3
$72,280
APPLICATIONS DENIED
4
$92,748
46
$51,699
117
$58,890
41
$13,669
1
$82,830
12
$53,448
APPLICATIONS WITHDRAWN
0
$0
10
$45,978
68
$55,930
11
$6,099
0
$0
3
$56,230
FILES CLOSED FOR INCOMPLETENESS
0
$0
0
$0
5
$88,116
0
$0
0
$0
0
$0
Aggregated Statistics For Year 2002 (Based on 4 partial tracts)
A) FHA, FSA/RHS & VA Home Purchase Loans
B) Conventional Home Purchase Loans
C) Refinancings
D) Home Improvement Loans
F) Non-occupant Loans on < 5 Family Dwellings (A B C & D)
Number
Average Value
Number
Average Value
Number
Average Value
Number
Average Value
Number
Average Value
LOANS ORIGINATED
8
$71,805
22
$60,220
50
$55,569
29
$14,624
3
$49,433
APPLICATIONS APPROVED, NOT ACCEPTED
1
$148,200
19
$44,239
16
$49,204
4
$32,305
4
$36,670
APPLICATIONS DENIED
1
$53,010
38
$48,861
57
$54,581
31
$16,645
3
$68,727
APPLICATIONS WITHDRAWN
1
$59,640
1
$109,960
31
$54,084
6
$26,325
0
$0
FILES CLOSED FOR INCOMPLETENESS
0
$0
5
$69,082
4
$71,412
0
$0
0
$0
Aggregated Statistics For Year 2001 (Based on 4 partial tracts)
A) FHA, FSA/RHS & VA Home Purchase Loans
B) Conventional Home Purchase Loans
C) Refinancings
D) Home Improvement Loans
F) Non-occupant Loans on < 5 Family Dwellings (A B C & D)
Number
Average Value
Number
Average Value
Number
Average Value
Number
Average Value
Number
Average Value
LOANS ORIGINATED
2
$60,925
42
$44,785
46
$55,066
46
$10,190
6
$46,980
APPLICATIONS APPROVED, NOT ACCEPTED
0
$0
25
$39,897
7
$56,956
4
$11,592
1
$96,810
APPLICATIONS DENIED
2
$99,615
52
$41,006
42
$53,083
22
$11,399
7
$42,393
APPLICATIONS WITHDRAWN
0
$0
7
$68,520
25
$44,788
14
$10,592
1
$135,060
FILES CLOSED FOR INCOMPLETENESS
0
$0
0
$0
2
$76,480
0
$0
0
$0
Aggregated Statistics For Year 2000 (Based on 4 partial tracts)
A) FHA, FSA/RHS & VA Home Purchase Loans
B) Conventional Home Purchase Loans
C) Refinancings
D) Home Improvement Loans
F) Non-occupant Loans on < 5 Family Dwellings (A B C & D)
Number
Average Value
Number
Average Value
Number
Average Value
Number
Average Value
Number
Average Value
LOANS ORIGINATED
8
$68,935
66
$42,873
27
$52,090
9
$10,182
3
$60,830
APPLICATIONS APPROVED, NOT ACCEPTED
8
$60,439
27
$39,556
6
$56,440
2
$25,430
2
$35,405
APPLICATIONS DENIED
6
$62,112
155
$40,322
19
$59,491
12
$8,120
3
$36,920
APPLICATIONS WITHDRAWN
1
$53,780
16
$48,176
8
$58,144
4
$22,685
2
$47,590
FILES CLOSED FOR INCOMPLETENESS
1
$71,230
3
$62,557
8
$66,776
0
$0
0
$0
Aggregated Statistics For Year 1999 (Based on 3 partial tracts)
A) FHA, FSA/RHS & VA Home Purchase Loans
B) Conventional Home Purchase Loans
C) Refinancings
D) Home Improvement Loans
F) Non-occupant Loans on < 5 Family Dwellings (A B C & D)
2002 - 2018 National Fire Incident Reporting System (NFIRS) incidents
According to the data from the years 2002 - 2018 the average number of fire incidents per year is 40. The highest number of reported fires - 83 took place in 2008, and the least - 17 in 2002. The data has a constant trend.
When looking into fire subcategories, the most reports belonged to: Outside Fires (53.6%), and Other (20.4%).
Fire incident types reported to NFIRS in Zip Code 79836


+$6,907
-$9,403
(% of AGI for various income ranges: 1.6% for AGIs below $10k, 0.0% for AGIs $50k-75k, 1.8% for AGIs over 100k)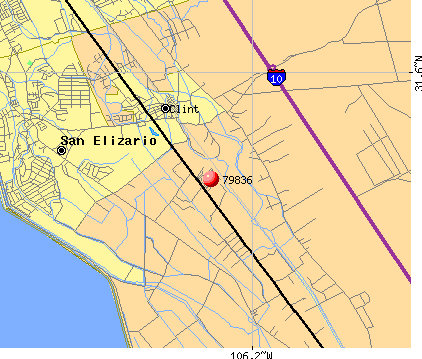 Nearest zip codes: 79849, 79928, 79838, 79927, 79907, 79853.
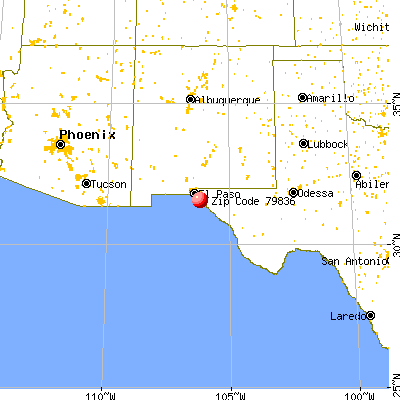
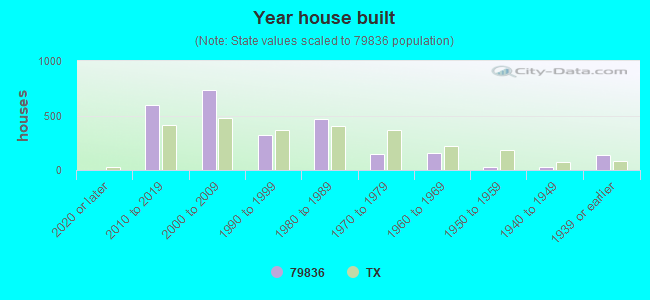


 According to the data from the years 2002 - 2018 the average number of fire incidents per year is 40. The highest number of reported fires - 83 took place in 2008, and the least - 17 in 2002. The data has a constant trend.
 When looking into fire subcategories, the most reports belonged to: Outside Fires (53.6%), and Other (20.4%).