Percentage of residents living in poverty in 2022: 28.5%
(19.7% for White Non-Hispanic residents, 28.9% for Hispanic or Latino residents, 18.3% for other race residents, 29.3% for two or more races residents)
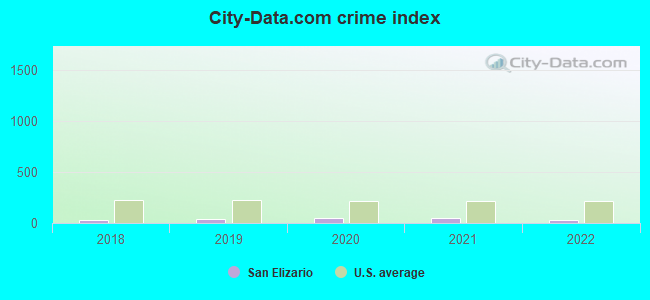
The City-Data.com crime index weighs serious crimes and violent crimes more heavily. Higher means more crime, U.S. average is 246.1. It adjusts for the number of visitors and daily workers commuting into cities.
Latest news from San Elizario, TX collected exclusively by city-data.com from local newspapers, TV, and radio stations
Current Local Time: MST time zone
Land area: 9.93 square miles.
Population density: 1,021 people per square mile (low).
3,300 residents are foreign born (31.3% Latin America).
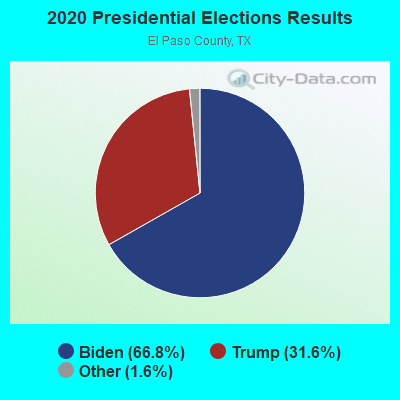
This place:
32.6%
Texas:
17.1%
Median real estate property taxes paid for housing units with mortgages in 2022: $2,449 (2.1%) Median real estate property taxes paid for housing units with no mortgage in 2022: $1,445 (1.4%)
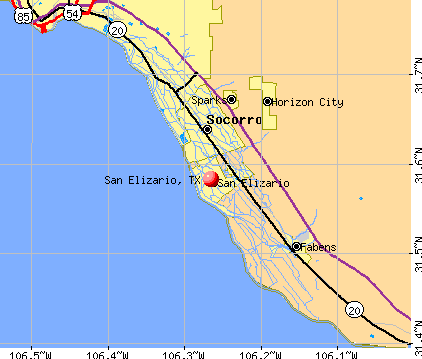
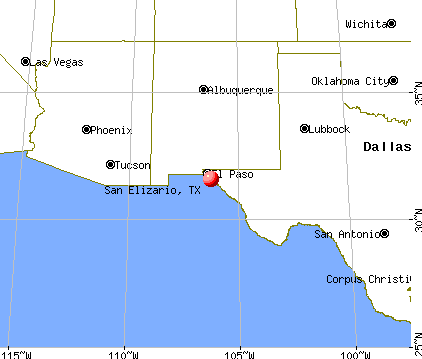
Nearest city with pop. 50,000+: El Paso, TX (17.1 miles , pop. 563,662).
Nearest city with pop. 1,000,000+: Phoenix, AZ (364.4 miles , pop. 1,321,045).
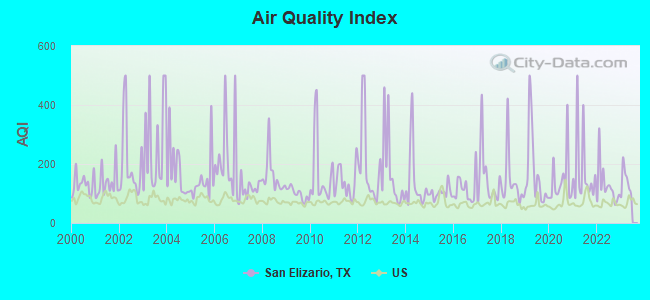
Air Quality Index (AQI) level in 2022 was 125. This is significantly worse than average.
City:
125
U.S.:
73
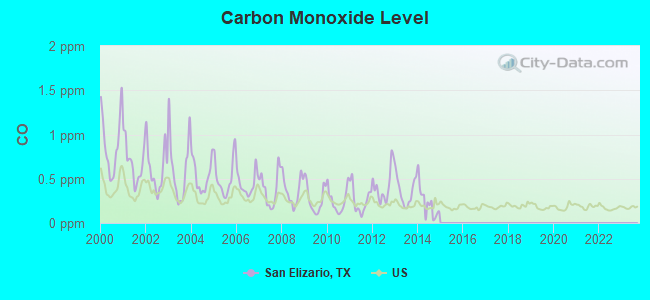
Carbon Monoxide (CO) [ppm] level in 2014 was 0.226. This is about average.Closest monitor was 6.0 miles away from the city center.
City:
0.226
U.S.:
0.251
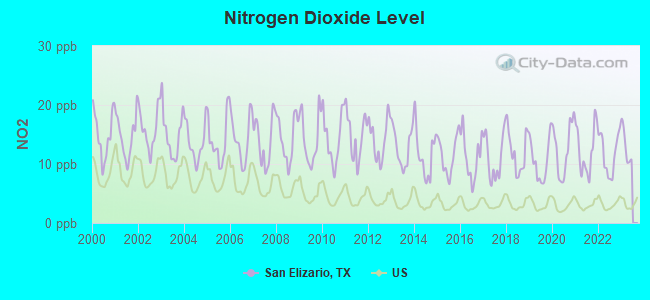
Nitrogen Dioxide (NO2) [ppb] level in 2022 was 11.7. This is significantly worse than average.Closest monitor was 6.0 miles away from the city center.
City:
11.7
U.S.:
5.1
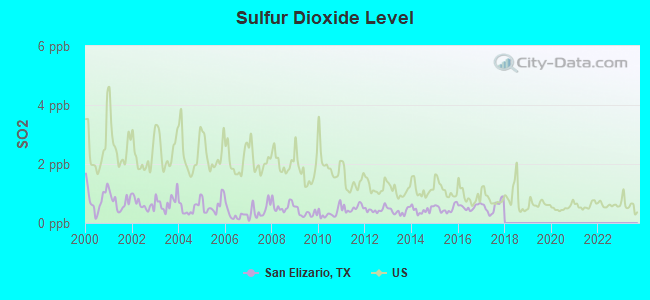
Sulfur Dioxide (SO2) [ppb] level in 2017 was 0.566. This is significantly better than average.Closest monitor was 6.0 miles away from the city center.
City:
0.566
U.S.:
1.515
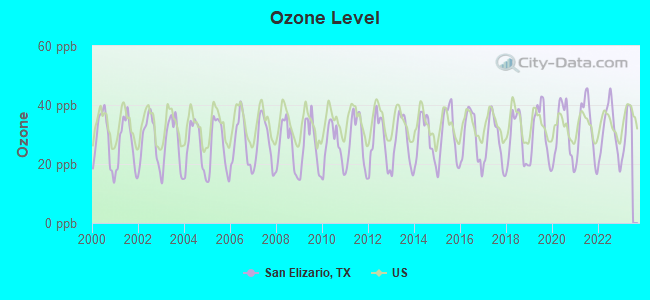
Ozone [ppb] level in 2022 was 31.1. This is about average.Closest monitor was 6.0 miles away from the city center.
City:
31.1
U.S.:
33.3
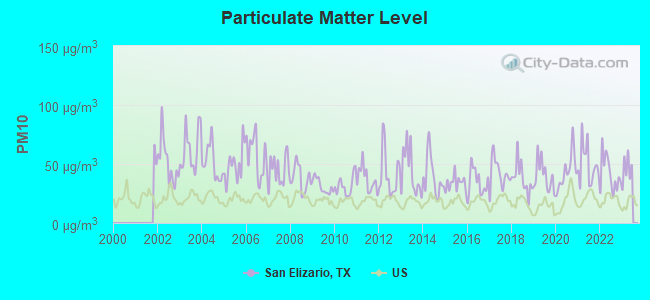
Particulate Matter (PM10) [µg/m3] level in 2022 was 41.7. This is significantly worse than average.Closest monitor was 5.0 miles away from the city center.
City:
41.7
U.S.:
19.2
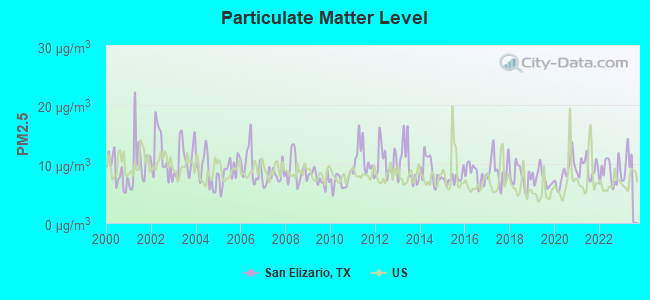
Particulate Matter (PM2.5) [µg/m3] level in 2022 was 8.69. This is about average.Closest monitor was 5.0 miles away from the city center.
City:
8.69
U.S.:
8.11
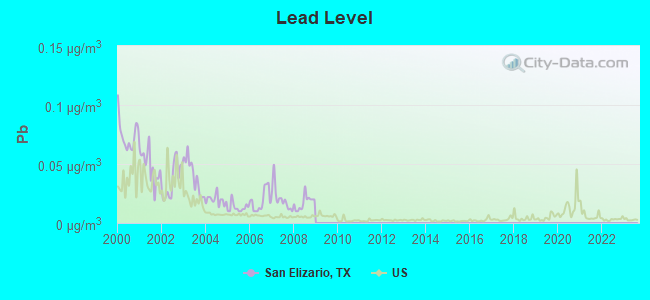
Lead (Pb) [µg/m3] level in 2008 was 0.0174. This is significantly worse than average.Closest monitor was 2.2 miles away from the city center.
City:
0.0174
U.S.:
0.0093
Earthquake activity:
San Elizario-area historical earthquake activity is significantly above Texas state average. It is 394% greater than the overall U.S. average.
On 4/14/1995 at 00:32:56, a magnitude 5.7 (5.6 MB, 5.7 MS, 5.7 MW, Depth: 11.1 mi, Class: Moderate, Intensity: VI - VII) earthquake occurred 194.2 miles away from San Elizario center On 1/4/2006 at 08:32:32, a magnitude 6.6 (6.6 MW, Depth: 8.7 mi, Class: Strong, Intensity: VII - IX) earthquake occurred 423.1 miles away from the city center On 6/29/2014 at 04:59:35, a magnitude 5.3 (5.3 MW, Depth: 4.0 mi) earthquake occurred 183.6 miles away from the city center On 3/26/2020 at 15:16:27, a magnitude 5.0 (5.0 MW, Depth: 5.9 mi) earthquake occurred 131.3 miles away from San Elizario center On 3/12/2003 at 23:41:32, a magnitude 6.4 (6.4 MW, Depth: 6.2 mi) earthquake occurred 434.8 miles away from San Elizario center On 5/19/1940 at 04:36:40, a magnitude 7.2 (7.2 UK, Class: Major, Intensity: VIII - XII) earthquake occurred 562.1 miles away from San Elizario center, causing $33,000,000 total damage Magnitude types: body-wave magnitude (MB), surface-wave magnitude (MS), moment magnitude (MW)
Natural disasters:
The number of natural disasters in El Paso County (11) is smaller than the US average (15). Major Disasters (Presidential) Declared: 3 Emergencies Declared: 7
Causes of natural disasters: Hurricanes: 5, Fires: 2, Floods: 2, Storm: 1, Other: 2 (Note: some incidents may be assigned to more than one category).
Hospitals and medical centers near San Elizario:
NEW MISSION HOME CARE (Home Health Center, about 2 miles away; CLINT, TX)
NEW HOPE COMMUNITY LIVING V I (Hospital, about 9 miles away; EL PASO, TX)
FRESENIUS MEDICAL CARE HORIZON DIALYSIS (Dialysis Facility, about 9 miles away; EL PASO, TX)
ALMAR HOME HEALTH CARE CORP (Home Health Center, about 10 miles away; EL PASO, TX)
REVIVE HOME CARE INC (Home Health Center, about 11 miles away; EL PASO, TX)
HIGHLANDS REGIONAL REHABILITATION HOSPITAL (Hospital, about 11 miles away; EL PASO, TX)
FOUNDATION SURGICAL HOSPITAL OF EL PASO Acute Care Hospitals (about 11 miles away; EL PASO, TX)
Amtrak station near San Elizario:
19 miles: EL PASO (700 SAN FRANCISCO AVE.) . Services: ticket office, fully wheelchair accessible, enclosed waiting area, public restrooms, public payphones, vending machines, free short-term parking, paid long-term parking, call for car rental service, taxi stand, public transit connection.
Colleges/universities with over 2000 students nearest to San Elizario:
El Paso Community College (about 15 miles; El Paso, TX; Full-time enrollment: 19,576)
Vista College (about 17 miles; El Paso, TX; FT enrollment: 3,453)
The University of Texas at El Paso (about 20 miles; El Paso, TX; FT enrollment: 18,008)
New Mexico State University-Dona Ana (about 56 miles; Las Cruces, NM; FT enrollment: 5,640)
New Mexico State University-Main Campus (about 57 miles; Las Cruces, NM; FT enrollment: 14,497)
Western New Mexico University (about 145 miles; Silver City, NM; FT enrollment: 2,456)
Eastern New Mexico University-Roswell Campus (about 158 miles; Roswell, NM; FT enrollment: 2,212)
Public high school in San Elizario:
SAN ELIZARIO H S(Students: 1,113, Location: 13981 SOCORRO RD, Grades: 9-12)
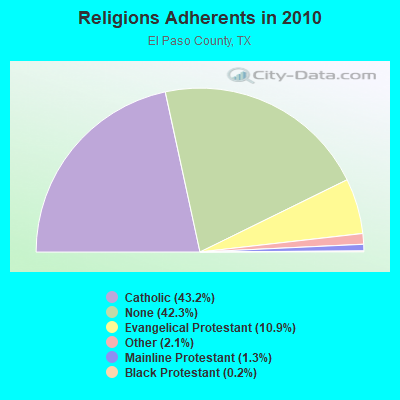
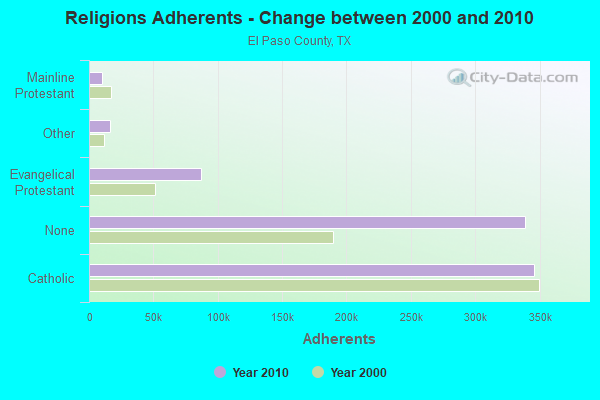
Religion statistics for San Elizario, TX (based on El Paso County data)
Religion
Adherents
Congregations
Catholic
345,950
55
Evangelical Protestant
87,056
329
Other
16,675
40
Mainline Protestant
10,145
46
Black Protestant
1,703
12
Orthodox
647
3
None
338,471
-
Source: Clifford Grammich, Kirk Hadaway, Richard Houseal, Dale E.Jones, Alexei Krindatch, Richie Stanley and Richard H.Taylor. 2012. 2010 U.S.Religion Census: Religious Congregations & Membership Study. Association of Statisticians of American Religious Bodies. Jones, Dale E., et al. 2002. Congregations and Membership in the United States 2000. Nashville, TN: Glenmary Research Center. Graphs represent county-level data
13,836Total future (year 2030) average daily traffic
FCC Registered Broadcast Land Mobile Towers:
1
Lat: 31.574889 Lon: -106.266167, Call Sign: KNNR521, Assigned Frequencies: 461.450 MHz, 463.400 MHz, 463.725 MHz, 464.675 MHz, 468.850 MHz, Grant Date: 05/12/2021, Expiration Date: 04/05/2031, Certifier: Frank G Duran, Registrant: Business Radio Licensing, 30251 Golden Lantern, Suite E # 501, Laguna Niguel, CA 92677, Phone: (949) 348-8510, Fax: (949) 348-8514, Email:
FCC Registered Microwave Towers:
1
Riverside, 14290 Riverside (Lat: 31.546806 Lon: -106.241194), Type: Pole, Structure height: 18.3 m, Call Sign: WRAX331, Assigned Frequencies: 11565.0 MHz, 11565.0 MHz, 11565.0 MHz, 11565.0 MHz, 11565.0 MHz, 11565.0 MHz, 11565.0 MHz, 11565.0 MHz, Grant Date: 04/02/2018, Expiration Date: 04/02/2028, Certifier: Mario Aguirre, Registrant: Mission Valley Communications, LLC., 460 E Main St, Fabens, TX 79838, Phone: (915) 764-4400, Email:
FCC Registered Amateur Radio Licenses:
3
Call Sign: KB5DKS, Licensee ID: L01471312, Grant Date: 01/30/2019, Expiration Date: 03/23/2029, Certifier: Enrique I Maese, Registrant: Enrique I Maese, 12878 Socorro Rd, San Elizario, TX 79849
Call Sign: KB5HIC, Grant Date: 09/06/1988, Expiration Date: 09/06/1998, Cancellation Date: 09/07/2000, Registrant: Gerardo R Dena, San Elizario, TX 79849
Call Sign: KB5HID, Grant Date: 09/06/1988, Expiration Date: 09/06/1998, Cancellation Date: 09/07/2000, Registrant: Alma I Pena, San Elizario, TX 79849
Home Mortgage Disclosure Act Aggregated Statistics For Year 2009 (Based on 2 partial tracts)
A) FHA, FSA/RHS & VA Home Purchase Loans
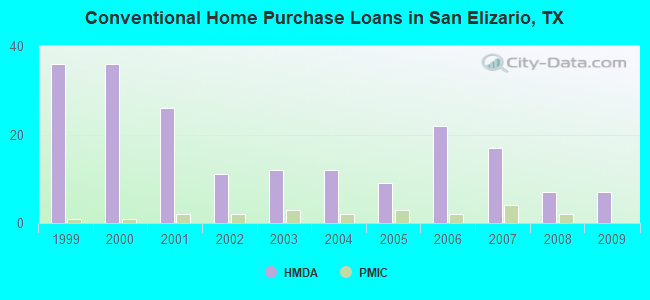
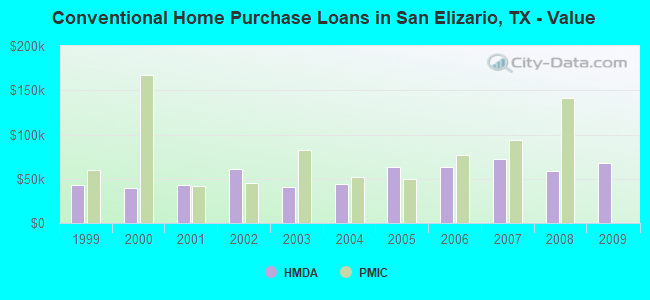
B) Conventional Home Purchase Loans
C) Refinancings
D) Home Improvement Loans
E) Loans on Dwellings For 5+ Families
F) Non-occupant Loans on < 5 Family Dwellings (A B C & D)
G) Loans On Manufactured Home Dwelling (A B C & D)
Number
Average Value
Number
Average Value
Number
Average Value
Number
Average Value
Number
Average Value
Number
Average Value
Number
Average Value
LOANS ORIGINATED
10
$108,221
7
$67,713
15
$78,402
17
$15,776
1
$444,150
2
$63,040
4
$45,088
APPLICATIONS APPROVED, NOT ACCEPTED
2
$66,195
2
$48,345
6
$67,788
3
$21,013
0
$0
0
$0
4
$52,808
APPLICATIONS DENIED
2
$70,490
8
$56,454
32
$59,858
28
$24,402
0
$0
1
$36,460
5
$50,756
APPLICATIONS WITHDRAWN
2
$104,020
1
$55,940
9
$56,492
1
$51,800
1
$1,891,230
1
$58,460
0
$0
FILES CLOSED FOR INCOMPLETENESS
0
$0
1
$70,490
2
$58,170
0
$0
0
$0
0
$0
1
$29,230
Aggregated Statistics For Year 2008 (Based on 2 partial tracts)
A) FHA, FSA/RHS & VA Home Purchase Loans
B) Conventional Home Purchase Loans
C) Refinancings
D) Home Improvement Loans
F) Non-occupant Loans on < 5 Family Dwellings (A B C & D)
G) Loans On Manufactured Home Dwelling (A B C & D)
Number
Average Value
Number
Average Value
Number
Average Value
Number
Average Value
Number
Average Value
Number
Average Value
LOANS ORIGINATED
12
$113,818
7
$58,667
27
$60,898
23
$18,382
2
$52,440
4
$48,078
APPLICATIONS APPROVED, NOT ACCEPTED
0
$0
5
$61,092
8
$39,806
6
$43,497
1
$28,660
3
$61,377
APPLICATIONS DENIED
6
$91,410
10
$58,877
59
$61,154
45
$32,856
1
$46,510
7
$74,494
APPLICATIONS WITHDRAWN
1
$97,430
1
$62,140
18
$62,811
6
$36,260
2
$34,235
1
$20,090
FILES CLOSED FOR INCOMPLETENESS
0
$0
1
$51,390
2
$32,070
1
$32,090
0
$0
1
$38,970
Aggregated Statistics For Year 2007 (Based on 2 partial tracts)
A) FHA, FSA/RHS & VA Home Purchase Loans
B) Conventional Home Purchase Loans
C) Refinancings
D) Home Improvement Loans
F) Non-occupant Loans on < 5 Family Dwellings (A B C & D)
G) Loans On Manufactured Home Dwelling (A B C & D)
Number
Average Value
Number
Average Value
Number
Average Value
Number
Average Value
Number
Average Value
Number
Average Value
LOANS ORIGINATED
3
$88,947
17
$72,692
26
$61,378
21
$27,678
3
$62,420
7
$33,814
APPLICATIONS APPROVED, NOT ACCEPTED
0
$0
8
$61,132
9
$63,242
5
$20,578
1
$44,220
4
$39,572
APPLICATIONS DENIED
2
$74,215
23
$70,085
72
$61,707
55
$37,763
13
$57,017
12
$40,433
APPLICATIONS WITHDRAWN
0
$0
7
$60,189
21
$64,223
9
$43,293
4
$43,555
2
$47,315
FILES CLOSED FOR INCOMPLETENESS
1
$48,710
1
$52,100
6
$91,315
3
$62,723
0
$0
1
$11,460
Aggregated Statistics For Year 2006 (Based on 2 partial tracts)
A) FHA, FSA/RHS & VA Home Purchase Loans
B) Conventional Home Purchase Loans
C) Refinancings
D) Home Improvement Loans
F) Non-occupant Loans on < 5 Family Dwellings (A B C & D)
G) Loans On Manufactured Home Dwelling (A B C & D)
Number
Average Value
Number
Average Value
Number
Average Value
Number
Average Value
Number
Average Value
Number
Average Value
LOANS ORIGINATED
0
$0
22
$63,104
29
$64,861
20
$26,367
3
$52,253
6
$40,498
APPLICATIONS APPROVED, NOT ACCEPTED
0
$0
7
$82,643
8
$53,542
6
$14,043
1
$88,830
6
$62,560
APPLICATIONS DENIED
2
$33,815
23
$52,942
53
$56,787
59
$31,100
10
$45,714
13
$43,155
APPLICATIONS WITHDRAWN
0
$0
3
$74,327
29
$59,933
7
$40,643
1
$38,970
1
$49,290
FILES CLOSED FOR INCOMPLETENESS
0
$0
0
$0
2
$57,605
1
$11,460
0
$0
0
$0
Aggregated Statistics For Year 2005 (Based on 2 partial tracts)
A) FHA, FSA/RHS & VA Home Purchase Loans
B) Conventional Home Purchase Loans
C) Refinancings
D) Home Improvement Loans
E) Loans on Dwellings For 5+ Families
F) Non-occupant Loans on < 5 Family Dwellings (A B C & D)
G) Loans On Manufactured Home Dwelling (A B C & D)
Number
Average Value
Number
Average Value
Number
Average Value
Number
Average Value
Number
Average Value
Number
Average Value
Number
Average Value
LOANS ORIGINATED
2
$96,435
9
$63,379
30
$52,891
19
$24,764
0
$0
2
$39,545
3
$56,047
APPLICATIONS APPROVED, NOT ACCEPTED
0
$0
8
$47,571
10
$53,997
5
$29,128
0
$0
0
$0
7
$44,473
APPLICATIONS DENIED
1
$49,290
18
$46,879
78
$50,567
52
$21,671
0
$0
7
$35,150
12
$42,187
APPLICATIONS WITHDRAWN
1
$21,780
4
$76,308
26
$67,148
10
$116,554
1
$581,700
1
$142,030
1
$65,110
FILES CLOSED FOR INCOMPLETENESS
1
$49,860
2
$36,105
3
$61,703
0
$0
0
$0
0
$0
0
$0
Aggregated Statistics For Year 2004 (Based on 2 partial tracts)
A) FHA, FSA/RHS & VA Home Purchase Loans
B) Conventional Home Purchase Loans
C) Refinancings
D) Home Improvement Loans
F) Non-occupant Loans on < 5 Family Dwellings (A B C & D)
G) Loans On Manufactured Home Dwelling (A B C & D)
Number
Average Value
Number
Average Value
Number
Average Value
Number
Average Value
Number
Average Value
Number
Average Value
LOANS ORIGINATED
3
$52,933
12
$43,847
34
$48,416
19
$18,735
4
$31,258
6
$33,360
APPLICATIONS APPROVED, NOT ACCEPTED
1
$52,560
5
$43,266
12
$39,678
3
$27,363
0
$0
6
$34,497
APPLICATIONS DENIED
0
$0
19
$45,999
69
$55,098
32
$16,342
4
$67,688
18
$41,186
APPLICATIONS WITHDRAWN
1
$44,700
1
$54,680
33
$49,612
11
$34,245
0
$0
2
$27,805
FILES CLOSED FOR INCOMPLETENESS
0
$0
1
$67,050
2
$109,440
1
$45,850
0
$0
0
$0
Aggregated Statistics For Year 2003 (Based on 2 partial tracts)
A) FHA, FSA/RHS & VA Home Purchase Loans
B) Conventional Home Purchase Loans
C) Refinancings
D) Home Improvement Loans
F) Non-occupant Loans on < 5 Family Dwellings (A B C & D)
Number
Average Value
Number
Average Value
Number
Average Value
Number
Average Value
Number
Average Value
LOANS ORIGINATED
5
$77,352
12
$40,664
47
$42,778
20
$5,614
3
$52,917
APPLICATIONS APPROVED, NOT ACCEPTED
0
$0
4
$54,022
11
$57,438
3
$14,137
0
$0
APPLICATIONS DENIED
1
$33,810
19
$43,048
54
$47,230
23
$9,681
3
$37,223
APPLICATIONS WITHDRAWN
2
$61,320
3
$70,890
37
$55,073
4
$11,578
1
$140,980
FILES CLOSED FOR INCOMPLETENESS
1
$53,300
0
$0
1
$44,670
0
$0
0
$0
Aggregated Statistics For Year 2002 (Based on 1 partial tract)
A) FHA, FSA/RHS & VA Home Purchase Loans
B) Conventional Home Purchase Loans
C) Refinancings
D) Home Improvement Loans
F) Non-occupant Loans on < 5 Family Dwellings (A B C & D)
Number
Average Value
Number
Average Value
Number
Average Value
Number
Average Value
Number
Average Value
LOANS ORIGINATED
3
$93,607
11
$60,801
23
$46,546
10
$7,737
2
$92,840
APPLICATIONS APPROVED, NOT ACCEPTED
0
$0
5
$47,912
2
$40,115
3
$7,260
0
$0
APPLICATIONS DENIED
1
$42,980
15
$38,245
37
$40,535
24
$12,656
1
$5,730
APPLICATIONS WITHDRAWN
0
$0
0
$0
28
$39,728
7
$22,760
1
$25,220
FILES CLOSED FOR INCOMPLETENESS
0
$0
0
$0
4
$43,842
1
$4,010
0
$0
Aggregated Statistics For Year 2001 (Based on 1 partial tract)
A) FHA, FSA/RHS & VA Home Purchase Loans
B) Conventional Home Purchase Loans
C) Refinancings
D) Home Improvement Loans
F) Non-occupant Loans on < 5 Family Dwellings (A B C & D)
Number
Average Value
Number
Average Value
Number
Average Value
Number
Average Value
Number
Average Value
LOANS ORIGINATED
3
$52,153
26
$43,423
17
$41,601
21
$11,899
2
$34,960
APPLICATIONS APPROVED, NOT ACCEPTED
0
$0
11
$39,753
3
$66,670
0
$0
0
$0
APPLICATIONS DENIED
0
$0
41
$41,878
34
$43,134
15
$12,914
0
$0
APPLICATIONS WITHDRAWN
0
$0
2
$43,555
21
$35,041
9
$17,002
0
$0
FILES CLOSED FOR INCOMPLETENESS
0
$0
1
$41,840
6
$42,983
0
$0
0
$0
Aggregated Statistics For Year 2000 (Based on 1 partial tract)
A) FHA, FSA/RHS & VA Home Purchase Loans
B) Conventional Home Purchase Loans
C) Refinancings
D) Home Improvement Loans
F) Non-occupant Loans on < 5 Family Dwellings (A B C & D)
Number
Average Value
Number
Average Value
Number
Average Value
Number
Average Value
Number
Average Value
LOANS ORIGINATED
3
$47,567
36
$39,767
15
$38,856
7
$10,316
5
$46,078
APPLICATIONS APPROVED, NOT ACCEPTED
3
$42,600
13
$38,971
2
$31,235
1
$24,640
0
$0
APPLICATIONS DENIED
5
$34,960
62
$35,338
17
$36,510
9
$9,424
1
$34,390
APPLICATIONS WITHDRAWN
2
$25,505
3
$47,377
7
$33,403
3
$1,910
0
$0
FILES CLOSED FOR INCOMPLETENESS
0
$0
1
$16,050
7
$34,796
0
$0
0
$0
Aggregated Statistics For Year 1999 (Based on 1 partial tract)
A) FHA, FSA/RHS & VA Home Purchase Loans
B) Conventional Home Purchase Loans
C) Refinancings
D) Home Improvement Loans
F) Non-occupant Loans on < 5 Family Dwellings (A B C & D)
Detailed PMIC statistics for the following Tracts:0104.03
, 0105.01
2003 - 2018 National Fire Incident Reporting System (NFIRS) incidents
Based on the data from the years 2003 - 2018 the average number of fires per year is 20. The highest number of reported fires - 58 took place in 2011, and the least - 0 in 2005. The data has a rising trend.
When looking into fire subcategories, the most reports belonged to: Outside Fires (39.6%), and Structure Fires (34.5%).
Fire incident types reported to NFIRS in San Elizario, TX
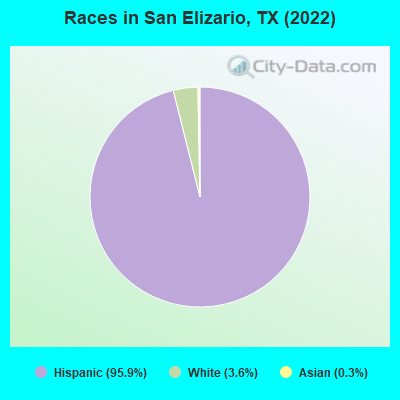
#5 on the list of "Top 100 least racially diverse cities (pop. 5,000+)"
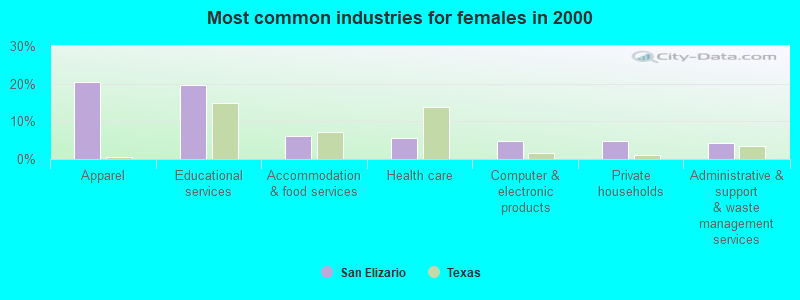
#10 on the list of "Top 101 cities with largest percentage of females in industries: administrative and support and waste management services (population 5,000+)"
#15 on the list of "Top 101 cities with the lowest percentage of English-only speaking households, population 5,000+"
#26 on the list of "Top 101 cities with the least people having Master's or Doctorate degrees (population 5,000+)"
#36 on the list of "Top 101 cities with the highest percentage of family households, population 10,000+"
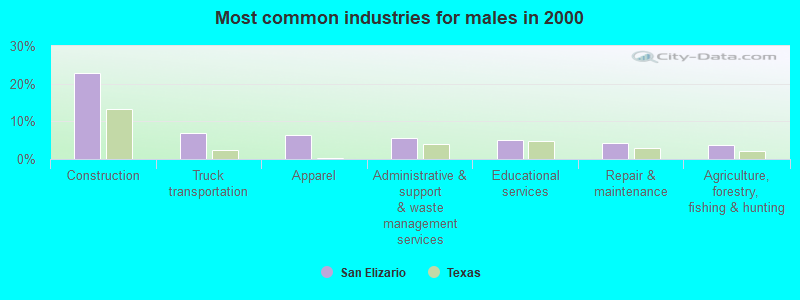
#37 on the list of "Top 101 cities with largest percentage of males in industries: construction (population 5,000+)"
#38 on the list of "Top 101 cities with largest percentage of males in occupations: construction and extraction occupations (population 5,000+)"
#49 on the list of "Top 100 least-educated cities (pop. 5,000+)"
#66 on the list of "Top 101 cities with largest percentage of females in occupations: building and grounds cleaning and maintenance occupations (population 5,000+)"
#92 on the list of "Top 101 cities with largest percentage of males in occupations: material moving occupations (population 5,000+)"
#4 (79849) on the list of "Top 101 zip codes with the smallest percentage of taxpayers reporting taxable interest in 2012 (pop 5,000+)"
#9 (79849) on the list of "Top 101 zip codes with the lowest charity contributions deductions as a percentage of AGI in 2012 (pop 5,000+)"
#37 (79849) on the list of "Top 101 zip codes with the smallest percentage of taxpayers using charity contributions deductions in 2012 (pop 5,000+)"
#44 (79849) on the list of "Top 101 zip codes with the lowest 2012 average taxable interest for individuals (pop 5,000+)"
#81 (79849) on the list of "Top 101 zip codes with the largest percentage of Irish first ancestries"
#2 on the list of "Top 101 counties with the lowest percentage of residents that visited a dentist within the past year"
#9 on the list of "Top 101 counties with the worst general health status score of residents (1-5), 3 years of data"
#18 on the list of "Top 101 counties with the highest Particulate Matter (PM10) Annual air pollution readings in 2012 (µg/m3)"
#19 on the list of "Top 101 counties with the lowest percentage of residents that smoked 100+ cigarettes in their lives"
#24 on the list of "Top 101 counties with the highest number of births per 1000 residents 2007-2013"


 Recent articles from our blog. Our writers, many of them Ph.D. graduates or candidates, create easy-to-read articles on a wide variety of topics.


 (17.1 miles

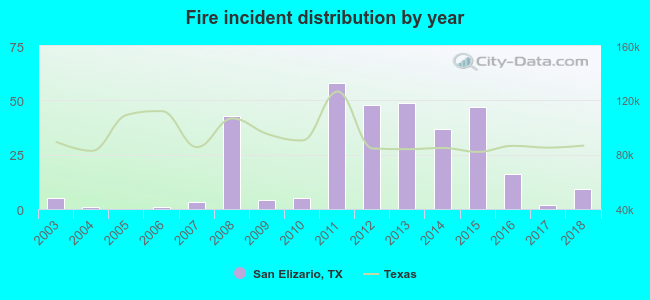 Based on the data from the years 2003 - 2018 the average number of fires per year is 20. The highest number of reported fires - 58 took place in 2011, and the least - 0 in 2005. The data has a rising trend.
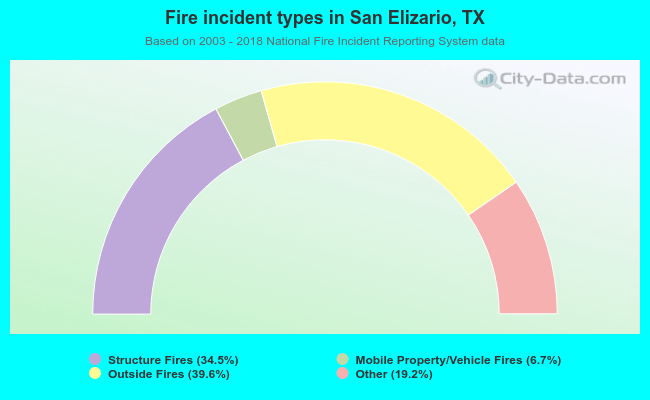 When looking into fire subcategories, the most reports belonged to: Outside Fires (39.6%), and Structure Fires (34.5%).