Estimated zip code population in 2022: 5,669 Zip code population in 2010: 4,965 Zip code population in 2000: 4,905
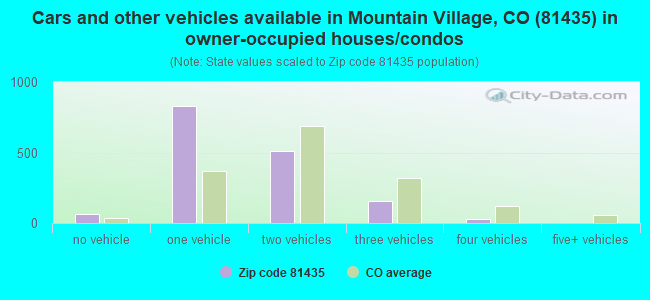
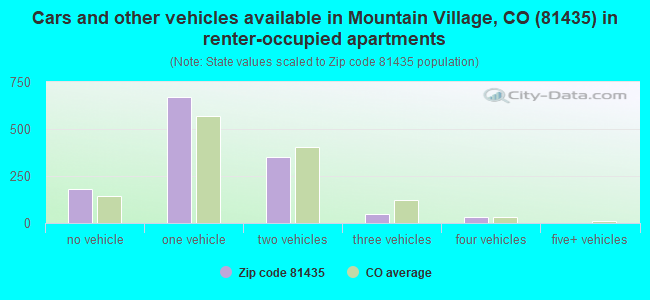
Houses and condos: 5,192 Renter-occupied apartments: 1,288
% of renters here:
45%
State:
34%
March 2022 cost of living index in zip code 81435: 98.5 (near average, U.S. average is 100)
Land area: 133.8 sq. mi. Water area: 0.4 sq. mi.
Population density: 42 people per square mile
(very low).
OSM Map
General Map
Google Map
MSN Map
OSM Map
General Map
Google Map
MSN Map
OSM Map
General Map
Google Map
MSN Map
OSM Map
General Map
Google Map
MSN Map
Please wait while loading the map...
Real estate property taxes paid for housing units in 2022:
This zip code:
0.2% ($1,677)
Colorado:
0.5% ($2,422)
Median real estate property taxes paid for housing units with mortgages in 2022: $1,380 (0.2%) Median real estate property taxes paid for housing units with no mortgage in 2022: $3,344 (0.3%)
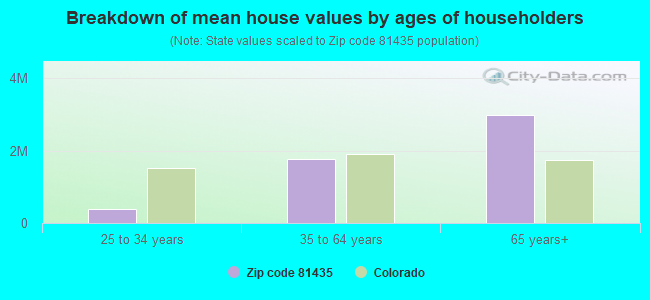
Estimated median house/condo value in 2022: $720,673
81435:
$720,673
Colorado:
$531,100
According to our research of Colorado and other state lists, there was 1 registered sex offender living in 81435 zip code as of April 25, 2024. The ratio of all residents to sex offenders in zip code 81435 is 5,213 to 1. The ratio of registered sex offenders to all residents in this zip code is much lower than the state average.
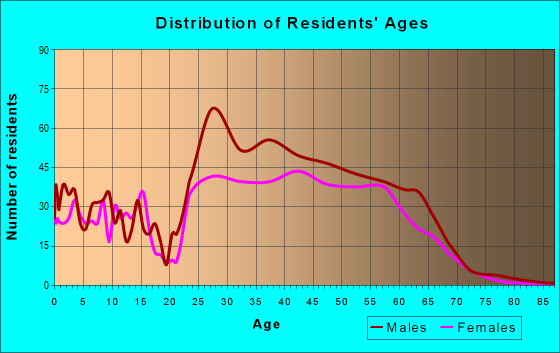
Median resident age:
This zip code:
38.7 years
Colorado median age:
37.7 years
Average household size:
This zip code:
2.0 people
Colorado:
2.4 people
Averages for the 2020 tax year for zip code 81435, filed in 2021:
Average Adjusted Gross Income (AGI) in 2020: $205,217 (Individual Income Tax Returns)
Here:
$205,217
State:
$89,260
Salary/wage: $69,857 (reported on 83.8% of returns)
Here:
$69,857
State:
$70,330
(% of AGI for various income ranges: 1465.5% for AGIs below $25k, 3793.8% for AGIs $25k-50k, 7650.7% for AGIs $50k-75k, 11204.6% for AGIs $75k-100k, 22650.7% for AGIs $100k-200k, 149335.0% for AGIs over 200k)
Taxable interest for individuals: $12,453 (reported on 36.8% of returns)
This zip code:
$12,453
Colorado:
$2,176
(% of AGI for various income ranges: 10.2% for AGIs below $25k, 23.0% for AGIs $25k-50k, 209.6% for AGIs $50k-75k, 176.2% for AGIs $75k-100k, 632.9% for AGIs $100k-200k, 21335.0% for AGIs over 200k)
Ordinary dividends: $36,823 (reported on 34.6% of returns)
Here:
$36,823
State:
$8,820
(% of AGI for various income ranges: 83.9% for AGIs below $25k, 100.0% for AGIs $25k-50k, 408.9% for AGIs $50k-75k, 643.1% for AGIs $75k-100k, 2155.0% for AGIs $100k-200k, 58061.7% for AGIs over 200k)
Net capital gain/loss in AGI: +$178,372 (reported on 35.5% of returns)
Here:
+$178,372
State:
+$37,276
(% of AGI for various income ranges: 128.8% for AGIs below $25k, 130.2% for AGIs $25k-50k, 327.1% for AGIs $50k-75k, 1023.8% for AGIs $75k-100k, 2890.7% for AGIs $100k-200k, 325998.3% for AGIs over 200k)
Profit/loss from business: +$34,213 (reported on 29.0% of returns)
Here:
+$34,213
State:
+$15,295
(% of AGI for various income ranges: 288.0% for AGIs below $25k, 430.5% for AGIs $25k-50k, 750.4% for AGIs $50k-75k, 1039.2% for AGIs $75k-100k, 3245.7% for AGIs $100k-200k, 32878.3% for AGIs over 200k)
Taxable individual retirement arrangement distribution: $26,789 (reported on 5.6% of returns)
81435:
$26,789
Colorado:
$23,785
(% of AGI for various income ranges: 52.1% for AGIs $25k-50k, 199.3% for AGIs $50k-75k, 950.7% for AGIs $100k-200k, 4358.3% for AGIs over 200k)
Self-employed (Keogh) retirement plans: $44,989 (reported on 2.8% of returns)
81435:
$44,989
Colorado:
$23,633
(% of AGI for various income ranges: 166.4% for AGIs $50k-75k, 5971.7% for AGIs over 200k)
Total itemized deductions: $72,107 (reported on 17.4% of returns)
Here:
$72,107
State:
$35,141
(% of AGI for various income ranges: 123.3% for AGIs below $25k, 152.0% for AGIs $25k-50k, 459.6% for AGIs $50k-75k, 1086.2% for AGIs $75k-100k, 2560.7% for AGIs $100k-200k, 54233.3% for AGIs over 200k)
Charity contributions: $45,202 (reported on 14.0% of returns)
Here:
$45,202
State:
$12,103
(% of AGI for various income ranges: 7.7% for AGIs $25k-50k, 18.2% for AGIs $50k-75k, 97.7% for AGIs $75k-100k, 296.4% for AGIs $100k-200k, 32835.0% for AGIs over 200k)
Taxes paid: $7,964 (reported on 17.4% of returns)
81435:
$7,964
State:
$7,710
(% of AGI for various income ranges: 24.1% for AGIs below $25k, 27.9% for AGIs $25k-50k, 85.7% for AGIs $50k-75k, 204.6% for AGIs $75k-100k, 638.6% for AGIs $100k-200k, 4611.7% for AGIs over 200k)
Earned income credit: $1,410 (reported on 6.5% of returns)
Here:
$1,410
State:
$2,053
(% of AGI for various income ranges: 40.4% for AGIs below $25k, 14.8% for AGIs $25k-50k)
Percentage of individuals using paid preparers for their 2020 taxes: 93.8%
Here:
94%
State:
93%
(% for various income ranges: 92.7% for AGIs below $25k, 92.9% for AGIs $25k-50k, 95.7% for AGIs $50k-75k, 91.7% for AGIs $75k-100k, 94.7% for AGIs $100k-200k, 95.6% for AGIs over 200k)
Averages for the 2012 tax year for zip code 81435, filed in 2013:
Average Adjusted Gross Income (AGI) in 2012: $87,027 (Individual Income Tax Returns)
Here:
$87,027
State:
$69,103
Salary/wage: $46,334 (reported on 83.7% of returns)
Here:
$46,334
State:
$54,794
(% of AGI for various income ranges: 84.5% for AGIs below $25k, 79.8% for AGIs $25k-50k, 71.6% for AGIs $50k-75k, 69.1% for AGIs $75k-100k, 53.7% for AGIs $100k-200k, 22.7% for AGIs over 200k)
Taxable interest for individuals: $7,148 (reported on 33.6% of returns)
This zip code:
$7,148
Colorado:
$1,971
(% of AGI for various income ranges: 2.8% for AGIs below $25k, 0.7% for AGIs $25k-50k, 1.1% for AGIs $50k-75k, 0.5% for AGIs $75k-100k, 2.0% for AGIs $100k-200k, 3.9% for AGIs over 200k)
Ordinary dividends: $18,521 (reported on 26.5% of returns)
Here:
$18,521
State:
$7,140
(% of AGI for various income ranges: 3.2% for AGIs below $25k, 1.7% for AGIs $25k-50k, 3.7% for AGIs $50k-75k, 4.1% for AGIs $75k-100k, 4.1% for AGIs $100k-200k, 7.7% for AGIs over 200k)
Net capital gain/loss in AGI: +$71,333 (reported on 24.7% of returns)
Here:
+$71,333
State:
+$23,009
(% of AGI for various income ranges: 0.3% for AGIs below $25k, 1.3% for AGIs $25k-50k, 2.3% for AGIs $50k-75k, 3.8% for AGIs $75k-100k, 5.3% for AGIs $100k-200k, 35.9% for AGIs over 200k)
Profit/loss from business: +$18,800 (reported on 31.8% of returns)
Here:
+$18,800
State:
+$13,514
(% of AGI for various income ranges: 14.7% for AGIs below $25k, 13.1% for AGIs $25k-50k, 10.5% for AGIs $50k-75k, 6.1% for AGIs $75k-100k, 8.0% for AGIs $100k-200k, 3.8% for AGIs over 200k)
Taxable individual retirement arrangement distribution: $30,044 (reported on 6.4% of returns)
81435:
$30,044
Colorado:
$17,927
(% of AGI for various income ranges: 1.7% for AGIs below $25k, 0.7% for AGIs $25k-50k, 3.3% for AGIs $50k-75k, 3.8% for AGIs $100k-200k, 2.1% for AGIs over 200k)
Self-employment retirement plans: $18,160 (reported on 1.8% of returns)
81435:
$18,160
Colorado:
$19,483
Total itemized deductions: $39,044 (21% of AGI, reported on 35.3% of returns)
Here:
$39,044
State:
$24,621
Here:
20.8% of AGI
State:
18.5% of AGI
(% of AGI for various income ranges: 19.1% for AGIs below $25k, 12.2% for AGIs $25k-50k, 18.9% for AGIs $50k-75k, 16.9% for AGIs $75k-100k, 21.1% for AGIs $100k-200k, 14.1% for AGIs over 200k)
Charity contributions: $3,305 (reported on 26.9% of returns)
Here:
$3,305
State:
$4,449
(% of AGI for various income ranges: 0.9% for AGIs below $25k, 0.5% for AGIs $25k-50k, 1.0% for AGIs $50k-75k, 0.7% for AGIs $75k-100k, 1.7% for AGIs $100k-200k, 1.0% for AGIs over 200k)
Taxes paid: $15,053 (reported on 35.3% of returns)
81435:
$15,053
State:
$7,641
(% of AGI for various income ranges: 3.1% for AGIs below $25k, 2.0% for AGIs $25k-50k, 4.1% for AGIs $50k-75k, 3.8% for AGIs $75k-100k, 6.9% for AGIs $100k-200k, 7.7% for AGIs over 200k)
Earned income credit: $1,336 (reported on 11.7% of returns)
Here:
$1,336
State:
$2,095
(% of AGI for various income ranges: 2.2% for AGIs below $25k, 0.5% for AGIs $25k-50k)
Percentage of individuals using paid preparers for their 2012 taxes: 55.8%
Here:
56%
State:
49%
(% for various income ranges: 47.2% for AGIs below $25k, 46.8% for AGIs $25k-50k, 60.6% for AGIs $50k-75k, 70.6% for AGIs $75k-100k, 76.7% for AGIs $100k-200k, 93.8% for AGIs over 200k)
Averages for the 2004 tax year for zip code 81435, filed in 2005:
Average Adjusted Gross Income (AGI) in 2004: $81,631 (Individual Income Tax Returns)
Here:
$81,631
State:
$55,014
Salary/wage: $35,855 (reported on 80.3% of returns)
Here:
$35,855
State:
$46,010
(% of AGI for various income ranges: 81.3% for AGIs $10k-25k, 80.2% for AGIs $25k-50k, 65.3% for AGIs $50k-75k, 63.9% for AGIs $75k-100k, 17.3% for AGIs over 100k)
Taxable interest for individuals: $4,887 (reported on 46.3% of returns)
This zip code:
$4,887
Colorado:
$2,127
(% of AGI for various income ranges: 1.8% for AGIs $10k-25k, 1.0% for AGIs $25k-50k, 2.7% for AGIs $50k-75k, 1.9% for AGIs $75k-100k, 3.0% for AGIs over 100k)
Taxable dividends: $11,570 (reported on 33.2% of returns)
Here:
$11,570
State:
$3,782
(% of AGI for various income ranges: 3.2% for AGIs $10k-25k, 2.3% for AGIs $25k-50k, 4.4% for AGIs $50k-75k, 2.2% for AGIs $75k-100k, 5.1% for AGIs over 100k)
Net capital gain/loss: +$94,026 (reported on 32.1% of returns)
Here:
+$94,026
State:
+$17,882
(% of AGI for various income ranges: 2.2% for AGIs $10k-25k, 3.0% for AGIs $25k-50k, 5.0% for AGIs $50k-75k, 4.8% for AGIs $75k-100k, 49.8% for AGIs over 100k)
Profit/loss from business: +$22,814 (reported on 33.1% of returns)
Here:
+$22,814
State:
+$11,247
(% of AGI for various income ranges: 14.0% for AGIs $10k-25k, 10.7% for AGIs $25k-50k, 13.8% for AGIs $50k-75k, 12.1% for AGIs $75k-100k, 7.8% for AGIs over 100k)
IRA payment deduction: $3,341 (reported on 6.2% of returns)
81435:
$3,341
Colorado:
$2,947
(% of AGI for various income ranges: 0.8% for AGIs $10k-25k, 0.6% for AGIs $25k-50k, 0.6% for AGIs $50k-75k, 0.4% for AGIs $75k-100k, 0.1% for AGIs over 100k)
Self-employed pension: $21,818 (reported on 2.5% of returns)
Here:
$21,818
Colorado:
$13,653
Total itemized deductions: $35,958 (21% of AGI, reported on 39.5% of returns)
Here:
$35,958
State:
$20,560
Here:
21.2% of AGI
State:
21.4% of AGI
(% of AGI for various income ranges: 12.2% for AGIs $10k-25k, 15.9% for AGIs $25k-50k, 22.0% for AGIs $50k-75k, 24.2% for AGIs $75k-100k, 16.1% for AGIs over 100k)
Charity contributions deductions: $5,222 (3% of AGI, reported on 32.1% of returns)
Here:
$5,222
State:
$3,518
Here:
2.8% of AGI
State:
3.4% of AGI
(% of AGI for various income ranges: 0.7% for AGIs $10k-25k, 0.9% for AGIs $25k-50k, 2.0% for AGIs $50k-75k, 2.3% for AGIs $75k-100k, 2.3% for AGIs over 100k)
Total tax: $15,395 (reported on 83.5% of returns)
81435:
$15,395
State:
$9,173
(% of AGI for various income ranges: 7.1% for AGIs $10k-25k, 9.5% for AGIs $25k-50k, 11.1% for AGIs $50k-75k, 11.7% for AGIs $75k-100k, 17.7% for AGIs over 100k)
Earned income credit: $906 (reported on 9.3% of returns)
Here:
$906
State:
$1,595
Percentage of individuals using paid preparers for their 2004 taxes: 59.9%
Here:
60%
State:
55%
(% for various income ranges: 54.3% for AGIs below $10k, 49.8% for AGIs $10k-25k, 51.4% for AGIs $25k-50k, 67.7% for AGIs $50k-75k, 70.8% for AGIs $75k-100k, 91.3% for AGIs over 100k)
Household received Food Stamps/SNAP in the past 12 months: 39 Household did not receive Food Stamps/SNAP in the past 12 months: 2,786
Women who had a birth in the past 12 months: 27 (10 now married, 15 unmarried) Women who did not have a birth in the past 12 months: 1,445 (624 now married, 821 unmarried)
Housing units in zip code 81435 with a mortgage: 851 (16 second mortgage, 11 both second mortgage and home equity loan) Median monthly owner costs for units with a mortgage: $2,488 Median monthly owner costs for units without a mortgage: $717
Residents with income below the poverty level in 2022:
This zip code:
8.6%
Whole state:
9.4%
Residents with income below 50% of the poverty level in 2022:
This zip code:
3.2%
Whole state:
4.6%
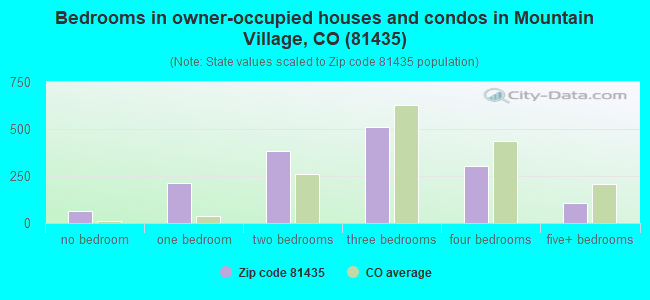
Median number of rooms in houses and condos:
Here:
5.7
State:
6.8
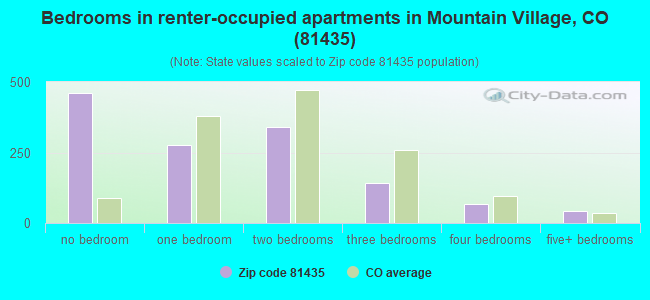
Median number of rooms in apartments:
Here:
3.5
State:
4.0
Notable locations in this zip code not listed on our city pages
Notable locations in zip code 81435: Silver Pick Mill (A), Ophir Loop Tram (B), Skyline Ranch (C), Sunshine Campground (D), Society Turn (E), Pandora Mill (F), Lizard Head Trailhead (G), Matterhorn Work Center (H), Matterhorn Campground (I), Telluride Ski Area (J), Telluride Fire Department Mountain Village Station 2 (K), San Miguel County Court House (L), Wilkinson Public Library (M), Rebekah Hall - Town Hall Annex (N), Telluride Fire Department and Emergency Medical Services Station 1 (O), Telluride Town Hall (P), Telluride Community Center (Q). Display/hide their locations on the map
Churches in zip code 81435 include: Christ Church (A), Telluride Christian Fellowship (B), Telluride Baptist Chapel (C). Display/hide their locations on the map
Lakes and reservoirs: Ingram Lake (A), Lake Hope (B), Cushman Lake (C), Thorne Lake (D), Wild Boy Lake (E), Silver Lake (F), Mud Lake (G), Alta Lakes (H). Display/hide their locations on the map
Streams, rivers, and creeks: Waterfall Creek (A), Lizard Head Creek (B), Lake Fork (C), Howard Fork (D), Bridal Veil Creek (E), Ingram Creek (F), Savage Creek (G), Marshall Creek (H), Bear Creek (I). Display/hide their locations on the map
Parks in zip code 81435 include: Telluride Historic District (1), Judy Long Memorial Park (2), Town Park (3), Bear Creek Field (4), Francis Warner Field (5), Telluride Community Pool (6). Display/hide their locations on the map
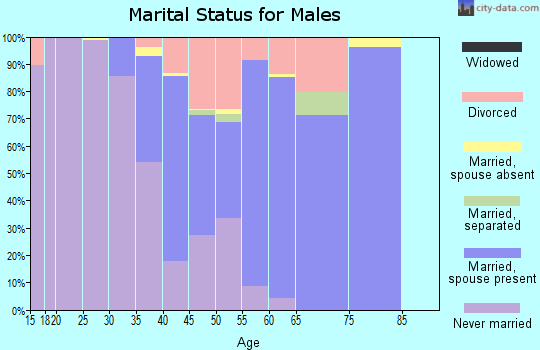
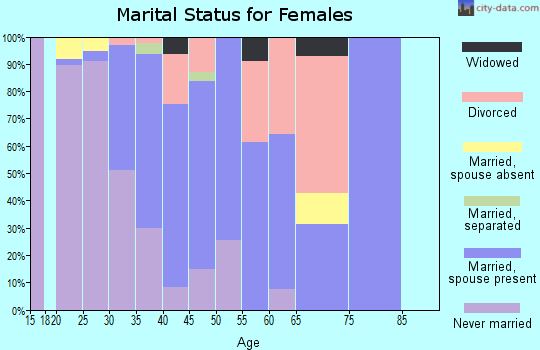
685 married couples with children.
187 single-parent households (66 men, 121 women).
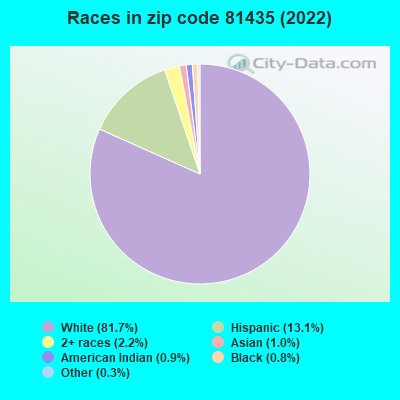
81.6% of residents of 81435 zip code speak English at home.
13.7% of residents speak Spanish at home (75% very well, 7% well, 14% not well, 4% not at all).
2.5% of residents speak other Indo-European language at home (72% very well, 28% well).
1.0% of residents speak Asian or Pacific Island language at home (34% very well, 66% not well).
0.8% of residents speak other language at home (93% very well, 7% well).
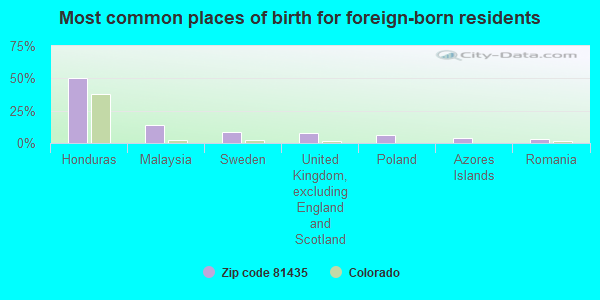
Foreign born population: 591 (10.4%) (36.6% of them are naturalized citizens)
This zip code:
10.4%
Whole state:
9.5%
50%Honduras
14%Malaysia
9%Sweden
8%United Kingdom, excluding England and Scotland
6%Poland
4%Azores Islands
3%Romania
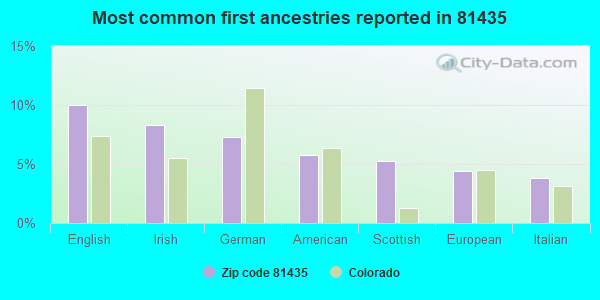
10%English
8%Irish
7%German
6%American
5%Scottish
4%European
4%Italian
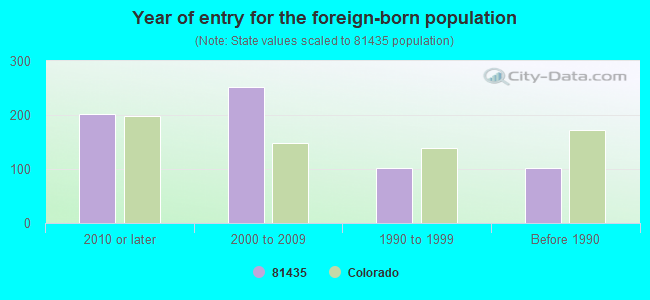
Year of entry for the foreign-born population
2022010 or later
2512000 to 2009
1021990 to 1999
101Before 1990
Facilities with environmental interests located in this zip code:
BLUE JAY RESTAURANT & LODGE (2232 HIGHWAY 145 in TELLURIDE, CO)
National Pollutant Discharge Elimination System NON-MAJOR (Tracking pollutant discharge elimination systems) - permit Business SIC classification: SEWERAGE SYSTEMS
H P T INC DBA TELLURIDE ECO CLEANERS (164 SOCIETY DR in TELLURIDE, CO)
Conditionally Exempt Small Quantity Generators, less than 100 kg/month of hazardous waste (Resource Conservation and Recovery Act (tracking hazardous waste)) Organizations: SOCIETY TURN BUSINESS CENTER (CONTACT/OWNER)
JOSEPH J. ANTISTA (385 JUNIPER VILLAGE LANE in TELLURIDE, CO)
ENFORCEMENT/COMPLIANCE ACTIVITY (Integrated Compliance Information System)
DANNY THOMPSON MOTOR SPORTS (805 SHADOW LAKE in TELLURIDE, CO)
ENFORCEMENT/COMPLIANCE ACTIVITY (Integrated Compliance Information System)
Housing units lacking complete plumbing facilities: 0.7% Housing units lacking complete kitchen facilities: 4.8%
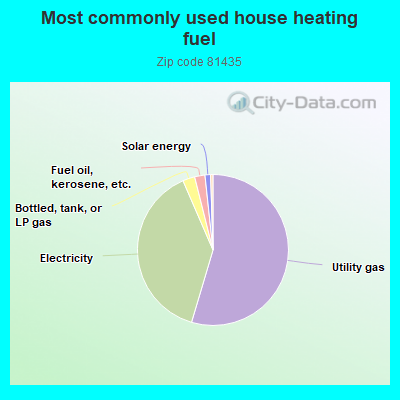
54.6%Utility gas
38.9%Electricity
2.6%Bottled, tank, or LP gas
2.2%Fuel oil, kerosene, etc.
1.2%Solar energy
Population in 1990: 1,850. Population change in the 1990s: +3,055 (+165.1%).
Place of birth for U.S.-born residents:
This state: 1,173
Northeast: 1,087
Midwest: 828
South: 1,122
West: 812
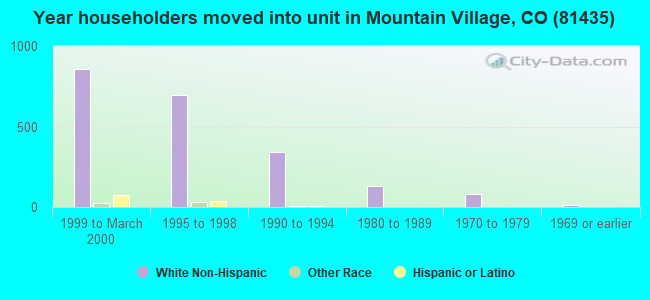
31% of the 81435 zip code residents lived in the same house 5 years ago. Out of people who lived in different houses, 37% lived in this county. Out of people who lived in different counties, 50% lived in Colorado.
90% of the 81435 zip code residents lived in the same house 1 year ago. Out of people who lived in different houses, 29% moved from this county. Out of people who lived in different houses, 26% moved from different county within same state. Out of people who lived in different houses, 47% moved from different state. Out of people who lived in different houses, 1% moved from abroad.
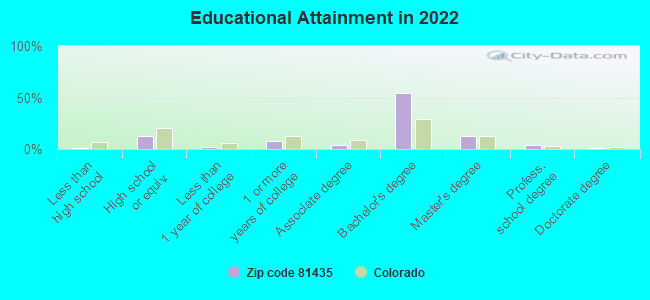
Private vs. public school enrollment:
Students in private schools in grades 1 to 8 (elementary and middle school): 93
Here:
23.7%
Colorado:
11.4%
Students in private schools in grades 9 to 12 (high school): 13
Here:
5.6%
Colorado:
8.5%
Students in private undergraduate colleges: 2
Here:
13.8%
Colorado:
14.0%
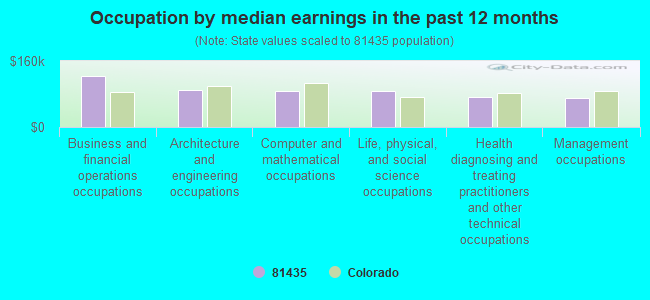
Occupation by median earnings in the past 12 months ($)
123,500Business and financial operations occupations
90,289Architecture and engineering occupations
88,160Computer and mathematical occupations
87,681Life, physical, and social science occupations
73,121Health diagnosing and treating practitioners and other technical occupations
70,407Management occupations
Companies with federal contracts located in this zip code:
FRAHM BUILDERS (1979 HWY 145 in TELLURIDE, CA; small business) : $78,576 in 3 contractsfrom 2002 to 2003
$40,511 with Air Force for Miscellaneous Construction Equipment. Signed on 2002-09-30. Completion date: 2002-11-30.
$29,651 with Air Force for Miscellaneous Materials Handling Equipment. Taking place in CA. Signed on 2002-11-25. Completion date: 2002-11-29.
$8,414 with Army for Miscellaneous Construction Equipment. Taking place in CA. Signed on 2003-01-22. Completion date: 2003-01-31.
Top industries in this zip code by the number of employees in 2005:
Arts, Entertainment, and Recreation: Skiing Facilities (500-999 employees: 1 establishment)
Accommodation and Food Services: Hotels (except Casino Hotels) and Motels (250-499: 1, 50-99: 1, 20-49: 4, 10-19: 3, 1-4: 1)
Other Services (except Public Administration): Other Similar Organizations (except Business, Professional, Labor, and Political Organizations) (100-249: 1, 5-9: 1, 1-4: 6)
Real Estate and Rental and Leasing: Offices of Real Estate Agents and Brokers (5-9: 4, 1-4: 48)
Arts, Entertainment, and Recreation: All Other Amusement and Recreation Industries (20-49: 1, 10-19: 2, 5-9: 1, 1-4: 3)
People in group quarters in 2010:
9 people in local jails and other municipal confinement facilities
People in group quarters in 2000:
17 people in local jails and other confinement facilities (including police lockups)
Fatal accident statistics in 2014:
Fatal accident count: 2
Vehicles involved in fatal accidents: 2
Fatal accidents caused by drunken drivers: 2
Fatalities: 4
Persons involved in fatal accidents: 5
Pedestrians involved in fatal accidents: 0
Fatal accident statistics in 2013:
Fatal accident count: 1
Vehicles involved in fatal accidents: 1
Fatal accidents caused by drunken drivers: 0
Fatalities: 1
Persons involved in fatal accidents: 1
Pedestrians involved in fatal accidents: 0
2002 - 2018 National Fire Incident Reporting System (NFIRS) incidents
Based on the data from the years 2002 - 2018 the average number of fire incidents per year is 12. The highest number of fire incidents - 20 took place in 2005, and the least - 5 in 2017. The data has a dropping trend.
When looking into fire subcategories, the most reports belonged to: Structure Fires (45.9%), and Outside Fires (40.2%).
Fire incident types reported to NFIRS in Zip Code 81435


 Nearest zip codes: 81426, 81430, 81432, 81332, 81427, 81433.


 Based on the data from the years 2002 - 2018 the average number of fire incidents per year is 12. The highest number of fire incidents - 20 took place in 2005, and the least - 5 in 2017. The data has a dropping trend.
 When looking into fire subcategories, the most reports belonged to: Structure Fires (45.9%), and Outside Fires (40.2%).