Estimated zip code population in 2022: 10,289 Zip code population in 2010: 7,905 Zip code population in 2000: 6,753
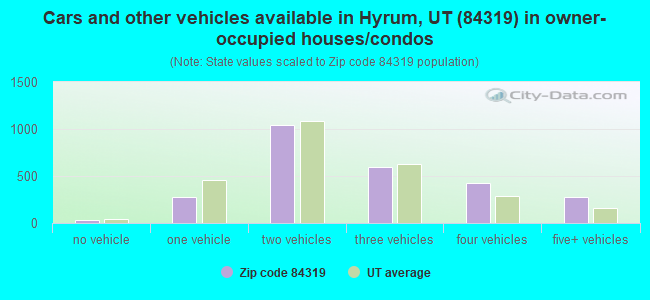
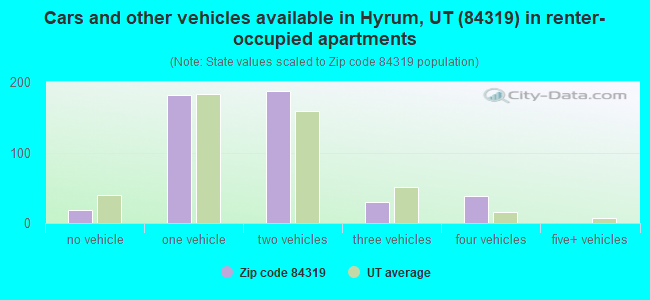
Houses and condos: 3,252 Renter-occupied apartments: 459
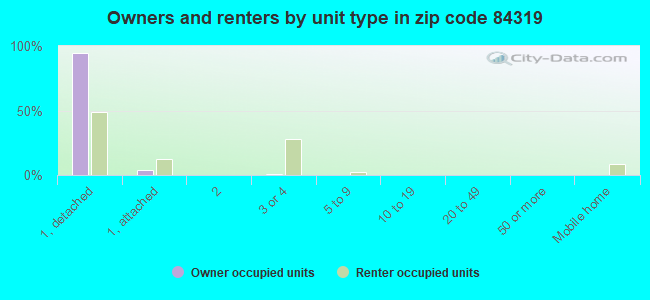
% of renters here:
15%
State:
29%
March 2022 cost of living index in zip code 84319: 90.1 (less than average, U.S. average is 100)
Land area: 97.5 sq. mi. Water area: 0.7 sq. mi.
Population density: 106 people per square mile
(very low).
OSM Map
General Map
Google Map
MSN Map
OSM Map
General Map
Google Map
MSN Map
OSM Map
General Map
Google Map
MSN Map
OSM Map
General Map
Google Map
MSN Map
Please wait while loading the map...
Real estate property taxes paid for housing units in 2022:
This zip code:
0.4% ($1,702)
Utah:
0.5% ($2,376)
Median real estate property taxes paid for housing units with mortgages in 2022: $1,803 (0.4%) Median real estate property taxes paid for housing units with no mortgage in 2022: $1,522 (0.5%)
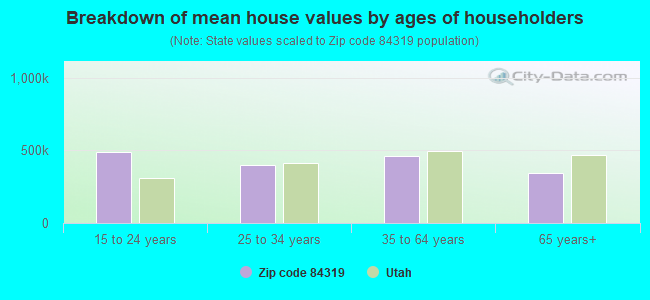
Estimated median house/condo value in 2022: $396,788
84319:
$396,788
Utah:
$499,500
According to our research of Utah and other state lists, there were 20 registered sex offenders living in 84319 zip code as of May 02, 2024. The ratio of all residents to sex offenders in zip code 84319 is 408 to 1. The ratio of registered sex offenders to all residents in this zip code is near the state average.
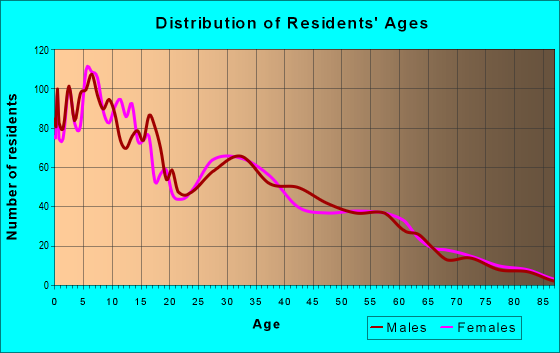
Median resident age:
This zip code:
29.4 years
Utah median age:
32.1 years
Average household size:
This zip code:
3.3 people
Utah:
3.0 people
Averages for the 2020 tax year for zip code 84319, filed in 2021:
Average Adjusted Gross Income (AGI) in 2020: $58,508 (Individual Income Tax Returns)
Here:
$58,508
State:
$81,660
Salary/wage: $52,711 (reported on 89.8% of returns)
Here:
$52,711
State:
$63,027
(% of AGI for various income ranges: 1385.5% for AGIs below $25k, 4061.9% for AGIs $25k-50k, 6843.3% for AGIs $50k-75k, 10606.8% for AGIs $75k-100k, 17230.3% for AGIs $100k-200k)
Taxable interest for individuals: $1,100 (reported on 23.3% of returns)
This zip code:
$1,100
Utah:
$2,255
(% of AGI for various income ranges: 11.1% for AGIs below $25k, 14.7% for AGIs $25k-50k, 24.8% for AGIs $50k-75k, 34.2% for AGIs $75k-100k, 108.5% for AGIs $100k-200k)
Ordinary dividends: $2,952 (reported on 10.7% of returns)
Here:
$2,952
State:
$7,362
(% of AGI for various income ranges: 6.6% for AGIs below $25k, 9.5% for AGIs $25k-50k, 12.0% for AGIs $50k-75k, 27.8% for AGIs $75k-100k, 61.5% for AGIs $100k-200k)
Net capital gain/loss in AGI: +$18,412 (reported on 11.9% of returns)
Here:
+$18,412
State:
+$43,433
(% of AGI for various income ranges: 3.9% for AGIs below $25k, 18.8% for AGIs $25k-50k, 29.9% for AGIs $50k-75k, 106.2% for AGIs $75k-100k, 679.4% for AGIs $100k-200k)
Profit/loss from business: +$5,711 (reported on 12.8% of returns)
Here:
+$5,711
State:
+$9,957
(% of AGI for various income ranges: 51.3% for AGIs below $25k, 87.1% for AGIs $25k-50k, 133.9% for AGIs $50k-75k, 118.8% for AGIs $75k-100k, 165.8% for AGIs $100k-200k)
Taxable individual retirement arrangement distribution: $16,464 (reported on 5.8% of returns)
84319:
$16,464
Utah:
$21,167
(% of AGI for various income ranges: 37.6% for AGIs below $25k, 64.9% for AGIs $25k-50k, 91.6% for AGIs $50k-75k, 201.3% for AGIs $75k-100k, 543.6% for AGIs $100k-200k)
Total itemized deductions: $33,359 (reported on 7.4% of returns)
Here:
$33,359
State:
$41,056
(% of AGI for various income ranges: 94.7% for AGIs $25k-50k, 180.3% for AGIs $50k-75k, 317.8% for AGIs $75k-100k, 1457.9% for AGIs $100k-200k)
Charity contributions: $13,650 (reported on 7.0% of returns)
Here:
$13,650
State:
$22,261
(% of AGI for various income ranges: 20.8% for AGIs below $25k, 43.0% for AGIs $50k-75k, 83.5% for AGIs $75k-100k, 692.1% for AGIs $100k-200k)
Taxes paid: $6,819 (reported on 7.4% of returns)
84319:
$6,819
State:
$7,985
(% of AGI for various income ranges: 13.8% for AGIs $25k-50k, 33.8% for AGIs $50k-75k, 64.2% for AGIs $75k-100k, 352.7% for AGIs $100k-200k)
Earned income credit: $2,277 (reported on 15.1% of returns)
Here:
$2,277
State:
$2,169
(% of AGI for various income ranges: 73.3% for AGIs below $25k, 94.3% for AGIs $25k-50k, 4.5% for AGIs $50k-75k)
Percentage of individuals using paid preparers for their 2020 taxes: 95.6%
Here:
96%
State:
94%
(% for various income ranges: 94.0% for AGIs below $25k, 96.2% for AGIs $25k-50k, 96.6% for AGIs $50k-75k, 96.5% for AGIs $75k-100k, 94.5% for AGIs $100k-200k, 100.0% for AGIs over 200k)
Averages for the 2012 tax year for zip code 84319, filed in 2013:
Average Adjusted Gross Income (AGI) in 2012: $46,900 (Individual Income Tax Returns)
Here:
$46,900
State:
$60,327
Salary/wage: $40,687 (reported on 90.3% of returns)
Here:
$40,687
State:
$48,762
(% of AGI for various income ranges: 84.0% for AGIs below $25k, 86.1% for AGIs $25k-50k, 86.4% for AGIs $50k-75k, 84.7% for AGIs $75k-100k, 74.3% for AGIs $100k-200k, 26.8% for AGIs over 200k)
Taxable interest for individuals: $789 (reported on 32.8% of returns)
This zip code:
$789
Utah:
$1,534
(% of AGI for various income ranges: 0.5% for AGIs below $25k, 0.4% for AGIs $25k-50k, 0.4% for AGIs $50k-75k, 0.3% for AGIs $75k-100k, 0.5% for AGIs $100k-200k, 1.8% for AGIs over 200k)
Ordinary dividends: $1,822 (reported on 10.7% of returns)
Here:
$1,822
State:
$5,711
(% of AGI for various income ranges: 0.4% for AGIs below $25k, 0.2% for AGIs $25k-50k, 0.2% for AGIs $50k-75k, 0.2% for AGIs $75k-100k, 2.0% for AGIs $100k-200k)
Net capital gain/loss in AGI: +$19,985 (reported on 8.7% of returns)
Here:
+$19,985
State:
+$23,734
(% of AGI for various income ranges: 0.2% for AGIs below $25k, 0.4% for AGIs $50k-75k, 1.4% for AGIs $75k-100k, 25.5% for AGIs $100k-200k)
Profit/loss from business: +$3,283 (reported on 14.0% of returns)
Here:
+$3,283
State:
+$8,845
(% of AGI for various income ranges: 4.5% for AGIs below $25k, 1.9% for AGIs $25k-50k, 0.4% for AGIs $50k-75k, 0.1% for AGIs $75k-100k)
Taxable individual retirement arrangement distribution: $10,680 (reported on 6.7% of returns)
84319:
$10,680
Utah:
$15,565
(% of AGI for various income ranges: 2.6% for AGIs below $25k, 1.1% for AGIs $25k-50k, 1.6% for AGIs $50k-75k, 3.3% for AGIs $75k-100k)
Total itemized deductions: $19,495 (26% of AGI, reported on 36.1% of returns)
Here:
$19,495
State:
$25,197
Here:
25.8% of AGI
State:
22.4% of AGI
(% of AGI for various income ranges: 7.7% for AGIs below $25k, 12.3% for AGIs $25k-50k, 16.3% for AGIs $50k-75k, 17.7% for AGIs $75k-100k, 16.6% for AGIs $100k-200k, 17.7% for AGIs over 200k)
Charity contributions: $7,244 (reported on 31.1% of returns)
Here:
$7,244
State:
$8,502
(% of AGI for various income ranges: 1.5% for AGIs below $25k, 2.6% for AGIs $25k-50k, 4.9% for AGIs $50k-75k, 6.1% for AGIs $75k-100k, 5.8% for AGIs $100k-200k, 8.8% for AGIs over 200k)
Taxes paid: $4,355 (reported on 35.8% of returns)
84319:
$4,355
State:
$7,001
(% of AGI for various income ranges: 1.3% for AGIs below $25k, 2.0% for AGIs $25k-50k, 3.4% for AGIs $50k-75k, 4.3% for AGIs $75k-100k, 5.0% for AGIs $100k-200k, 4.2% for AGIs over 200k)
Earned income credit: $2,253 (reported on 22.7% of returns)
Here:
$2,253
State:
$2,259
(% of AGI for various income ranges: 6.7% for AGIs below $25k, 2.1% for AGIs $25k-50k)
Percentage of individuals using paid preparers for their 2012 taxes: 57.5%
Here:
58%
State:
51%
(% for various income ranges: 52.9% for AGIs below $25k, 62.1% for AGIs $25k-50k, 58.3% for AGIs $50k-75k, 56.7% for AGIs $75k-100k, 60.0% for AGIs $100k-200k, 66.7% for AGIs over 200k)
Averages for the 2004 tax year for zip code 84319, filed in 2005:
Average Adjusted Gross Income (AGI) in 2004: $35,961 (Individual Income Tax Returns)
Here:
$35,961
State:
$45,498
Salary/wage: $32,958 (reported on 92.1% of returns)
Here:
$32,958
State:
$38,975
(% of AGI for various income ranges: 142.2% for AGIs below $10k, 86.8% for AGIs $10k-25k, 89.8% for AGIs $25k-50k, 88.3% for AGIs $50k-75k, 85.3% for AGIs $75k-100k, 49.7% for AGIs over 100k)
Taxable interest for individuals: $854 (reported on 40.5% of returns)
This zip code:
$854
Utah:
$1,445
(% of AGI for various income ranges: 4.5% for AGIs below $10k, 1.1% for AGIs $10k-25k, 0.5% for AGIs $25k-50k, 0.9% for AGIs $50k-75k, 0.6% for AGIs $75k-100k, 1.7% for AGIs over 100k)
Taxable dividends: $1,318 (reported on 11.7% of returns)
Here:
$1,318
State:
$3,152
(% of AGI for various income ranges: 0.9% for AGIs below $10k, 0.3% for AGIs $10k-25k, 0.2% for AGIs $25k-50k, 0.2% for AGIs $50k-75k, 0.2% for AGIs $75k-100k, 1.7% for AGIs over 100k)
Net capital gain/loss: +$9,416 (reported on 11.0% of returns)
Here:
+$9,416
State:
+$14,059
(% of AGI for various income ranges: -0.2% for AGIs below $10k, -0.2% for AGIs $10k-25k, 0.2% for AGIs $25k-50k, 0.3% for AGIs $50k-75k, 3.0% for AGIs $75k-100k, 19.4% for AGIs over 100k)
Profit/loss from business: +$2,029 (reported on 14.3% of returns)
Here:
+$2,029
State:
+$6,903
(% of AGI for various income ranges: 5.9% for AGIs below $10k, 1.9% for AGIs $10k-25k, 0.8% for AGIs $25k-50k, 0.2% for AGIs $50k-75k, 1.4% for AGIs $75k-100k)
IRA payment deduction: $2,320 (reported on 1.9% of returns)
84319:
$2,320
Utah:
$2,970
Total itemized deductions: $15,889 (27% of AGI, reported on 36.2% of returns)
Here:
$15,889
State:
$20,312
Here:
26.8% of AGI
State:
24.9% of AGI
(% of AGI for various income ranges: 8.2% for AGIs $10k-25k, 15.2% for AGIs $25k-50k, 18.9% for AGIs $50k-75k, 18.8% for AGIs $75k-100k, 17.4% for AGIs over 100k)
Charity contributions deductions: $4,847 (8% of AGI, reported on 33.0% of returns)
Here:
$4,847
State:
$6,250
Here:
8.1% of AGI
State:
7.4% of AGI
(% of AGI for various income ranges: 1.9% for AGIs $10k-25k, 3.8% for AGIs $25k-50k, 4.9% for AGIs $50k-75k, 6.6% for AGIs $75k-100k, 5.7% for AGIs over 100k)
Total tax: $3,420 (reported on 62.0% of returns)
84319:
$3,420
State:
$6,523
(% of AGI for various income ranges: 2.8% for AGIs below $10k, 3.0% for AGIs $10k-25k, 3.2% for AGIs $25k-50k, 5.6% for AGIs $50k-75k, 8.2% for AGIs $75k-100k, 14.1% for AGIs over 100k)
Earned income credit: $1,767 (reported on 16.3% of returns)
Here:
$1,767
State:
$1,703
Percentage of individuals using paid preparers for their 2004 taxes: 56.2%
Here:
56%
State:
53%
(% for various income ranges: 46.1% for AGIs below $10k, 57.6% for AGIs $10k-25k, 58.1% for AGIs $25k-50k, 58.0% for AGIs $50k-75k, 61.6% for AGIs $75k-100k, 75.4% for AGIs over 100k)
Household received Food Stamps/SNAP in the past 12 months: 241 Household did not receive Food Stamps/SNAP in the past 12 months: 2,851
Women who had a birth in the past 12 months: 70 (53 now married, 15 unmarried) Women who did not have a birth in the past 12 months: 2,407 (1,566 now married, 828 unmarried)
Housing units in zip code 84319 with a mortgage: 1,748 (197 second mortgage, 203 both second mortgage and home equity loan) Houses without a mortgage: 37
Median monthly owner costs for units with a mortgage: $1,598 Median monthly owner costs for units without a mortgage: $353
Residents with income below the poverty level in 2022:
This zip code:
6.7%
Whole state:
8.2%
Residents with income below 50% of the poverty level in 2022:
This zip code:
2.0%
Whole state:
4.3%
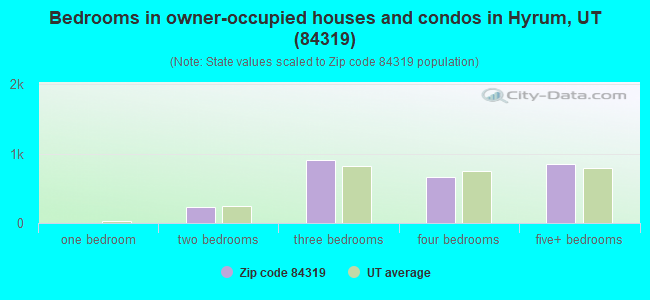
Median number of rooms in houses and condos:
Here:
7.7
State:
7.6
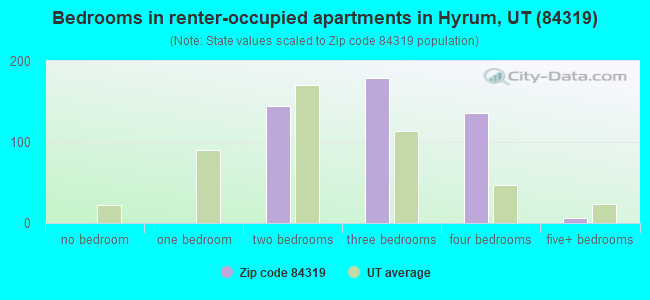
Median number of rooms in apartments:
Here:
4.9
State:
4.3
Notable locations in this zip code not listed on our city pages
Notable locations in zip code 84319: Spring Picnic Area (A), Hardware Ranch (B), Cooks Cabin (C), Curtis Creek Guard Station (D), Shenoah Campground (E), Friendship Campground (F), Blacksmith Fork Guard Station (G), Pioneer Campground (H), Hyrum Lake Campground (I), Miller Brothers Feedyard (J), Cache County Emergency Medical Services Hyrum (K), Hyrum City Fire Department (L). Display/hide their locations on the map
Parks in zip code 84319 include: Hardware Ranch Game Management Area (1), Millville Face Wildlife Management Area (2), Hyrum Reservoir State Park (3), Hyrum City Park (4). Display/hide their locations on the map
Size of family households: 944 2-persons, 440 3-persons, 377 4-persons, 525 5-persons, 177 6-persons, 175 7-or-more-persons
Size of nonfamily households: 319 1-person, 103 2-persons, 25 3-persons
3,188 married couples with children.
175 single-parent households (109 men, 66 women).
88.3% of residents of 84319 zip code speak English at home.
9.7% of residents speak Spanish at home (54% very well, 17% well, 19% not well, 10% not at all).
0.1% of residents speak other Indo-European language at home (100% very well).
1.5% of residents speak Asian or Pacific Island language at home (74% very well, 22% well, 4% not well).
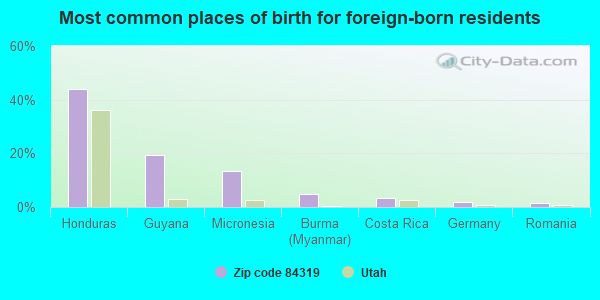
Foreign born population: 772 (7.5%) (46.9% of them are naturalized citizens)
This zip code:
7.5%
Whole state:
8.6%
44%Honduras
19%Guyana
14%Micronesia
5%Burma (Myanmar)
3%Costa Rica
2%Germany
1%Romania
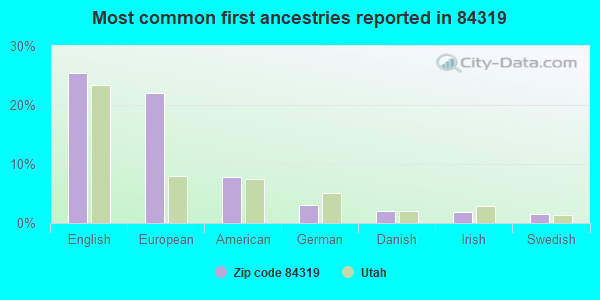
25%English
22%European
8%American
3%German
2%Danish
2%Irish
2%Swedish
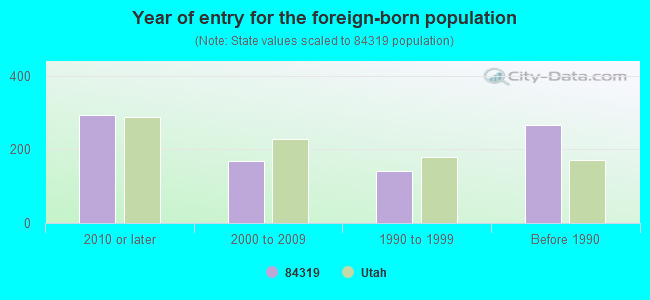
Year of entry for the foreign-born population
2932010 or later
1682000 to 2009
1401990 to 1999
265Before 1990
Major facilities with environmental interests located in this zip code:
E A MILLER (410 N. 200 W. in HYRUM, UT)
AIR MINOR (AIRS/AFS) STATE MASTER (Utah compliance and permitting operations) - USED OIL TRACKING SY-2, USED OIL PROGRAM ENFORCEMENT/COMPLIANCE ACTIVITY (Integrated Compliance Information System) CRITERIA AND HAZARDOUS AIR POLLUTANT INVENTORY (Inventory of air pollution sources) National Pollutant Discharge Elimination System MAJOR (Tracking pollutant discharge elimination systems) - permit Small Quantity Generators, between 100 kg and 1000 kg of hazardous waste/month (Resource Conservation and Recovery Act (tracking hazardous waste)) - notification TRI REPORTER (Tracking of toxic chemicals releasing facilities) Business SIC classification: MEAT PACKING PLANTS Organizations: MILLER-E.A., INC. (CONTACT/OPERATOR)
, COW AGRA (CONTACT/OWNER)
Alternative names: E.A. MILLER, INC. - VENTURI SCRUBBER, EA MILLER INC, MILLER, E A, INC
MOUNTAIN CREST HIGH SCHOOL (255 S 800 E in HYRUM, UT)
STATE MASTER (Utah compliance and permitting operations) - USED OIL TRACKING SY-2, USED OIL PROGRAM (National Center for Education Statistics) - STATE ID-04 702 Organizations: CACHE SCHOOL DISTRICT (SCHOOL DISTRICT)
LINCOLN ELEM SCH (90 S CENTER in HYRUM, UT)
(National Center for Education Statistics) - STATE ID-04 128 Organizations: CACHE SCHOOL DISTRICT (SCHOOL DISTRICT)
MILLER BROTHER'S FEED YARDS (560 WEST 400 NORTH in HYRUM, UT)
National Pollutant Discharge Elimination System NON-MAJOR (Tracking pollutant discharge elimination systems) - permit National Pollutant Discharge Elimination System NON-MAJOR (Tracking pollutant discharge elimination systems) - permit Business SIC classification: BEEF CATTLE FEEDLOTS; GENERAL FARMS, PRIMARILY LIVESTOCK AND ANIMAL SPECIALTIES Alternative names: MILLER BROTHERS, MILLER BROTHERS EXPRESS, L. C., MILLER BROTHERS EXPRESS LC
HYRUM CITY CORPORTATION (83 WEST MAIN STREET in HYRUM, UT)
National Pollutant Discharge Elimination System NON-MAJOR (Tracking pollutant discharge elimination systems) - permit Business SIC classification: SEWERAGE SYSTEMS Organizations: HYRUM CITY CORPORATION (CONTACT/OPERATOR)
Alternative names: HYRUM CITY CORPORATION
HYRUM CITY CORP (1900 WEST 4400 SOUTH in HYRUM, UT)
National Pollutant Discharge Elimination System NON-MAJOR (Tracking pollutant discharge elimination systems) - permit Business SIC classification: SANITARY SERVICES Alternative names: HYRUM WATER RECLAMATION FACILI
HYRUM CITY POWER (150 WEST 6200 SOUTH in HYRUM, UT)
AIR MINOR (AIRS/AFS) Business SIC classification: ELECTRIC SERVICES
HYRUM PIT W/BMG MODEL 250S ASPHALT PLANT (7 MILES SOUTH OF LOGAN in HYRUM, UT)
STATE MASTER (Utah compliance and permitting operations) CRITERIA AND HAZARDOUS AIR POLLUTANT INVENTORY (Inventory of air pollution sources) Business SIC classification: CONSTRUCTION MACHINERY AND EQUIPMENT; LUMBER AND OTHER BUILDING MATERIALS DEALERS
HYRUM CITY WASTEWATER TREAT (4400 SOUTH 1900 WEST in HYRUM, UT)
Conditionally Exempt Small Quantity Generators, less than 100 kg/month of hazardous waste (Resource Conservation and Recovery Act (tracking hazardous waste)) - notification
MILLER TRANSPORT GARAGE (510 WEST 400 NORTH in HYRUM, UT)
Small Quantity Generators, between 100 kg and 1000 kg of hazardous waste/month (Resource Conservation and Recovery Act (tracking hazardous waste)) - notification Organizations: THORNAPPLE VALLEY (CONTACT/OWNER)
CACHE CENTER (10 SOUTH 480 WEST in HYRUM, UT)
COMPLIANCE ACTIVITY (Tracking inspections of insecticide, fungicide, and rodenticide, and toxic substances)
LINCOLN ELEMENTARY SCHOOL (62 WEST 100 SOUTH in HYRUM, UT)
COMPLIANCE ACTIVITY (Tracking inspections of insecticide, fungicide, and rodenticide, and toxic substances)
MEAT PACKING PLANT (410 NORTH 200 WEST in HYRUM, UT)
CRITERIA AND HAZARDOUS AIR POLLUTANT INVENTORY (Inventory of air pollution sources) Business SIC classification: MEAT PACKING PLANTS
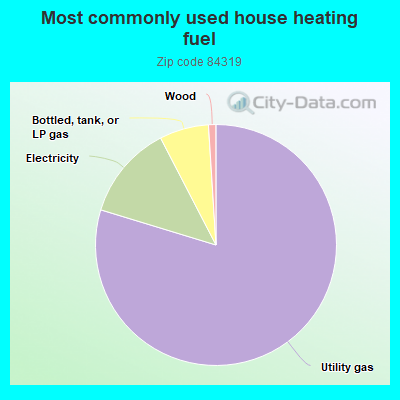
79.8%Utility gas
12.7%Electricity
6.6%Bottled, tank, or LP gas
1.0%Wood
Population in 1990: 5,352. Population change in the 1990s: +1,401 (+26.2%).
Place of birth for U.S.-born residents:
This state: 7,607
Northeast: 65
Midwest: 278
South: 108
West: 1,313
56% of the 84319 zip code residents lived in the same house 5 years ago. Out of people who lived in different houses, 60% lived in this county. Out of people who lived in different counties, 50% lived in Utah.
91% of the 84319 zip code residents lived in the same house 1 year ago. Out of people who lived in different houses, 68% moved from this county. Out of people who lived in different houses, 23% moved from different county within same state. Out of people who lived in different houses, 10% moved from different state.
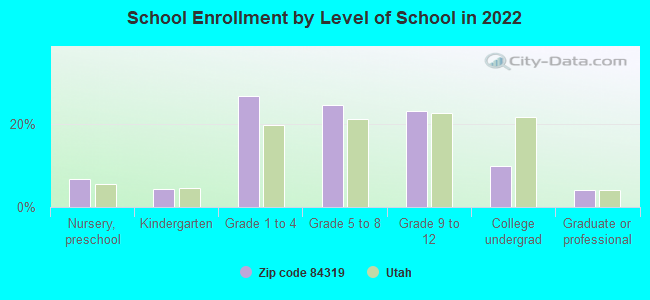
Private vs. public school enrollment:
Students in private schools in grades 1 to 8 (elementary and middle school): 120
Here:
6.7%
Utah:
7.2%
Students in private schools in grades 9 to 12 (high school): 20
Here:
2.5%
Utah:
5.3%
Students in private undergraduate colleges: 33
Here:
9.6%
Utah:
26.7%
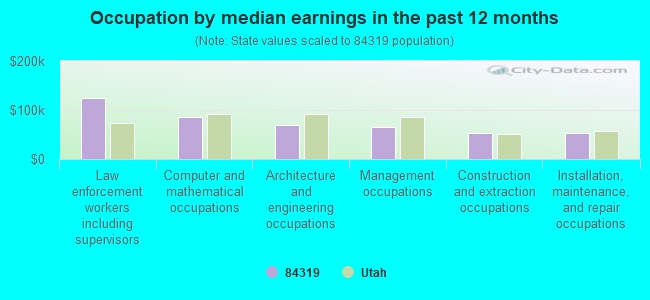
Occupation by median earnings in the past 12 months ($)
124,675Law enforcement workers including supervisors
85,552Computer and mathematical occupations
70,221Architecture and engineering occupations
66,072Management occupations
53,613Construction and extraction occupations
53,331Installation, maintenance, and repair occupations
Companies with federal contracts located in this zip code:
ADVANCED ONSITE LUBE, INC (87 E 200 N in HYRUM, UT; small business) : $845,608 in 24 contractsfrom 2002 to 2006
Contracts for Games, Toys and Wheeled Goods, Athletic and Sporting Equipment, Recreational and Gymnastic Equipment, Maintenance, Repair and Rebuilding of Equipment -- Recreational and Athletic Equipment by Army Signed by year:2000: $0; 2001: $0; 2002: $346,884; 2003: $54,002; 2004: $234,750; 2005: $171,627; 2006: $38,345.
Biggest contracts:
$291,311 with Army for Games, Toys and Wheeled Goods. Signed on 2002-09-26. Completion date: 2002-11-01.
$82,410 with Army for Games, Toys and Wheeled Goods. Taking place in MD. Signed on 2004-08-25. Completion date: 2004-09-15.
$80,345 with Army for Athletic and Sporting Equipment. Signed on 2005-12-27. Completion date: 2006-01-19.
$55,317 with Army for Games, Toys and Wheeled Goods. Signed on 2004-09-23. Completion date: 2004-10-27.
SPECTRUM MANUFACTURING, INC (87 EAST 200 NORTH in HYRUM, UT; small business) : $10,950 in 3 contractsfrom 2002 to 2003
$7,462 with Army for Maintenance, Repair and Rebuilding of Equipment -- Recreational and Athletic Equipment. Taking place in KY. Signed on 2003-06-26. Completion date: 2003-07-15.
$3,480 with Army for Miscellaneous Items. Signed on 2002-06-18. Completion date: 2002-06-17.
$8, same as above.Signed on 2002-07-09. Completion date: 2002-06-17.
Top industries in this zip code by the number of employees in 2005:
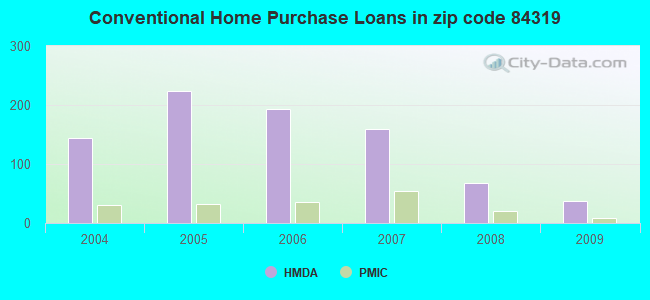
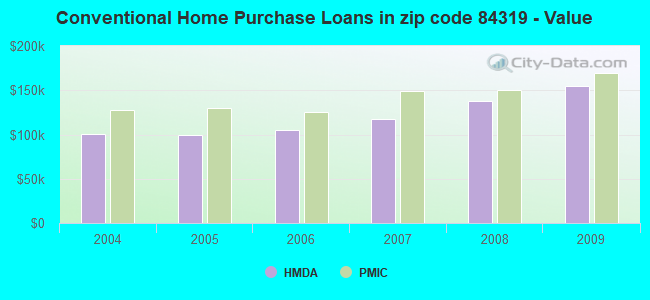
Detailed PMIC statistics for the following Tracts:0014.00
, 0015.00
2003 - 2018 National Fire Incident Reporting System (NFIRS) incidents
According to the data from the years 2003 - 2018 the average number of fires per year is 24. The highest number of reported fires - 41 took place in 2007, and the least - 9 in 2018. The data has a decreasing trend.
When looking into fire subcategories, the most reports belonged to: Outside Fires (49.0%), and Structure Fires (42.4%).
Fire incident types reported to NFIRS in Zip Code 84319


 Nearest zip codes: 84326, 84332, 84328, 84321, 84341, 84318.
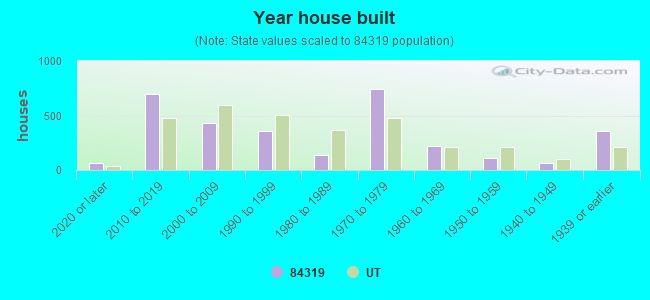


 According to the data from the years 2003 - 2018 the average number of fires per year is 24. The highest number of reported fires - 41 took place in 2007, and the least - 9 in 2018. The data has a decreasing trend.
 When looking into fire subcategories, the most reports belonged to: Outside Fires (49.0%), and Structure Fires (42.4%).