Estimated zip code population in 2022: 42,832 Zip code population in 2010: 39,837 Zip code population in 2000: 28,805
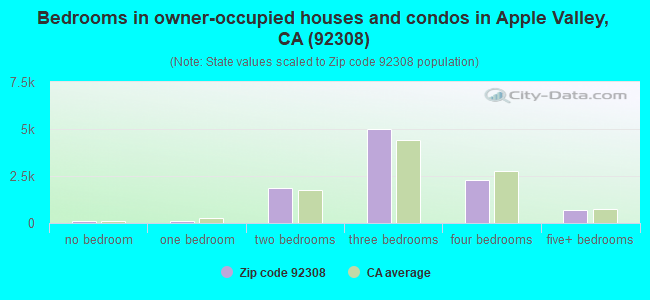
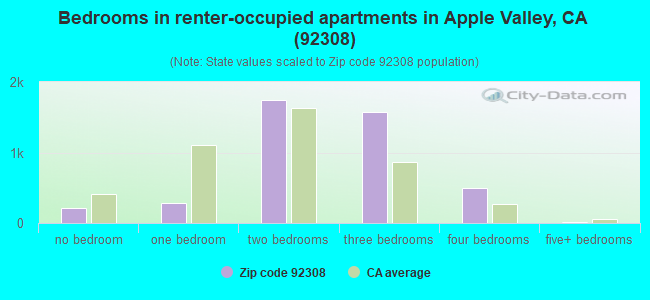
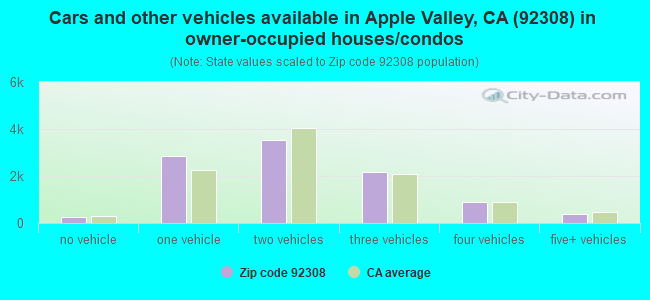
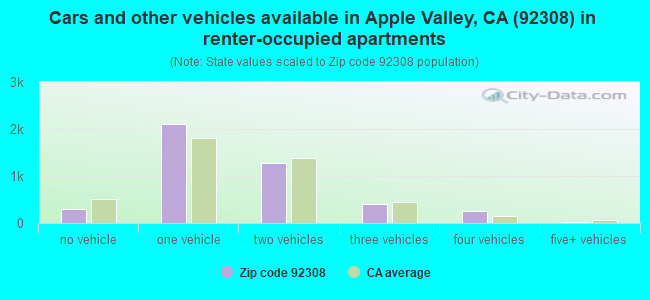
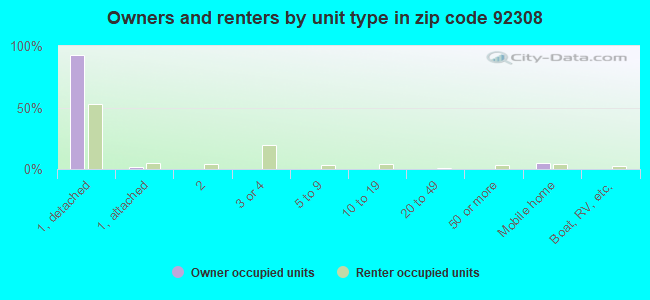
Houses and condos: 15,367 Renter-occupied apartments: 4,350
% of renters here:
30%
State:
44%
March 2022 cost of living index in zip code 92308: 81.8 (low, U.S. average is 100)
Land area: 93.2 sq. mi. Water area: 0.4 sq. mi.
Population density: 460 people per square mile
(low).
OSM Map
General Map
Google Map
MSN Map
OSM Map
General Map
Google Map
MSN Map
OSM Map
General Map
Google Map
MSN Map
OSM Map
General Map
Google Map
MSN Map
Please wait while loading the map...
Real estate property taxes paid for housing units in 2022:
This zip code:
0.7% ($2,375)
California:
0.7% ($4,831)
Median real estate property taxes paid for housing units with mortgages in 2022: $2,439 (0.6%) Median real estate property taxes paid for housing units with no mortgage in 2022: $2,314 (0.7%)
Averages for the 2020 tax year for zip code 92308, filed in 2021:
Average Adjusted Gross Income (AGI) in 2020: $57,454 (Individual Income Tax Returns)
Here:
$57,454
State:
$95,910
Salary/wage: $51,938 (reported on 73.8% of returns)
Here:
$51,938
State:
$77,331
(% of AGI for various income ranges: 1038.4% for AGIs below $25k, 3363.0% for AGIs $25k-50k, 6389.8% for AGIs $50k-75k, 9488.9% for AGIs $75k-100k, 18118.4% for AGIs $100k-200k, 71623.6% for AGIs over 200k)
Taxable interest for individuals: $907 (reported on 33.9% of returns)
This zip code:
$907
California:
$2,294
(% of AGI for various income ranges: 11.1% for AGIs below $25k, 20.6% for AGIs $25k-50k, 34.1% for AGIs $50k-75k, 53.2% for AGIs $75k-100k, 151.2% for AGIs $100k-200k, 976.4% for AGIs over 200k)
Ordinary dividends: $3,455 (reported on 10.1% of returns)
Here:
$3,455
State:
$10,949
(% of AGI for various income ranges: 12.5% for AGIs below $25k, 19.6% for AGIs $25k-50k, 59.7% for AGIs $50k-75k, 64.3% for AGIs $75k-100k, 121.8% for AGIs $100k-200k, 1310.0% for AGIs over 200k)
Net capital gain/loss in AGI: +$13,002 (reported on 10.2% of returns)
Here:
+$13,002
State:
+$49,306
(% of AGI for various income ranges: 2.8% for AGIs below $25k, 18.8% for AGIs $25k-50k, 64.4% for AGIs $50k-75k, 94.9% for AGIs $75k-100k, 481.4% for AGIs $100k-200k, 11045.0% for AGIs over 200k)
Profit/loss from business: +$9,686 (reported on 16.6% of returns)
Here:
+$9,686
State:
+$15,671
(% of AGI for various income ranges: 145.8% for AGIs below $25k, 181.1% for AGIs $25k-50k, 197.9% for AGIs $50k-75k, 267.5% for AGIs $75k-100k, 302.1% for AGIs $100k-200k, 4390.7% for AGIs over 200k)
Taxable individual retirement arrangement distribution: $17,789 (reported on 7.1% of returns)
92308:
$17,789
California:
$23,505
(% of AGI for various income ranges: 43.8% for AGIs below $25k, 97.8% for AGIs $25k-50k, 191.5% for AGIs $50k-75k, 370.5% for AGIs $75k-100k, 587.4% for AGIs $100k-200k, 2200.7% for AGIs over 200k)
Self-employed (Keogh) retirement plans: $29,750 (reported on 0.1% of returns)
92308:
$29,750
California:
$30,163
(% of AGI for various income ranges: 33.1% for AGIs $50k-75k)
Total itemized deductions: $28,592 (reported on 11.0% of returns)
Here:
$28,592
State:
$39,517
(% of AGI for various income ranges: 55.7% for AGIs below $25k, 157.2% for AGIs $25k-50k, 499.4% for AGIs $50k-75k, 883.3% for AGIs $75k-100k, 1765.8% for AGIs $100k-200k, 6855.0% for AGIs over 200k)
Charity contributions: $7,356 (reported on 9.3% of returns)
Here:
$7,356
State:
$12,598
(% of AGI for various income ranges: 4.3% for AGIs below $25k, 24.6% for AGIs $25k-50k, 83.6% for AGIs $50k-75k, 161.1% for AGIs $75k-100k, 435.3% for AGIs $100k-200k, 2158.6% for AGIs over 200k)
Taxes paid: $7,802 (reported on 11.0% of returns)
92308:
$7,802
State:
$8,807
(% of AGI for various income ranges: 9.4% for AGIs below $25k, 34.6% for AGIs $25k-50k, 128.5% for AGIs $50k-75k, 256.4% for AGIs $75k-100k, 549.1% for AGIs $100k-200k, 1680.0% for AGIs over 200k)
Earned income credit: $2,436 (reported on 20.6% of returns)
Here:
$2,436
State:
$2,074
(% of AGI for various income ranges: 122.7% for AGIs below $25k, 94.1% for AGIs $25k-50k, 2.2% for AGIs $50k-75k)
Percentage of individuals using paid preparers for their 2020 taxes: 93.6%
Here:
94%
State:
92%
(% for various income ranges: 92.2% for AGIs below $25k, 94.1% for AGIs $25k-50k, 94.7% for AGIs $50k-75k, 94.0% for AGIs $75k-100k, 94.6% for AGIs $100k-200k, 95.7% for AGIs over 200k)
Averages for the 2012 tax year for zip code 92308, filed in 2013:
Average Adjusted Gross Income (AGI) in 2012: $47,922 (Individual Income Tax Returns)
Here:
$47,922
State:
$72,726
Salary/wage: $43,522 (reported on 73.5% of returns)
Here:
$43,522
State:
$59,079
(% of AGI for various income ranges: 60.9% for AGIs below $25k, 68.9% for AGIs $25k-50k, 69.8% for AGIs $50k-75k, 69.0% for AGIs $75k-100k, 73.7% for AGIs $100k-200k, 48.3% for AGIs over 200k)
Taxable interest for individuals: $986 (reported on 36.3% of returns)
This zip code:
$986
California:
$2,146
(% of AGI for various income ranges: 1.4% for AGIs below $25k, 0.8% for AGIs $25k-50k, 0.7% for AGIs $50k-75k, 0.6% for AGIs $75k-100k, 0.6% for AGIs $100k-200k, 0.6% for AGIs over 200k)
Ordinary dividends: $2,916 (reported on 11.8% of returns)
Here:
$2,916
State:
$9,308
(% of AGI for various income ranges: 0.9% for AGIs below $25k, 0.7% for AGIs $25k-50k, 0.7% for AGIs $50k-75k, 0.7% for AGIs $75k-100k, 0.6% for AGIs $100k-200k, 0.8% for AGIs over 200k)
Net capital gain/loss in AGI: +$3,821 (reported on 10.1% of returns)
Here:
+$3,821
State:
+$30,460
(% of AGI for various income ranges: 0.1% for AGIs $25k-50k, 0.1% for AGIs $50k-75k, 0.3% for AGIs $75k-100k, 0.9% for AGIs $100k-200k, 4.0% for AGIs over 200k)
Profit/loss from business: +$11,404 (reported on 17.7% of returns)
Here:
+$11,404
State:
+$17,064
(% of AGI for various income ranges: 14.8% for AGIs below $25k, 3.1% for AGIs $25k-50k, 1.7% for AGIs $50k-75k, 1.8% for AGIs $75k-100k, 2.2% for AGIs $100k-200k, 6.2% for AGIs over 200k)
Taxable individual retirement arrangement distribution: $15,177 (reported on 9.6% of returns)
92308:
$15,177
California:
$19,557
(% of AGI for various income ranges: 3.2% for AGIs below $25k, 3.1% for AGIs $25k-50k, 2.9% for AGIs $50k-75k, 3.1% for AGIs $75k-100k, 3.4% for AGIs $100k-200k, 2.0% for AGIs over 200k)
Self-employment retirement plans: $64,550 (reported on 0.1% of returns)
92308:
$64,550
California:
$24,530
Total itemized deductions: $23,061 (26% of AGI, reported on 34.7% of returns)
Here:
$23,061
State:
$34,004
Here:
26.4% of AGI
State:
22.7% of AGI
(% of AGI for various income ranges: 10.6% for AGIs below $25k, 14.7% for AGIs $25k-50k, 17.1% for AGIs $50k-75k, 18.4% for AGIs $75k-100k, 19.4% for AGIs $100k-200k, 16.7% for AGIs over 200k)
Charity contributions: $3,466 (reported on 28.5% of returns)
Here:
$3,466
State:
$4,659
(% of AGI for various income ranges: 0.8% for AGIs below $25k, 1.6% for AGIs $25k-50k, 2.1% for AGIs $50k-75k, 2.3% for AGIs $75k-100k, 2.7% for AGIs $100k-200k, 2.3% for AGIs over 200k)
Taxes paid: $7,112 (reported on 34.5% of returns)
92308:
$7,112
State:
$14,448
(% of AGI for various income ranges: 2.0% for AGIs below $25k, 2.9% for AGIs $25k-50k, 4.0% for AGIs $50k-75k, 5.1% for AGIs $75k-100k, 6.5% for AGIs $100k-200k, 9.8% for AGIs over 200k)
Earned income credit: $2,753 (reported on 26.5% of returns)
Here:
$2,753
State:
$2,286
(% of AGI for various income ranges: 10.6% for AGIs below $25k, 1.6% for AGIs $25k-50k)
Percentage of individuals using paid preparers for their 2012 taxes: 63.4%
Here:
63%
State:
64%
(% for various income ranges: 56.7% for AGIs below $25k, 65.0% for AGIs $25k-50k, 68.8% for AGIs $50k-75k, 70.7% for AGIs $75k-100k, 72.5% for AGIs $100k-200k, 90.5% for AGIs over 200k)
Averages for the 2004 tax year for zip code 92308, filed in 2005:
Average Adjusted Gross Income (AGI) in 2004: $42,221 (Individual Income Tax Returns)
Here:
$42,221
State:
$58,600
Salary/wage: $38,396 (reported on 79.6% of returns)
Here:
$38,396
State:
$49,455
(% of AGI for various income ranges: 98.6% for AGIs below $10k, 69.3% for AGIs $10k-25k, 77.2% for AGIs $25k-50k, 78.6% for AGIs $50k-75k, 77.5% for AGIs $75k-100k, 61.6% for AGIs over 100k)
Taxable interest for individuals: $1,187 (reported on 42.7% of returns)
This zip code:
$1,187
California:
$2,365
(% of AGI for various income ranges: 5.2% for AGIs below $10k, 2.2% for AGIs $10k-25k, 1.2% for AGIs $25k-50k, 0.9% for AGIs $50k-75k, 0.8% for AGIs $75k-100k, 1.0% for AGIs over 100k)
Taxable dividends: $1,621 (reported on 14.8% of returns)
Here:
$1,621
State:
$4,746
(% of AGI for various income ranges: 2.7% for AGIs below $10k, 0.9% for AGIs $10k-25k, 0.6% for AGIs $25k-50k, 0.5% for AGIs $50k-75k, 0.5% for AGIs $75k-100k, 0.5% for AGIs over 100k)
Net capital gain/loss: +$11,627 (reported on 14.1% of returns)
Here:
+$11,627
State:
+$23,418
(% of AGI for various income ranges: -2.6% for AGIs below $10k, 0.4% for AGIs $10k-25k, 0.8% for AGIs $25k-50k, 1.1% for AGIs $50k-75k, 2.6% for AGIs $75k-100k, 10.2% for AGIs over 100k)
Profit/loss from business: +$12,036 (reported on 16.4% of returns)
Here:
+$12,036
State:
+$16,826
(% of AGI for various income ranges: 6.3% for AGIs below $10k, 8.2% for AGIs $10k-25k, 2.7% for AGIs $25k-50k, 3.0% for AGIs $50k-75k, 2.1% for AGIs $75k-100k, 7.3% for AGIs over 100k)
IRA payment deduction: $3,491 (reported on 1.9% of returns)
92308:
$3,491
California:
$3,192
(% of AGI for various income ranges: 0.1% for AGIs $10k-25k, 0.2% for AGIs $25k-50k, 0.2% for AGIs $50k-75k, 0.2% for AGIs $75k-100k, 0.1% for AGIs over 100k)
Self-employed pension: $16,576 (reported on 0.5% of returns)
Here:
$16,576
California:
$17,688
Total itemized deductions: $20,043 (28% of AGI, reported on 40.9% of returns)
Here:
$20,043
State:
$28,113
Here:
28.3% of AGI
State:
25.3% of AGI
(% of AGI for various income ranges: 28.1% for AGIs below $10k, 14.2% for AGIs $10k-25k, 19.1% for AGIs $25k-50k, 21.8% for AGIs $50k-75k, 22.2% for AGIs $75k-100k, 17.9% for AGIs over 100k)
Charity contributions deductions: $2,865 (4% of AGI, reported on 36.2% of returns)
Here:
$2,865
State:
$3,923
Here:
3.9% of AGI
State:
3.3% of AGI
(% of AGI for various income ranges: 1.4% for AGIs below $10k, 1.3% for AGIs $10k-25k, 2.1% for AGIs $25k-50k, 2.7% for AGIs $50k-75k, 3.0% for AGIs $75k-100k, 2.7% for AGIs over 100k)
Total tax: $5,838 (reported on 69.6% of returns)
92308:
$5,838
State:
$10,761
(% of AGI for various income ranges: 3.8% for AGIs below $10k, 3.6% for AGIs $10k-25k, 5.2% for AGIs $25k-50k, 7.3% for AGIs $50k-75k, 8.8% for AGIs $75k-100k, 17.2% for AGIs over 100k)
Earned income credit: $1,923 (reported on 21.5% of returns)
Here:
$1,923
State:
$1,763
Percentage of individuals using paid preparers for their 2004 taxes: 69.6%
Here:
70%
State:
66%
(% for various income ranges: 59.3% for AGIs below $10k, 69.1% for AGIs $10k-25k, 72.3% for AGIs $25k-50k, 73.9% for AGIs $50k-75k, 72.8% for AGIs $75k-100k, 77.3% for AGIs over 100k)
Likely homosexual households (counted as self-reported same-sex unmarried-partner households)
Lesbian couples: 0.2% of all households
Gay men: 0.1% of all households
Household received Food Stamps/SNAP in the past 12 months: 2,748 Household did not receive Food Stamps/SNAP in the past 12 months: 11,812
Women who had a birth in the past 12 months: 638 (433 now married, 205 unmarried) Women who did not have a birth in the past 12 months: 8,092 (3,170 now married, 4,924 unmarried)
Housing units in zip code 92308 with a mortgage: 7,096 (332 second mortgage, 275 both second mortgage and home equity loan) Houses without a mortgage: 54
Median monthly owner costs for units with a mortgage: $1,674 Median monthly owner costs for units without a mortgage: $611
Residents with income below the poverty level in 2022:
This zip code:
18.5%
Whole state:
12.2%
Residents with income below 50% of the poverty level in 2022:
This zip code:
10.9%
Whole state:
6.2%
Median number of rooms in houses and condos:
Here:
6.4
State:
6.0
Median number of rooms in apartments:
Here:
5.0
State:
3.9
Notable locations in this zip code not listed on our city pages
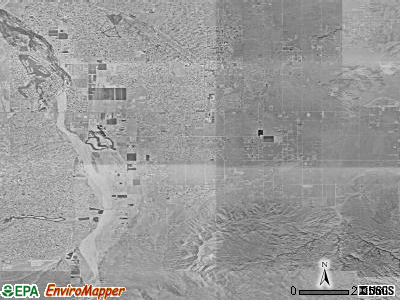
Notable locations in zip code 92308: Circle M Ranch (A), Jess Ranch (B), Bowen Ranch (C), Apple Valley Community Center (D), Apple Valley Fire Protection District Station 336 (E), Apple Valley Fire Protection District Station 337 (F), Apple Valley Fire Protection District Station 334 (G), Apple Valley Fire Protection District Station 335 (H), Victor Valley Museum (I), Apple Valley Senior Citizens Club (J). Display/hide their locations on the map
8,068 married couples with children.
3,423 single-parent households (1,035 men, 2,388 women).
75.1% of residents of 92308 zip code speak English at home.
20.3% of residents speak Spanish at home (65% very well, 21% well, 13% not well, 1% not at all).
1.3% of residents speak other Indo-European language at home (71% very well, 20% well, 9% not well).
2.2% of residents speak Asian or Pacific Island language at home (77% very well, 13% well, 9% not well).
0.8% of residents speak other language at home (93% very well, 4% well, 3% not well).
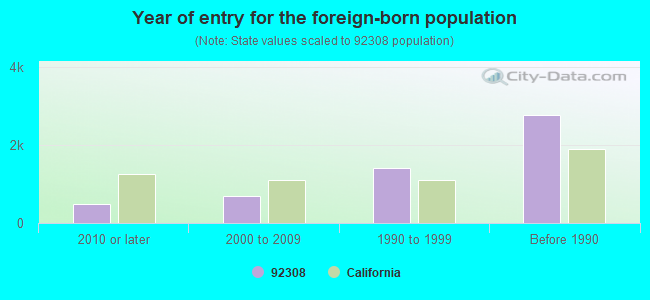
Foreign born population: 5,054 (11.8%) (56.4% of them are naturalized citizens)
Facilities with environmental interests located in this zip code:
APPLE VALLEY ALTERNATIVE EDUCATIONAL CENTER (13063 PAWNEE RD. in APPLE VALLEY, CA)
(National Center for Education Statistics) - STATE ID-3631009 Organizations: APPLE VALLEY UNIFIED (SCHOOL DISTRICT)
APPLE VALLEY HIGH (11837 NAVAJO in APPLE VALLEY, CA)
(National Center for Education Statistics) - STATE ID-3630423 Organizations: APPLE VALLEY UNIFIED (SCHOOL DISTRICT)
APPLE VALLEY MIDDLE (12555 NAVAJO ROAD in APPLE VALLEY, CA)
(National Center for Education Statistics) - STATE ID-6059539 Organizations: APPLE VALLEY UNIFIED (SCHOOL DISTRICT)
MARIANA ELEMENTARY (10601 MANHASSET ROAD in APPLE VALLEY, CA)
(National Center for Education Statistics) - STATE ID-6035240 Organizations: APPLE VALLEY UNIFIED (SCHOOL DISTRICT)
MESQUITE ELEMENTARY (12951 MESQUITE ROAD in APPLE VALLEY, CA)
(National Center for Education Statistics) - STATE ID-6110597 Organizations: APPLE VALLEY UNIFIED (SCHOOL DISTRICT)
ELECTRO CLAIM LABS REFINING (12205 CENTRAL RD in APPLE VALLEY, CA)
Small Quantity Generators, between 100 kg and 1000 kg of hazardous waste/month (Resource Conservation and Recovery Act (tracking hazardous waste)) - notification Organizations: HUNTER LARRY & GAIL A (CONTACT/OWNER)
MASTER MECHANIC (19341 BEAR VALLEY RD in APPLE VALLEY, CA)
Small Quantity Generators, between 100 kg and 1000 kg of hazardous waste/month (Resource Conservation and Recovery Act (tracking hazardous waste)) - notification Organizations: KEELER AND ASSOCIATES (CONTACT/OWNER)
GLADNEY MANUFACTURING (22230 OTTAWA ROAD in APPLE VALLEY, CA)
CRITERIA AND HAZARDOUS AIR POLLUTANT INVENTORY (Inventory of air pollution sources) Business SIC classification: WOOD PRODUCTS
Housing units lacking complete plumbing facilities: 2.0% Housing units lacking complete kitchen facilities: 3.4%
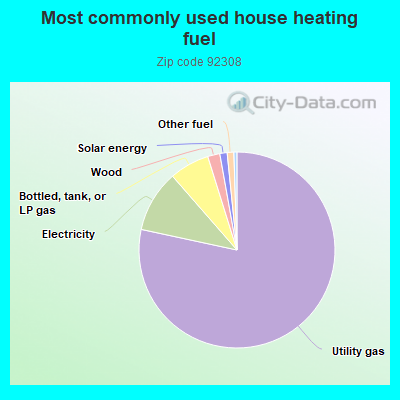
78.3%Utility gas
10.2%Electricity
6.6%Bottled, tank, or LP gas
2.0%Wood
1.2%Solar energy
1.1%Other fuel
0.5%No fuel used
Population in 1990: 24,973. Population change in the 1990s: +3,832 (+15.3%).
Place of birth for U.S.-born residents:
This state: 29,997
Northeast: 1,256
Midwest: 2,482
South: 1,969
West: 1,527
49% of the 92308 zip code residents lived in the same house 5 years ago. Out of people who lived in different houses, 70% lived in this county. Out of people who lived in different counties, 50% lived in California.
91% of the 92308 zip code residents lived in the same house 1 year ago. Out of people who lived in different houses, 63% moved from this county. Out of people who lived in different houses, 25% moved from different county within same state. Out of people who lived in different houses, 6% moved from different state. Out of people who lived in different houses, 6% moved from abroad.
Private vs. public school enrollment:
Students in private schools in grades 1 to 8 (elementary and middle school): 407
Here:
7.1%
California:
10.5%
Students in private schools in grades 9 to 12 (high school): 147
Here:
4.8%
California:
8.5%
Students in private undergraduate colleges: 122
Here:
6.8%
California:
15.9%
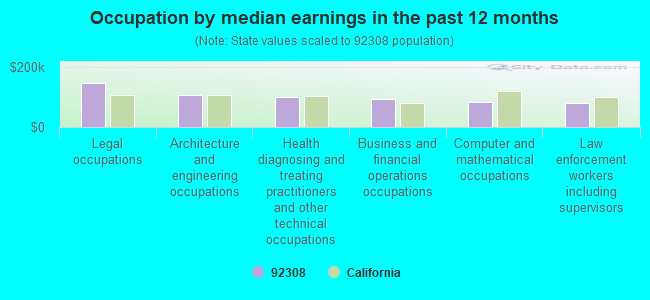
Occupation by median earnings in the past 12 months ($)
146,222Legal occupations
106,721Architecture and engineering occupations
101,156Health diagnosing and treating practitioners and other technical occupations
94,538Business and financial operations occupations
84,160Computer and mathematical occupations
78,576Law enforcement workers including supervisors
Companies with federal contracts located in this zip code (APPLE VALLEY, CA):
THE EDDY CO INC (13590 NIABI RD; small business) : $581,576 in 6 contractsfrom 2003 to 2006
Contracts for Other Defense -- Operational Systems Development (R&D), Defense Electronics and Communication Equipment -- Operational Systems Development (R&D) by Navy Signed by year:2000: $0; 2001: $0; 2002: $0; 2003: $70,000; 2004: $30,000; 2005: $437,939; 2006: $43,637.
Biggest contracts:
$250,000 with Navy for Other Defense -- Operational Systems Development (R&D). Signed on 2005-02-03. Completion date: 2006-05-01.
$187,939, same as above.Signed on 2005-09-19. Completion date: 2006-05-01.
$70,000 with Navy for Defense Electronics and Communication Equipment -- Operational Systems Development (R&D). Signed on 2003-06-13. Completion date: 2004-04-30.
$43,637 with Navy for Other Defense -- Operational Systems Development (R&D). Signed on 2006-03-06. Completion date: 2006-06-30.
VANCE ELECTRIC INC (20578 SITTING BULL RD; small business) : $476,325 in 22 contractsfrom 2000 to 2005
Contracts for Maintenance, Repair or Alteration of Real Property -- Miscellaneous Buildings, Maintenance, Repair or Alteration of Real Property -- Other Industrial Buildings, Construction of Structures and Facilities -- Office Buildings, Electrical Hardware and Supplies, and moreby Navy, Army Signed by year:2000: $17,642; 2001: $5,000; 2002: $369,035; 2003: $28,918; 2004: $55,255; 2005: $475; 2006: $0.
Biggest contracts:
$284,541 with Navy for Maintenance, Repair or Alteration of Real Property -- Miscellaneous Buildings. Signed on 2002-09-19. Completion date: 2003-02-28.
$29,009 with Navy for Maintenance, Repair or Alteration of Real Property -- Miscellaneous Buildings. Taking place in MD. Signed on 2002-09-17. Completion date: 2002-10-24.
$26,153 with Navy for Maintenance, Repair or Alteration of Real Property -- Miscellaneous Buildings. Signed on 2002-01-24. Completion date: 2002-05-24.
$23,705 with Navy for Maintenance, Repair or Alteration of Real Property -- Other Industrial Buildings. Signed on 2004-09-15. Completion date: 2004-12-29.
APPLE VALLEY FEED BIN (21942 BEAR VALLEY RD; small business) : $101,387 in 25 contractsfrom 2004 to 2006
Contracts for Forage and Feed, Live Animals, Not Raised for Food, Seeds and Nursery Stock, Saddlery, Harness, Whips, and Related Animal Furnishings, and moreby Army Signed by year:2000: $0; 2001: $0; 2002: $0; 2003: $0; 2004: $31,637; 2005: $66,728; 2006: $3,022.
Biggest contracts:
$15,618 with Army for Forage and Feed. Signed on 2004-09-27. Completion date: 2004-10-27.
$15,401 with Army for Live Animals, Not Raised for Food. Signed on 2005-06-20. Completion date: 2005-06-20.
$13,270, same as above.Signed on 2005-09-23. Completion date: 2005-10-21.
$8,026 with Army for Seeds and Nursery Stock. Signed on 2005-12-09. Completion date: 2005-12-31.
BRUCE REID (13580 NOMWAKET RD STE B; small business) : $83,118 in 2 contractsfrom 2002 to 2005
$79,200 with Defense Logistics Agency for Nails, Machine Keys, and Pins. Signed on 2002-07-01. Completion date: 2003-01-12.
$3,918 with Defense Logistics Agency for Bushings, Rings, Shims, and Spacers. Signed on 2005-01-15. Completion date: 2005-02-19.
JORDAN, JANA (13641 JOHN GLEN RD STE C; small business)
$68,684 with Army for Miscellaneous Fire Control Equipment. Signed on 2002-09-16. Completion date: 2002-10-18.
RSC (13450 NOMWAKET ROAD; small business) : $27,263 in 2 contractsin 2003
$14,188 with Army for Lease or Rental of Equipment -- Lighting Fixtures and Lamps. Signed on 2003-11-25. Completion date: 2003-11-22.
$13,075 with Army for Chemical Weapons and Equipment. Signed on 2003-09-18. Completion date: 2003-10-29.
BEAR VALLEY FABRICATORS & STEE (22060 BEAR VALLEY RD; small business)
$5,577 with Army for Plate, Sheet, Strip, and Foil; Nonferrous Base Metal. Signed on 2003-08-14. Completion date: 2003-07-31.
Top industries in this zip code by the number of employees in 2005:
Health Care and Social Assistance: Nursing Care Facilities (250-499 employees: 1 establishment)
2005 - 2018 National Fire Incident Reporting System (NFIRS) incidents
According to the data from the years 2005 - 2018 the average number of fire incidents per year is 48. The highest number of reported fire incidents - 112 took place in 2006, and the least - 6 in 2005. The data has an increasing trend.
When looking into fire subcategories, the most incidents belonged to: Outside Fires (54.1%), and Structure Fires (28.3%).
Fire incident types reported to NFIRS in Zip Code 92308


 Nearest zip codes: 92345, 92307, 92395, 92352, 92321, 92391.


 According to the data from the years 2005 - 2018 the average number of fire incidents per year is 48. The highest number of reported fire incidents - 112 took place in 2006, and the least - 6 in 2005. The data has an increasing trend.
 When looking into fire subcategories, the most incidents belonged to: Outside Fires (54.1%), and Structure Fires (28.3%).