Estimated zip code population in 2022: 18,768 Zip code population in 2010: 16,675 Zip code population in 2000: 13,135
Houses and condos: 6,740 Renter-occupied apartments: 1,468
% of renters here:
23%
State:
44%
March 2022 cost of living index in zip code 92587: 82.5 (low, U.S. average is 100)
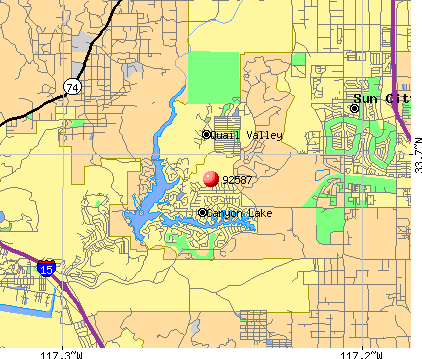
Land area: 7.9 sq. mi. Water area: 0.7 sq. mi.
Population density: 2,375 people per square mile
(low).
OSM Map
General Map
Google Map
MSN Map
OSM Map
General Map
Google Map
MSN Map
OSM Map
General Map
Google Map
MSN Map
OSM Map
General Map
Google Map
MSN Map
Please wait while loading the map...
Real estate property taxes paid for housing units in 2022:
This zip code:
0.8% ($4,274)
California:
0.7% ($4,831)
Median real estate property taxes paid for housing units with mortgages in 2022: $4,166 (0.8%) Median real estate property taxes paid for housing units with no mortgage in 2022: $4,734 (0.8%)
Estimated median house/condo value in 2022: $561,818
92587:
$561,818
California:
$715,900
According to our research of California and other state lists, there were 8 registered sex offenders living in 92587 zip code as of May 21, 2024. The ratio of all residents to sex offenders in zip code 92587 is 2,175 to 1. The ratio of registered sex offenders to all residents in this zip code is much lower than the state average.
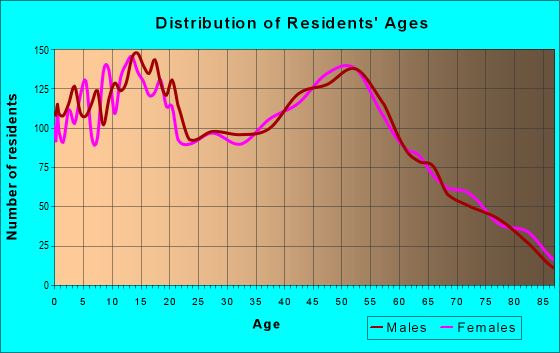
Median resident age:
This zip code:
36.5 years
California median age:
37.9 years
Average household size:
This zip code:
3.0 people
California:
2.8 people
Averages for the 2020 tax year for zip code 92587, filed in 2021:
Average Adjusted Gross Income (AGI) in 2020: $81,509 (Individual Income Tax Returns)
Here:
$81,509
State:
$95,910
Salary/wage: $71,183 (reported on 77.3% of returns)
Here:
$71,183
State:
$77,331
(% of AGI for various income ranges: 1106.7% for AGIs below $25k, 3606.4% for AGIs $25k-50k, 6879.1% for AGIs $50k-75k, 10454.0% for AGIs $75k-100k, 20319.9% for AGIs $100k-200k, 69017.8% for AGIs over 200k)
Taxable interest for individuals: $1,436 (reported on 41.2% of returns)
This zip code:
$1,436
California:
$2,294
(% of AGI for various income ranges: 16.5% for AGIs below $25k, 23.3% for AGIs $25k-50k, 59.1% for AGIs $50k-75k, 84.0% for AGIs $75k-100k, 148.5% for AGIs $100k-200k, 1270.6% for AGIs over 200k)
Ordinary dividends: $4,745 (reported on 15.4% of returns)
Here:
$4,745
State:
$10,949
(% of AGI for various income ranges: 30.7% for AGIs below $25k, 21.1% for AGIs $25k-50k, 106.3% for AGIs $50k-75k, 170.9% for AGIs $75k-100k, 205.7% for AGIs $100k-200k, 1095.0% for AGIs over 200k)
Net capital gain/loss in AGI: +$21,128 (reported on 17.3% of returns)
Here:
+$21,128
State:
+$49,306
(% of AGI for various income ranges: 3.0% for AGIs below $25k, 26.1% for AGIs $25k-50k, 93.4% for AGIs $50k-75k, 145.8% for AGIs $75k-100k, 484.9% for AGIs $100k-200k, 13684.4% for AGIs over 200k)
Profit/loss from business: +$9,249 (reported on 21.1% of returns)
Here:
+$9,249
State:
+$15,671
(% of AGI for various income ranges: 178.7% for AGIs below $25k, 295.4% for AGIs $25k-50k, 344.3% for AGIs $50k-75k, 328.7% for AGIs $75k-100k, 378.2% for AGIs $100k-200k, 1363.9% for AGIs over 200k)
Taxable individual retirement arrangement distribution: $25,503 (reported on 7.7% of returns)
92587:
$25,503
California:
$23,505
(% of AGI for various income ranges: 50.8% for AGIs below $25k, 92.8% for AGIs $25k-50k, 268.7% for AGIs $50k-75k, 414.4% for AGIs $75k-100k, 745.5% for AGIs $100k-200k, 2290.6% for AGIs over 200k)
Self-employed (Keogh) retirement plans: $17,433 (reported on 0.4% of returns)
92587:
$17,433
California:
$30,163
(% of AGI for various income ranges: 63.8% for AGIs $100k-200k)
Total itemized deductions: $31,127 (reported on 20.8% of returns)
Here:
$31,127
State:
$39,517
(% of AGI for various income ranges: 95.5% for AGIs below $25k, 250.3% for AGIs $25k-50k, 813.8% for AGIs $50k-75k, 1330.0% for AGIs $75k-100k, 2577.7% for AGIs $100k-200k, 8431.1% for AGIs over 200k)
Charity contributions: $5,743 (reported on 17.4% of returns)
Here:
$5,743
State:
$12,598
(% of AGI for various income ranges: 4.5% for AGIs below $25k, 23.9% for AGIs $25k-50k, 77.5% for AGIs $50k-75k, 166.9% for AGIs $75k-100k, 367.0% for AGIs $100k-200k, 1944.4% for AGIs over 200k)
Taxes paid: $8,737 (reported on 20.8% of returns)
92587:
$8,737
State:
$8,807
(% of AGI for various income ranges: 20.2% for AGIs below $25k, 61.2% for AGIs $25k-50k, 239.1% for AGIs $50k-75k, 412.5% for AGIs $75k-100k, 802.9% for AGIs $100k-200k, 1966.7% for AGIs over 200k)
Earned income credit: $2,123 (reported on 13.9% of returns)
Here:
$2,123
State:
$2,074
(% of AGI for various income ranges: 88.5% for AGIs below $25k, 82.9% for AGIs $25k-50k, 1.6% for AGIs $50k-75k)
Percentage of individuals using paid preparers for their 2020 taxes: 93.3%
Here:
93%
State:
92%
(% for various income ranges: 91.8% for AGIs below $25k, 93.3% for AGIs $25k-50k, 93.5% for AGIs $50k-75k, 93.3% for AGIs $75k-100k, 93.9% for AGIs $100k-200k, 96.6% for AGIs over 200k)
Averages for the 2012 tax year for zip code 92587, filed in 2013:
Average Adjusted Gross Income (AGI) in 2012: $62,986 (Individual Income Tax Returns)
Here:
$62,986
State:
$72,726
Salary/wage: $56,506 (reported on 77.3% of returns)
Here:
$56,506
State:
$59,079
(% of AGI for various income ranges: 66.8% for AGIs below $25k, 71.0% for AGIs $25k-50k, 72.4% for AGIs $50k-75k, 71.3% for AGIs $75k-100k, 73.3% for AGIs $100k-200k, 58.1% for AGIs over 200k)
Taxable interest for individuals: $1,577 (reported on 41.2% of returns)
This zip code:
$1,577
California:
$2,146
(% of AGI for various income ranges: 1.8% for AGIs below $25k, 0.8% for AGIs $25k-50k, 0.8% for AGIs $50k-75k, 0.6% for AGIs $75k-100k, 1.0% for AGIs $100k-200k, 1.5% for AGIs over 200k)
Ordinary dividends: $4,207 (reported on 16.3% of returns)
Here:
$4,207
State:
$9,308
(% of AGI for various income ranges: 1.3% for AGIs below $25k, 1.4% for AGIs $25k-50k, 1.1% for AGIs $50k-75k, 1.0% for AGIs $75k-100k, 1.0% for AGIs $100k-200k, 1.1% for AGIs over 200k)
Net capital gain/loss in AGI: +$6,460 (reported on 16.4% of returns)
Here:
+$6,460
State:
+$30,460
(% of AGI for various income ranges: 0.3% for AGIs $75k-100k, 0.6% for AGIs $100k-200k, 8.1% for AGIs over 200k)
Profit/loss from business: +$11,927 (reported on 21.4% of returns)
Here:
+$11,927
State:
+$17,064
(% of AGI for various income ranges: 14.6% for AGIs below $25k, 6.4% for AGIs $25k-50k, 4.3% for AGIs $50k-75k, 3.7% for AGIs $75k-100k, 2.6% for AGIs $100k-200k, 1.2% for AGIs over 200k)
Taxable individual retirement arrangement distribution: $18,901 (reported on 10.6% of returns)
92587:
$18,901
California:
$19,557
(% of AGI for various income ranges: 2.6% for AGIs below $25k, 3.6% for AGIs $25k-50k, 3.2% for AGIs $50k-75k, 3.0% for AGIs $75k-100k, 3.6% for AGIs $100k-200k, 2.5% for AGIs over 200k)
Self-employment retirement plans: $13,667 (reported on 0.4% of returns)
92587:
$13,667
California:
$24,530
Total itemized deductions: $27,502 (27% of AGI, reported on 46.4% of returns)
Here:
$27,502
State:
$34,004
Here:
27.2% of AGI
State:
22.7% of AGI
(% of AGI for various income ranges: 17.0% for AGIs below $25k, 17.2% for AGIs $25k-50k, 22.4% for AGIs $50k-75k, 21.1% for AGIs $75k-100k, 21.4% for AGIs $100k-200k, 19.0% for AGIs over 200k)
Charity contributions: $2,746 (reported on 38.9% of returns)
Here:
$2,746
State:
$4,659
(% of AGI for various income ranges: 0.9% for AGIs below $25k, 1.4% for AGIs $25k-50k, 1.9% for AGIs $50k-75k, 1.9% for AGIs $75k-100k, 2.0% for AGIs $100k-200k, 1.4% for AGIs over 200k)
Taxes paid: $8,769 (reported on 46.4% of returns)
92587:
$8,769
State:
$14,448
(% of AGI for various income ranges: 3.3% for AGIs below $25k, 3.9% for AGIs $25k-50k, 5.5% for AGIs $50k-75k, 6.1% for AGIs $75k-100k, 7.4% for AGIs $100k-200k, 8.6% for AGIs over 200k)
Earned income credit: $2,253 (reported on 17.6% of returns)
Here:
$2,253
State:
$2,286
(% of AGI for various income ranges: 6.6% for AGIs below $25k, 1.5% for AGIs $25k-50k)
Percentage of individuals using paid preparers for their 2012 taxes: 67.1%
Here:
67%
State:
64%
(% for various income ranges: 60.7% for AGIs below $25k, 65.5% for AGIs $25k-50k, 70.7% for AGIs $50k-75k, 71.6% for AGIs $75k-100k, 74.8% for AGIs $100k-200k, 79.2% for AGIs over 200k)
Averages for the 2004 tax year for zip code 92587, filed in 2005:
Average Adjusted Gross Income (AGI) in 2004: $61,237 (Individual Income Tax Returns)
Here:
$61,237
State:
$58,600
Salary/wage: $53,340 (reported on 76.8% of returns)
Here:
$53,340
State:
$49,455
(% of AGI for various income ranges: 166.8% for AGIs below $10k, 64.6% for AGIs $10k-25k, 71.0% for AGIs $25k-50k, 71.6% for AGIs $50k-75k, 73.3% for AGIs $75k-100k, 61.5% for AGIs over 100k)
Taxable interest for individuals: $2,161 (reported on 54.3% of returns)
This zip code:
$2,161
California:
$2,365
(% of AGI for various income ranges: 18.7% for AGIs below $10k, 3.6% for AGIs $10k-25k, 2.4% for AGIs $25k-50k, 1.9% for AGIs $50k-75k, 1.6% for AGIs $75k-100k, 1.5% for AGIs over 100k)
Taxable dividends: $2,839 (reported on 23.8% of returns)
Here:
$2,839
State:
$4,746
(% of AGI for various income ranges: 8.5% for AGIs below $10k, 2.0% for AGIs $10k-25k, 1.3% for AGIs $25k-50k, 1.1% for AGIs $50k-75k, 1.1% for AGIs $75k-100k, 0.9% for AGIs over 100k)
Net capital gain/loss: +$19,139 (reported on 23.5% of returns)
Here:
+$19,139
State:
+$23,418
(% of AGI for various income ranges: -6.6% for AGIs below $10k, 0.3% for AGIs $10k-25k, 0.9% for AGIs $25k-50k, 1.8% for AGIs $50k-75k, 2.3% for AGIs $75k-100k, 13.2% for AGIs over 100k)
Profit/loss from business: +$16,665 (reported on 22.7% of returns)
Here:
+$16,665
State:
+$16,826
(% of AGI for various income ranges: 22.2% for AGIs below $10k, 11.7% for AGIs $10k-25k, 7.2% for AGIs $25k-50k, 4.5% for AGIs $50k-75k, 5.2% for AGIs $75k-100k, 6.0% for AGIs over 100k)
IRA payment deduction: $3,603 (reported on 3.2% of returns)
92587:
$3,603
California:
$3,192
(% of AGI for various income ranges: 0.1% for AGIs $10k-25k, 0.2% for AGIs $25k-50k, 0.2% for AGIs $50k-75k, 0.2% for AGIs $75k-100k, 0.2% for AGIs over 100k)
Self-employed pension: $16,071 (reported on 1.4% of returns)
Here:
$16,071
California:
$17,688
(% of AGI for various income ranges: 0.2% for AGIs $50k-75k, 0.3% for AGIs $75k-100k, 0.6% for AGIs over 100k)
Total itemized deductions: $26,946 (29% of AGI, reported on 56.6% of returns)
Here:
$26,946
State:
$28,113
Here:
29.3% of AGI
State:
25.3% of AGI
(% of AGI for various income ranges: 75.7% for AGIs below $10k, 25.2% for AGIs $10k-25k, 27.0% for AGIs $25k-50k, 29.3% for AGIs $50k-75k, 28.0% for AGIs $75k-100k, 21.4% for AGIs over 100k)
Charity contributions deductions: $3,011 (3% of AGI, reported on 50.1% of returns)
Here:
$3,011
State:
$3,923
Here:
3.1% of AGI
State:
3.3% of AGI
(% of AGI for various income ranges: 3.3% for AGIs below $10k, 1.7% for AGIs $10k-25k, 2.3% for AGIs $25k-50k, 2.6% for AGIs $50k-75k, 2.7% for AGIs $75k-100k, 2.4% for AGIs over 100k)
Total tax: $9,273 (reported on 77.6% of returns)
92587:
$9,273
State:
$10,761
(% of AGI for various income ranges: 8.9% for AGIs below $10k, 4.7% for AGIs $10k-25k, 5.8% for AGIs $25k-50k, 7.3% for AGIs $50k-75k, 9.1% for AGIs $75k-100k, 16.2% for AGIs over 100k)
Earned income credit: $1,728 (reported on 11.9% of returns)
Here:
$1,728
State:
$1,763
Percentage of individuals using paid preparers for their 2004 taxes: 72.7%
Here:
73%
State:
66%
(% for various income ranges: 61.6% for AGIs below $10k, 68.6% for AGIs $10k-25k, 71.6% for AGIs $25k-50k, 78.5% for AGIs $50k-75k, 76.0% for AGIs $75k-100k, 82.1% for AGIs over 100k)
Household received Food Stamps/SNAP in the past 12 months: 649 Household did not receive Food Stamps/SNAP in the past 12 months: 5,634
Women who had a birth in the past 12 months: 140 (96 now married, 44 unmarried) Women who did not have a birth in the past 12 months: 3,811 (1,916 now married, 1,877 unmarried)
Housing units in zip code 92587 with a mortgage: 3,504 (218 second mortgage, 7 home equity loan, 146 both second mortgage and home equity loan) Houses without a mortgage: 15
Median monthly owner costs for units with a mortgage: $2,478 Median monthly owner costs for units without a mortgage: $830
Residents with income below the poverty level in 2022:
This zip code:
14.5%
Whole state:
12.2%
Residents with income below 50% of the poverty level in 2022:
This zip code:
5.7%
Whole state:
6.2%
Median number of rooms in houses and condos:
Here:
6.4
State:
6.0
Median number of rooms in apartments:
Here:
5.0
State:
3.9
Notable locations in this zip code not listed on our city pages
Notable locations in zip code 92587: Canyon Lake Country Club (A), Quail Valley Country Club (B), American Medical Response Canyon Lake (C), Canyon Lake Chamber of Commerce (D), Canyon Lake Branch Riverside City and County Public Library (E), Riverside County Fire Department Station 5 - Quail Valley (F), Riverside County Fire Department Station 60 - Canyon Lake (G). Display/hide their locations on the map
In group quarters: 25 (-1 institutionalized population)
Size of family households: 1,792 2-persons, 1,077 3-persons, 1,019 4-persons, 545 5-persons, 257 6-persons, 56 7-or-more-persons
Size of nonfamily households: 1,173 1-person, 291 2-persons, 84 3-persons
3,216 married couples with children.
1,097 single-parent households (188 men, 909 women).
78.8% of residents of 92587 zip code speak English at home.
18.3% of residents speak Spanish at home (72% very well, 10% well, 11% not well, 7% not at all).
0.3% of residents speak other Indo-European language at home (100% very well).
1.8% of residents speak Asian or Pacific Island language at home (89% very well, 9% well, 2% not well).
0.2% of residents speak other language at home (71% very well, 29% well).
Foreign born population: 1,877 (10.0%) (52.7% of them are naturalized citizens)
This zip code:
10.0%
Whole state:
26.7%
58%Honduras
6%United Kingdom, excluding England and Scotland
5%Sweden
5%Costa Rica
4%Malaysia
3%Taiwan
2%Uruguay
7%English
6%Italian
5%German
5%Irish
3%American
2%European
1%Scotch-Irish
Year of entry for the foreign-born population
3002010 or later
3092000 to 2009
4581990 to 1999
916Before 1990
Facilities with environmental interests located in this zip code:
LAKESIDE CHEV & OLDS CO (HWY 395 & 74 in SUN CITY, CA)
Small Quantity Generators, between 100 kg and 1000 kg of hazardous waste/month (Resource Conservation and Recovery Act (tracking hazardous waste))
Housing units lacking complete plumbing facilities: 0.3% Housing units lacking complete kitchen facilities: 1.2%
67.9%Electricity
15.6%Bottled, tank, or LP gas
10.8%Utility gas
3.1%Solar energy
1.4%No fuel used
0.8%Wood
Population in 1990: 12,522. Population change in the 1990s: +613 (+4.9%).
Place of birth for U.S.-born residents:
This state: 12,850
Northeast: 952
Midwest: 1,718
South: 679
West: 482
47% of the 92587 zip code residents lived in the same house 5 years ago. Out of people who lived in different houses, 54% lived in this county. Out of people who lived in different counties, 50% lived in California.
86% of the 92587 zip code residents lived in the same house 1 year ago. Out of people who lived in different houses, 61% moved from this county. Out of people who lived in different houses, 26% moved from different county within same state. Out of people who lived in different houses, 10% moved from different state. Out of people who lived in different houses, 1% moved from abroad.
Private vs. public school enrollment:
Students in private schools in grades 1 to 8 (elementary and middle school): 76
Here:
3.8%
California:
10.5%
Students in private schools in grades 9 to 12 (high school): 73
Here:
7.8%
California:
8.5%
Students in private undergraduate colleges: 266
Here:
36.1%
California:
15.9%
Occupation by median earnings in the past 12 months ($)
161,608Computer and mathematical occupations
158,751Fire fighting and prevention, and other protective service workers including supervisors
106,455Management occupations
85,219Community and social service occupations
84,350Health diagnosing and treating practitioners and other technical occupations
78,123Education, training, and library occupations
Companies with federal contracts located in this zip code:
WESTERN VIDEO, INC (31678 RAILROAD CANYON RD in SUN CITY, CA; small business) : $2,656,683 in 80 contractsfrom 1999 to 2006
Contracts for Video Recording and Reproducing Equipment, Miscellaneous Electrical and Electronic Components, Radio and Television Communication Equipment, Except Airborne, Optical Instruments, Test Equipment, Components and Accessories, and moreby Air Force, NASA, Navy, Army, and others Signed by year:2000: $268,268; 2001: $436,780; 2002: $490,164; 2003: $143,811; 2004: $409,588; 2005: $374,758; 2006: $291,151.
Biggest contracts:
$264,939 with Air Force for Video Recording and Reproducing Equipment. Signed on 2006-06-28. Completion date: 2006-09-29.
$263,000 with NASA for Miscellaneous Electrical and Electronic Components. Signed on 2002-05-15. Completion date: 2002-05-15.
$245,516, same as above.Signed on 2005-05-04. Completion date: 2006-05-31.
$165,000, same as above.Signed on 1999-12-15. Completion date: 2000-05-15.
FRANK WARGO JR (24311 CANYON LAKE DR N#13 in SUN CITY, CA; small business) : $157,369 in 9 contractsfrom 2002 to 2005
Contracts for Hardware, Commercial, Brackets, Electron Tubes and Associated Hardware by Navy Signed by year:2000: $0; 2001: $0; 2002: $44,689; 2003: $27,570; 2004: $81,510; 2005: $3,600; 2006: $0.
Biggest contracts:
$44,689 with Navy for Hardware, Commercial. Signed on 2002-11-27. Completion date: 2002-12-30.
$36,530 with Navy for Brackets. Signed on 2004-09-30. Completion date: 2004-11-26.
$24,650, same as above.Signed on 2004-04-14. Completion date: 2004-06-18.
$15,935 with Navy for Hardware, Commercial. Signed on 2003-08-02. Completion date: 2003-09-15.
BEEMAN PLUMBING & MECHANICAL, (29796 SMUGGLERS POINT DR. in SUN CITY, CA; small business) : $41,378 in 2 contractsfrom 1999 to 2000
$21,199 with Navy for Maintenance, Repair or Alteration of Real Property -- Heating and Cooling Plants. Signed on 1999-10-01. Completion date: 1999-08-18.
$20,179 with Navy for Maintenance, Repair or Alteration of Real Property -- Office Buildings. Signed on 2000-08-03. Completion date: 2000-09-27.
BRADEN ENGINEERING (31630 RAILROAD CANYON RD in CANYON LAKE, CA; small business)
$33,162 with Air Force for ADP System Acquisition Support Services. Includes preparation of statement of work, benchmarks, specifications, etc.. Signed on 2002-05-30. Completion date: 2002-07-31.
CHAMPION HARDWOOD FLOORS (29931 WHITE SAIL PL in SUN CITY, CA; small business)
$4,950 with Navy for Athletic and Sporting Equipment. Signed on 2005-09-13. Completion date: 2005-10-11.
Top industries in this zip code by the number of employees in 2005:
Other Services (except Public Administration): Other Similar Organizations (except Business, Professional, Labor, and Political Organizations) (100-249 employees: 1 establishment, 20-49 employees: 1 establishment)
2006 - 2018 National Fire Incident Reporting System (NFIRS) incidents
Based on the data from the years 2006 - 2018 the average number of fire incidents per year is 28. The highest number of fires - 37 took place in 2007, and the least - 10 in 2006. The data has an increasing trend.
When looking into fire subcategories, the most incidents belonged to: Outside Fires (51.9%), and Structure Fires (26.9%).
Fire incident types reported to NFIRS in Zip Code 92587


 Nearest zip codes: 92532, 92586, 92595, 92584, 92585, 92570.


 Based on the data from the years 2006 - 2018 the average number of fire incidents per year is 28. The highest number of fires - 37 took place in 2007, and the least - 10 in 2006. The data has an increasing trend.
 When looking into fire subcategories, the most incidents belonged to: Outside Fires (51.9%), and Structure Fires (26.9%).