Estimated zip code population in 2022: 32,332 Zip code population in 2010: 31,868 Zip code population in 2000: 31,168
Houses and condos: 11,115 Renter-occupied apartments: 6,068
% of renters here:
58%
State:
44%
March 2022 cost of living index in zip code 93703: 96.1 (near average, U.S. average is 100)
Land area: 4.7 sq. mi. Water area: 0.0 sq. mi.
Population density: 6,839 people per square mile
(high).
OSM Map
General Map
Google Map
MSN Map
OSM Map
General Map
Google Map
MSN Map
OSM Map
General Map
Google Map
MSN Map
OSM Map
General Map
Google Map
MSN Map
Please wait while loading the map...
Real estate property taxes paid for housing units in 2022:
This zip code:
0.7% ($1,566)
California:
0.7% ($4,831)
Median real estate property taxes paid for housing units with mortgages in 2022: $1,734 (0.7%) Median real estate property taxes paid for housing units with no mortgage in 2022: $1,293 (0.6%)
Averages for the 2020 tax year for zip code 93703, filed in 2021:
Average Adjusted Gross Income (AGI) in 2020: $32,646 (Individual Income Tax Returns)
Here:
$32,646
State:
$95,910
Salary/wage: $30,374 (reported on 85.4% of returns)
Here:
$30,374
State:
$77,331
(% of AGI for various income ranges: 1252.2% for AGIs below $25k, 3813.9% for AGIs $25k-50k, 7590.6% for AGIs $50k-75k, 11772.1% for AGIs $75k-100k, 16868.9% for AGIs $100k-200k)
Taxable interest for individuals: $335 (reported on 14.9% of returns)
This zip code:
$335
California:
$2,294
(% of AGI for various income ranges: 2.8% for AGIs below $25k, 5.0% for AGIs $25k-50k, 11.5% for AGIs $50k-75k, 15.5% for AGIs $75k-100k, 100.5% for AGIs $100k-200k)
Ordinary dividends: $2,294 (reported on 2.4% of returns)
Here:
$2,294
State:
$10,949
(% of AGI for various income ranges: 2.4% for AGIs below $25k, 4.2% for AGIs $25k-50k, 9.5% for AGIs $50k-75k, 16.4% for AGIs $75k-100k, 181.6% for AGIs $100k-200k)
Net capital gain/loss in AGI: +$4,905 (reported on 3.1% of returns)
Here:
+$4,905
State:
+$49,306
(% of AGI for various income ranges: 1.5% for AGIs $25k-50k, 17.4% for AGIs $50k-75k, 27.0% for AGIs $75k-100k, 938.4% for AGIs $100k-200k)
Profit/loss from business: +$7,723 (reported on 13.2% of returns)
Here:
+$7,723
State:
+$15,671
(% of AGI for various income ranges: 137.9% for AGIs below $25k, 97.6% for AGIs $25k-50k, 165.4% for AGIs $50k-75k, 249.7% for AGIs $75k-100k, 632.1% for AGIs $100k-200k)
Taxable individual retirement arrangement distribution: $11,776 (reported on 1.8% of returns)
93703:
$11,776
California:
$23,505
(% of AGI for various income ranges: 8.9% for AGIs below $25k, 21.5% for AGIs $25k-50k, 58.7% for AGIs $50k-75k, 157.6% for AGIs $75k-100k, 277.4% for AGIs $100k-200k)
Total itemized deductions: $23,250 (reported on 2.2% of returns)
Here:
$23,250
State:
$39,517
(% of AGI for various income ranges: 5.7% for AGIs below $25k, 54.3% for AGIs $25k-50k, 177.7% for AGIs $50k-75k, 306.1% for AGIs $75k-100k, 864.7% for AGIs $100k-200k)
Charity contributions: $5,395 (reported on 1.4% of returns)
Here:
$5,395
State:
$12,598
(% of AGI for various income ranges: 5.4% for AGIs $25k-50k, 37.3% for AGIs $50k-75k, 55.2% for AGIs $75k-100k, 147.4% for AGIs $100k-200k)
Taxes paid: $5,563 (reported on 2.2% of returns)
93703:
$5,563
State:
$8,807
(% of AGI for various income ranges: 11.3% for AGIs $25k-50k, 43.2% for AGIs $50k-75k, 103.3% for AGIs $75k-100k, 219.5% for AGIs $100k-200k)
Earned income credit: $2,566 (reported on 35.0% of returns)
Here:
$2,566
State:
$2,074
(% of AGI for various income ranges: 163.1% for AGIs below $25k, 123.2% for AGIs $25k-50k, 2.5% for AGIs $50k-75k)
Percentage of individuals using paid preparers for their 2020 taxes: 90.7%
Here:
91%
State:
92%
(% for various income ranges: 89.9% for AGIs below $25k, 91.6% for AGIs $25k-50k, 91.4% for AGIs $50k-75k, 89.7% for AGIs $75k-100k, 90.6% for AGIs $100k-200k, 100.0% for AGIs over 200k)
Averages for the 2012 tax year for zip code 93703, filed in 2013:
Average Adjusted Gross Income (AGI) in 2012: $26,279 (Individual Income Tax Returns)
Here:
$26,279
State:
$72,726
Salary/wage: $24,038 (reported on 86.2% of returns)
Here:
$24,038
State:
$59,079
(% of AGI for various income ranges: 77.8% for AGIs below $25k, 85.7% for AGIs $25k-50k, 77.9% for AGIs $50k-75k, 73.3% for AGIs $75k-100k, 59.6% for AGIs $100k-200k)
Taxable interest for individuals: $531 (reported on 16.0% of returns)
This zip code:
$531
California:
$2,146
(% of AGI for various income ranges: 0.3% for AGIs below $25k, 0.2% for AGIs $25k-50k, 0.5% for AGIs $50k-75k, 0.4% for AGIs $75k-100k, 0.4% for AGIs $100k-200k)
Ordinary dividends: $2,724 (reported on 4.1% of returns)
Here:
$2,724
State:
$9,308
(% of AGI for various income ranges: 0.3% for AGIs below $25k, 0.3% for AGIs $25k-50k, 0.5% for AGIs $50k-75k, 0.6% for AGIs $75k-100k, 1.2% for AGIs $100k-200k)
Net capital gain/loss in AGI: +$806 (reported on 3.1% of returns)
Here:
+$806
State:
+$30,460
(% of AGI for various income ranges: 0.1% for AGIs $25k-50k, 0.1% for AGIs $50k-75k, 0.2% for AGIs $75k-100k, 0.2% for AGIs $100k-200k)
Profit/loss from business: +$10,218 (reported on 14.3% of returns)
Here:
+$10,218
State:
+$17,064
(% of AGI for various income ranges: 11.3% for AGIs below $25k, 2.9% for AGIs $25k-50k, 2.1% for AGIs $50k-75k, 2.5% for AGIs $75k-100k, 6.0% for AGIs $100k-200k)
Taxable individual retirement arrangement distribution: $9,037 (reported on 3.2% of returns)
93703:
$9,037
California:
$19,557
(% of AGI for various income ranges: 0.6% for AGIs below $25k, 0.7% for AGIs $25k-50k, 1.1% for AGIs $50k-75k, 2.3% for AGIs $75k-100k, 3.2% for AGIs $100k-200k)
Total itemized deductions: $16,550 (29% of AGI, reported on 11.3% of returns)
Here:
$16,550
State:
$34,004
Here:
28.9% of AGI
State:
22.7% of AGI
(% of AGI for various income ranges: 3.0% for AGIs below $25k, 6.2% for AGIs $25k-50k, 10.9% for AGIs $50k-75k, 13.2% for AGIs $75k-100k, 13.6% for AGIs $100k-200k)
Charity contributions: $2,476 (reported on 8.3% of returns)
Here:
$2,476
State:
$4,659
(% of AGI for various income ranges: 0.2% for AGIs below $25k, 0.5% for AGIs $25k-50k, 1.4% for AGIs $50k-75k, 1.8% for AGIs $75k-100k, 1.9% for AGIs $100k-200k)
Taxes paid: $3,864 (reported on 11.2% of returns)
93703:
$3,864
State:
$14,448
(% of AGI for various income ranges: 0.4% for AGIs below $25k, 1.2% for AGIs $25k-50k, 2.5% for AGIs $50k-75k, 3.7% for AGIs $75k-100k, 5.0% for AGIs $100k-200k)
Earned income credit: $2,842 (reported on 46.8% of returns)
Here:
$2,842
State:
$2,286
(% of AGI for various income ranges: 13.3% for AGIs below $25k, 2.6% for AGIs $25k-50k)
Percentage of individuals using paid preparers for their 2012 taxes: 57.7%
Here:
58%
State:
64%
(% for various income ranges: 56.8% for AGIs below $25k, 57.3% for AGIs $25k-50k, 60.5% for AGIs $50k-75k, 67.9% for AGIs $75k-100k, 68.8% for AGIs $100k-200k)
Averages for the 2004 tax year for zip code 93703, filed in 2005:
Average Adjusted Gross Income (AGI) in 2004: $25,527 (Individual Income Tax Returns)
Here:
$25,527
State:
$58,600
Salary/wage: $23,714 (reported on 88.4% of returns)
Here:
$23,714
State:
$49,455
(% of AGI for various income ranges: 87.7% for AGIs below $10k, 84.2% for AGIs $10k-25k, 87.1% for AGIs $25k-50k, 82.9% for AGIs $50k-75k, 73.6% for AGIs $75k-100k, 46.7% for AGIs over 100k)
Taxable interest for individuals: $886 (reported on 24.2% of returns)
This zip code:
$886
California:
$2,365
(% of AGI for various income ranges: 1.5% for AGIs below $10k, 0.8% for AGIs $10k-25k, 0.7% for AGIs $25k-50k, 0.7% for AGIs $50k-75k, 1.0% for AGIs $75k-100k, 2.0% for AGIs over 100k)
Taxable dividends: $2,296 (reported on 6.6% of returns)
Here:
$2,296
State:
$4,746
(% of AGI for various income ranges: 0.8% for AGIs below $10k, 0.5% for AGIs $10k-25k, 0.4% for AGIs $25k-50k, 0.4% for AGIs $50k-75k, 0.9% for AGIs $75k-100k, 2.3% for AGIs over 100k)
Net capital gain/loss: +$10,266 (reported on 5.2% of returns)
Here:
+$10,266
State:
+$23,418
(% of AGI for various income ranges: -0.5% for AGIs below $10k, 0.2% for AGIs $10k-25k, 0.3% for AGIs $25k-50k, 0.5% for AGIs $50k-75k, 4.1% for AGIs $75k-100k, 24.8% for AGIs over 100k)
Profit/loss from business: +$8,452 (reported on 10.6% of returns)
Here:
+$8,452
State:
+$16,826
(% of AGI for various income ranges: 5.8% for AGIs below $10k, 4.5% for AGIs $10k-25k, 2.5% for AGIs $25k-50k, 2.3% for AGIs $50k-75k, 3.9% for AGIs $75k-100k, 7.1% for AGIs over 100k)
Profit/loss from farming: +$3,818 (reported on 0.1% of returns)
Here:
+$3,818
State:
-$7,562
IRA payment deduction: $2,387 (reported on 1.1% of returns)
93703:
$2,387
California:
$3,192
(% of AGI for various income ranges: 0.1% for AGIs $10k-25k, 0.1% for AGIs $25k-50k, 0.1% for AGIs $50k-75k, 0.3% for AGIs $75k-100k)
Total itemized deductions: $14,034 (28% of AGI, reported on 15.1% of returns)
Here:
$14,034
State:
$28,113
Here:
27.5% of AGI
State:
25.3% of AGI
(% of AGI for various income ranges: 2.5% for AGIs below $10k, 4.2% for AGIs $10k-25k, 8.6% for AGIs $25k-50k, 11.7% for AGIs $50k-75k, 14.1% for AGIs $75k-100k, 11.5% for AGIs over 100k)
Charity contributions deductions: $1,884 (4% of AGI, reported on 12.7% of returns)
Here:
$1,884
State:
$3,923
Here:
3.7% of AGI
State:
3.3% of AGI
(% of AGI for various income ranges: 0.1% for AGIs below $10k, 0.4% for AGIs $10k-25k, 0.9% for AGIs $25k-50k, 1.5% for AGIs $50k-75k, 1.8% for AGIs $75k-100k, 1.9% for AGIs over 100k)
Total tax: $2,811 (reported on 54.8% of returns)
93703:
$2,811
State:
$10,761
(% of AGI for various income ranges: 1.9% for AGIs below $10k, 2.8% for AGIs $10k-25k, 5.2% for AGIs $25k-50k, 8.5% for AGIs $50k-75k, 10.7% for AGIs $75k-100k, 15.5% for AGIs over 100k)
Earned income credit: $2,094 (reported on 39.3% of returns)
Here:
$2,094
State:
$1,763
Percentage of individuals using paid preparers for their 2004 taxes: 63.8%
Here:
64%
State:
66%
(% for various income ranges: 58.0% for AGIs below $10k, 66.8% for AGIs $10k-25k, 63.4% for AGIs $25k-50k, 66.3% for AGIs $50k-75k, 62.1% for AGIs $75k-100k, 79.4% for AGIs over 100k)
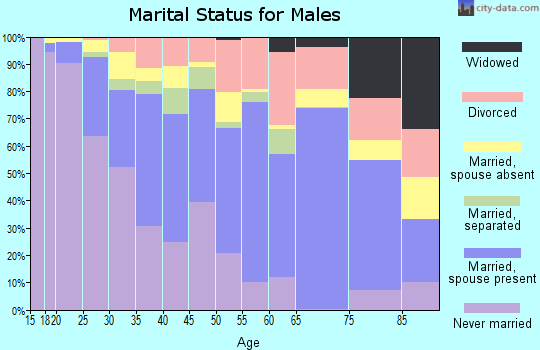
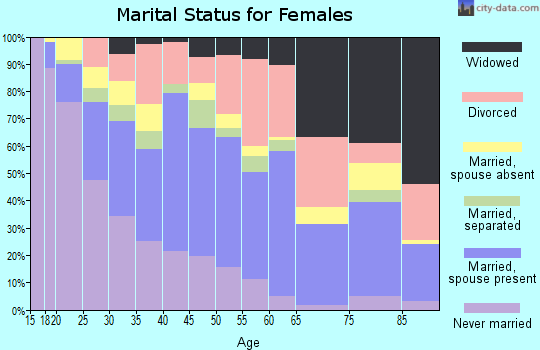
Likely homosexual households (counted as self-reported same-sex unmarried-partner households)
Lesbian couples: 0.5% of all households
Gay men: 0.1% of all households
Household received Food Stamps/SNAP in the past 12 months: 3,810 Household did not receive Food Stamps/SNAP in the past 12 months: 7,221
Women who had a birth in the past 12 months: 369 (169 now married, 202 unmarried) Women who did not have a birth in the past 12 months: 7,662 (2,473 now married, 5,212 unmarried)
Housing units in zip code 93703 with a mortgage: 2,815 (106 second mortgage, 54 both second mortgage and home equity loan) Houses without a mortgage: 78
Median monthly owner costs for units with a mortgage: $1,432 Median monthly owner costs for units without a mortgage: $467
Residents with income below the poverty level in 2022:
This zip code:
32.4%
Whole state:
12.2%
Residents with income below 50% of the poverty level in 2022:
This zip code:
17.9%
Whole state:
6.2%
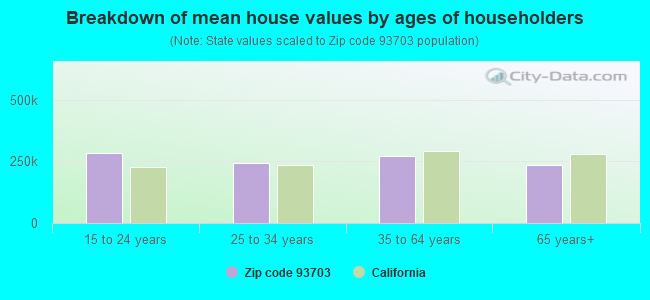
Median number of rooms in houses and condos:
Here:
5.4
State:
6.0
Median number of rooms in apartments:
Here:
4.1
State:
3.9
Notable locations in this zip code not listed on our city pages
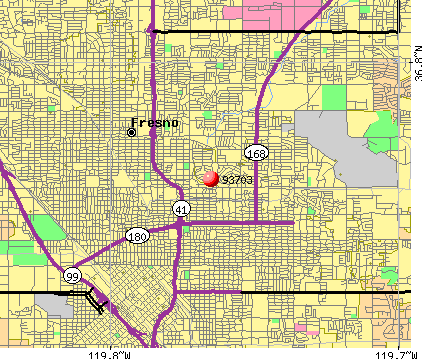
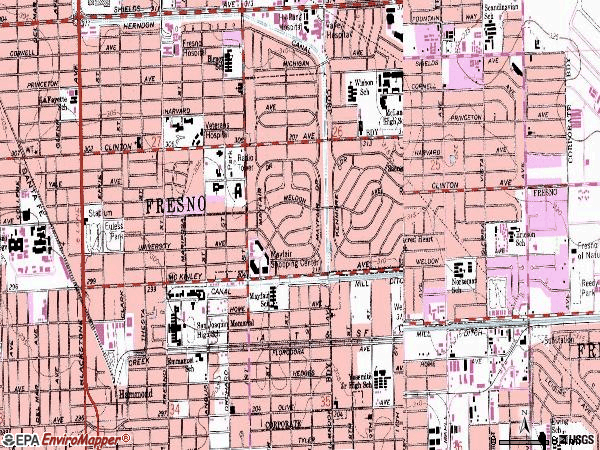
Notable locations in zip code 93703: Fresno Fine Arts Center (A), Fresno City Fire Department Station 5 (B), Fresno City Fire Department Station 1 (C). Display/hide their locations on the map
Churches in zip code 93703 include: Chestnut Avenue Baptist Church (A), Christian Life Assembly Church (B), Church of Christ Sierra Vista (C), East Princeton Baptist Church (D), Valley Christian Center (E), Zion Congregational Church (F), Central Seventh Day Adventist Church (G), First Covenant Church (H), Iglesia Cristiana Emanuel (I). Display/hide their locations on the map
In group quarters: 496 (-1 institutionalized population)
Size of family households: 1,789 2-persons, 1,582 3-persons, 1,419 4-persons, 920 5-persons, 592 6-persons, 350 7-or-more-persons
Size of nonfamily households: 3,106 1-person, 692 2-persons, 44 3-persons
3,024 married couples with children.
4,593 single-parent households (1,120 men, 3,473 women).
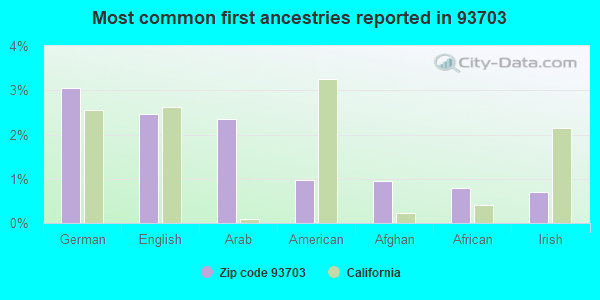
46.8% of residents of 93703 zip code speak English at home.
39.3% of residents speak Spanish at home (62% very well, 13% well, 15% not well, 10% not at all).
1.2% of residents speak other Indo-European language at home (40% very well, 41% well, 9% not well, 11% not at all).
10.5% of residents speak Asian or Pacific Island language at home (53% very well, 24% well, 18% not well, 5% not at all).
1.9% of residents speak other language at home (18% very well, 15% well, 39% not well, 28% not at all).
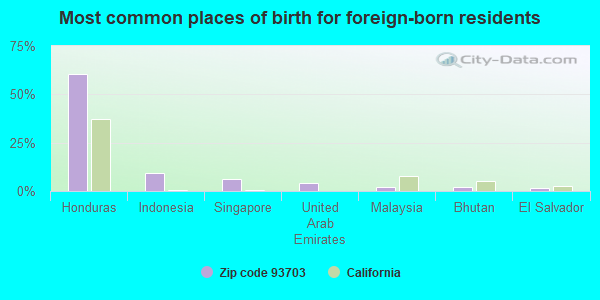
Foreign born population: 7,427 (23.0%) (43.5% of them are naturalized citizens)
Major facilities with environmental interests located in this zip code:
NORSEMAN ELEMENTARY (4636 E. WELDON AVE. in FRESNO, CA)
(National Center for Education Statistics) - STATE ID-6006423 (Resource Conservation and Recovery Act (tracking hazardous waste)) Organizations: FRESNO USD (CONTACT/OWNER)
, FRESNO UNIFIED (SCHOOL DISTRICT)
Alternative names: FRESNO USD NORSEMAN ELEM SCH
MAYFAIR ELEMENTARY (3305 E. HOME AVE. in FRESNO, CA)
(National Center for Education Statistics) - STATE ID-6006407 Small Quantity Generators, between 100 kg and 1000 kg of hazardous waste/month (Resource Conservation and Recovery Act (tracking hazardous waste)) - notification Organizations: FRESNO UNIF SCHOOL DIST (CONTACT/OWNER)
, FRESNO UNIFIED (SCHOOL DISTRICT)
Alternative names: FRESNO USD MAYFAIR ELEM
FRANCIS CLASSIC CARS (2420 E MCKINLEY in FRESNO, CA)
STATE MASTER (California - Hazardous Waste Tracking) - HAZARDOU WASTE PROGRAM Small Quantity Generators, between 100 kg and 1000 kg of hazardous waste/month (Resource Conservation and Recovery Act (tracking hazardous waste)) - notification Business NAICS classification: AUTOMOTIVE BODY, PAINT, AND INTERIOR REPAIR AND MAINTENANCE. Organizations: JEFF FRANCIS (CONTACT/OWNER)
Alternative names: JL INC DBA FRANCIS COLLISION CENTRE
GEORGES BODY PAINT (1902 E MCKINLEY in FRESNO, CA)
STATE MASTER (California - Hazardous Waste Tracking) - HAZARDOU WASTE PROGRAM Small Quantity Generators, between 100 kg and 1000 kg of hazardous waste/month (Resource Conservation and Recovery Act (tracking hazardous waste)) - notification Business NAICS classification: AUTOMOTIVE BODY, PAINT, AND INTERIOR REPAIR AND MAINTENANCE. Organizations: GEORGE SMITH (CONTACT/OWNER)
ERICSON ELEMENTARY (4774 E. YALE AVE. in FRESNO, CA)
(National Center for Education Statistics) - STATE ID-6006217 Organizations: FRESNO UNIFIED (SCHOOL DISTRICT)
FULTON SPECIAL EDUCATION (3133 N. MILLBROOK in FRESNO, CA)
(National Center for Education Statistics) - STATE ID-6112619 Organizations: FRESNO UNIFIED (SCHOOL DISTRICT)
MASTERS CRAFT AUTO PAINTING (2190 EAST MCKINLEY AVENUE in FRESNO, CA)
CRITERIA AND HAZARDOUS AIR POLLUTANT INVENTORY (Inventory of air pollution sources) (Resource Conservation and Recovery Act (tracking hazardous waste)) Business SIC classification: TOP, BODY, AND UPHOLSTERY REPAIR SHOPS AND PAINT SHOPS Organizations: BARCELLOS M (CONTACT/OWNER)
Alternative names: LARRYS MASTERCRAFT AUTO PAINT
FIBREBOARD BOX MILLWORK CORP (1420 N MAPLE in FRESNO, CA)
(Resource Conservation and Recovery Act (tracking hazardous waste)) Business NAICS classification: OTHER ANIMAL FOOD MANUFACTURING. Organizations: FIBREBOARD CORP (CONTACT/OWNER)
(Resource Conservation and Recovery Act (tracking hazardous waste)) Business NAICS classification: AUTOMOTIVE BODY, PAINT, AND INTERIOR REPAIR AND MAINTENANCE. Organizations: MATT BARCELLOS (CONTACT/OWNER)
GLIDDEN COMPANY (1311 NORTH BLACKSTONE AVE in FRESNO, CA)
Large Quantity Generators, more that 1000 kg of hazardous waste/month (Resource Conservation and Recovery Act (tracking hazardous waste)) - notification Organizations: GLIDDEN CO, THE (CONTACT/OWNER)
Alternative names: FULLER OBRIEN PAINTS
FRESNO BODY WORKS AND GARAGE (4577 E HOME AVE in FRESNO, CA)
Small Quantity Generators, between 100 kg and 1000 kg of hazardous waste/month (Resource Conservation and Recovery Act (tracking hazardous waste)) - notification Organizations: DOCKSTADER AND DOCKSTADER (CONTACT/OWNER)
FRESNO USD BIRNEY ELEM (3034 E CORNELL in FRESNO, CA)
Small Quantity Generators, between 100 kg and 1000 kg of hazardous waste/month (Resource Conservation and Recovery Act (tracking hazardous waste)) - notification Organizations: FRESNO UNIF SCHOOL DIST (CONTACT/OWNER)
Alternative names: BIRNEY ELEMENTARY
Housing units lacking complete plumbing facilities: 0.5% Housing units lacking complete kitchen facilities: 1.8%
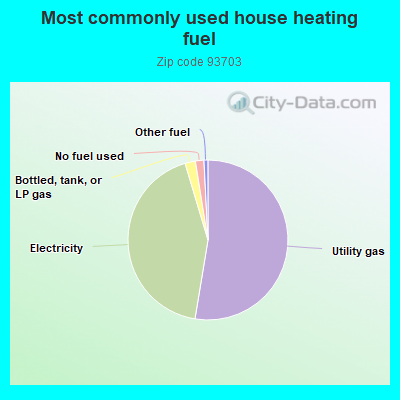
52.3%Utility gas
42.5%Electricity
2.1%Bottled, tank, or LP gas
1.7%No fuel used
0.8%Other fuel
Population in 1990: 30,457. Population change in the 1990s: +711 (+2.3%).
Place of birth for U.S.-born residents:
This state: 22,867
Northeast: 170
Midwest: 458
South: 688
West: 383
48% of the 93703 zip code residents lived in the same house 5 years ago. Out of people who lived in different houses, 86% lived in this county. Out of people who lived in different counties, 50% lived in California.
91% of the 93703 zip code residents lived in the same house 1 year ago. Out of people who lived in different houses, 84% moved from this county. Out of people who lived in different houses, 6% moved from different county within same state. Out of people who lived in different houses, 6% moved from different state. Out of people who lived in different houses, 1% moved from abroad.
Private vs. public school enrollment:
Students in private schools in grades 1 to 8 (elementary and middle school): 96
Here:
2.3%
California:
10.5%
Students in private schools in grades 9 to 12 (high school): 74
Here:
3.0%
California:
8.5%
Students in private undergraduate colleges: 137
Here:
7.2%
California:
15.9%
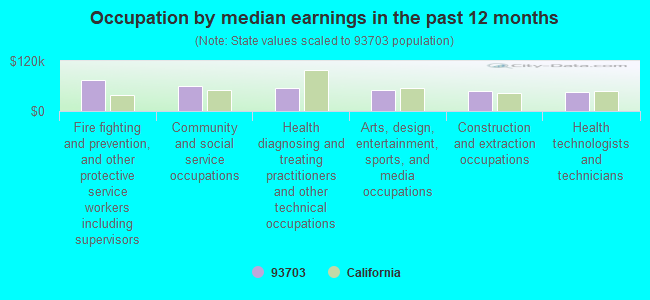
Occupation by median earnings in the past 12 months ($)
73,952Fire fighting and prevention, and other protective service workers including supervisors
59,107Community and social service occupations
54,846Health diagnosing and treating practitioners and other technical occupations
49,740Arts, design, entertainment, sports, and media occupations
47,674Construction and extraction occupations
46,715Health technologists and technicians
Companies with federal contracts located in this zip code:
SUPERIOR JANITORIAL SERVICES (1505 N. CHESTNUT AVENUE in FRESNO, CA; small business) : $29,314,897 in 118 contractsfrom 1999 to 2006
Contracts for Food Services, Custodial Janitorial Services, Operation of Government-Owned Facilities -- Other Warehouse Buildings, Mailing and Distribution Services, and moreby Air Force, Army, Federal Supply Service, Navy, and others Signed by year:2000: $4,805,409; 2001: $4,789,837; 2002: $6,539,199; 2003: $4,826,335; 2004: $261,720; 2005: $1,860,124; 2006: $62,964.
Biggest contracts:
$3,323,656 with Air Force for Food Services. Taking place in NV. Signed on 1999-10-21. Completion date: 2000-09-30.
$1,875,345 with Army for Custodial Janitorial Services. Signed on 2002-10-01. Completion date: 2003-09-30.
$1,873,002, same as above.Signed on 2003-10-01. Completion date: 2004-09-30.
$1,600,000 with Federal Supply Service for Operation of Government-Owned Facilities -- Other Warehouse Buildings. Signed on 2005-04-05. Effective on 2005-04-01. Completion date: 2005-06-30.
AMIREH, YASER (1229 N SIERRA VISTA AVE in FRESNO, CA; small business) : $127,410 in 2 contractsin 2005
$119,557 with Navy for Custodial Janitorial Services. Signed on 2005-10-04. Completion date: 2005-10-08.
$7,853, same as above.Signed on 2005-10-24. Completion date: 2005-10-28.
RICHARD A SPANGLE AIR CONDITI (1505 N THESTA in FRESNO, CA; small business) : $8,196 in 3 contractsfrom 2002 to 2004
$9,819 with Navy for Maintenance, Repair and Rebuilding of Equipment -- Refrigeration, Air Conditioning, and Air Circulating Equipment. Signed on 2002-10-01. Completion date: 2002-09-30.
$0, same as above.Signed on 2002-10-01. Completion date: 2002-09-30.
-$1,623 with Navy for Facilities Operations Support Services. Signed on 2004-12-20. Completion date: 2004-12-20.
Top industries in this zip code by the number of employees in 2005:
Administrative and Support and Waste Management and Remediation Services: Janitorial Services (500-999 employees: 1 establishment, 100-249 employees: 1 establishment, 5-9 employees: 2 establishments, 1-4 employees: 2 establishments)
Other Services (except Public Administration): Religious Organizations (500-999: 1, 10-19: 3, 5-9: 2, 1-4: 9)
Educational Services: Elementary and Secondary Schools (500-999: 1)
Health Care and Social Assistance: General Medical and Surgical Hospitals (500-999: 1)
2004 - 2018 National Fire Incident Reporting System (NFIRS) incidents
According to the data from the years 2004 - 2018 the average number of fire incidents per year is 108. The highest number of fires - 274 took place in 2018, and the least - 0 in 2005. The data has a rising trend.
When looking into fire subcategories, the most reports belonged to: Outside Fires (50.2%), and Structure Fires (33.5%).
Fire incident types reported to NFIRS in Zip Code 93703


+$3,818
-$7,562
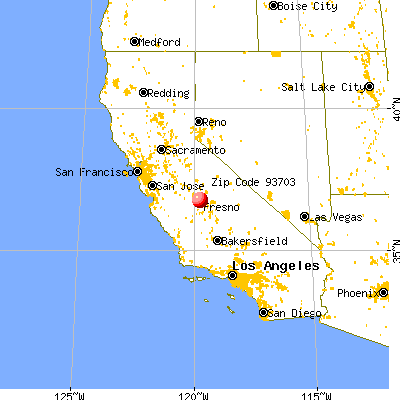
 Nearest zip codes: 93726, 93702, 93701, 93721, 93704, 93710.


 According to the data from the years 2004 - 2018 the average number of fire incidents per year is 108. The highest number of fires - 274 took place in 2018, and the least - 0 in 2005. The data has a rising trend.
 When looking into fire subcategories, the most reports belonged to: Outside Fires (50.2%), and Structure Fires (33.5%).