Estimated zip code population in 2022: 23,841 Zip code population in 2010: 22,385 Zip code population in 2000: 21,479
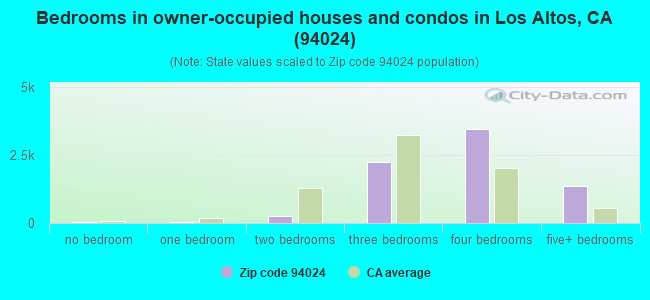
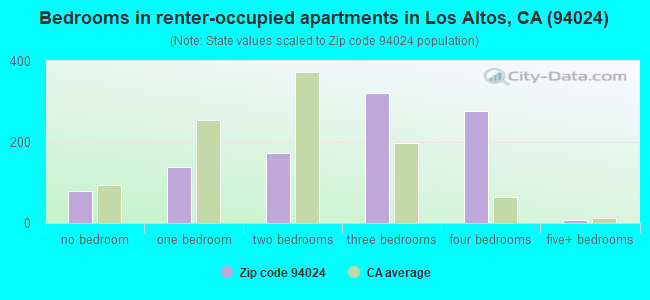
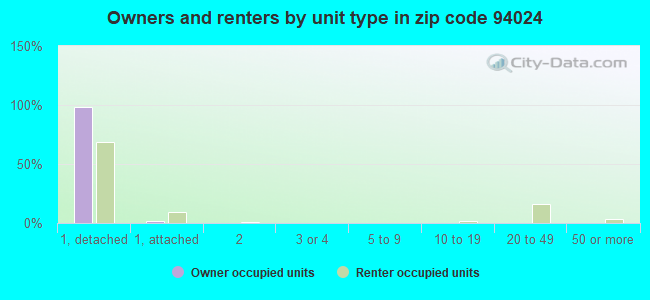
Houses and condos: 8,710 Renter-occupied apartments: 990
% of renters here:
12%
State:
44%
March 2022 cost of living index in zip code 94024: 125.1 (high, U.S. average is 100)
Land area: 7.3 sq. mi. Water area: 0.0 sq. mi.
Population density: 3,265 people per square mile
(average).
OSM Map
General Map
Google Map
MSN Map
OSM Map
General Map
Google Map
MSN Map
OSM Map
General Map
Google Map
MSN Map
OSM Map
General Map
Google Map
MSN Map
Please wait while loading the map...
Real estate property taxes paid for housing units in 2022:
This zip code:
0.5% ($10,292)
California:
0.7% ($4,831)
Median real estate property taxes paid for housing units with mortgages in 2022: $10,330 (0.5%) Median real estate property taxes paid for housing units with no mortgage in 2022: $10,572 (0.5%)
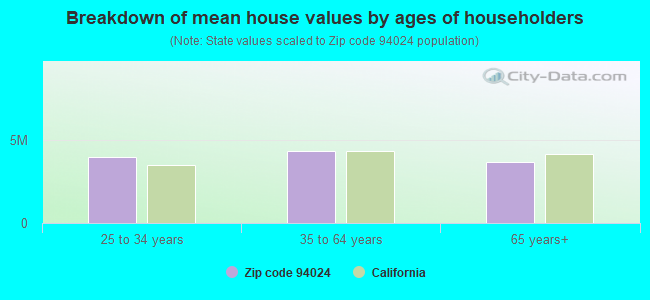
Estimated median house/condo value in 2022: $2,171,698
94024:
$2,171,698
California:
$715,900
According to our research of California and other state lists, there were 5 registered sex offenders living in 94024 zip code as of May 12, 2024. The ratio of all residents to sex offenders in zip code 94024 is 4,677 to 1. The ratio of registered sex offenders to all residents in this zip code is much lower than the state average.
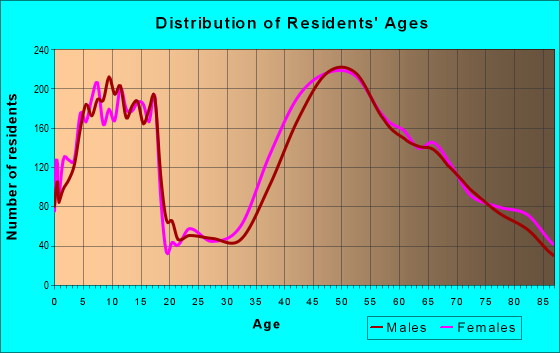
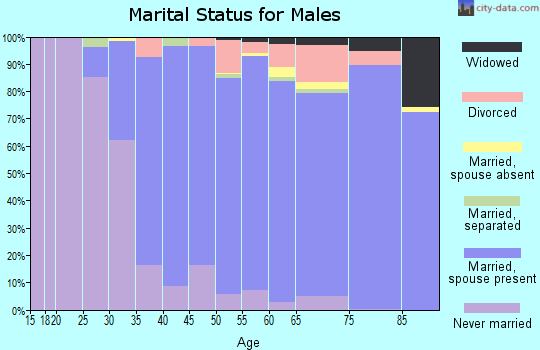
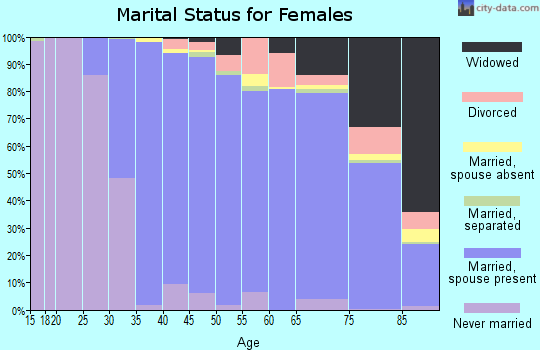
Median resident age:
This zip code:
48.2 years
California median age:
37.9 years
Average household size:
This zip code:
2.9 people
California:
2.8 people
Averages for the 2020 tax year for zip code 94024, filed in 2021:
Average Adjusted Gross Income (AGI) in 2020: $622,242 (Individual Income Tax Returns)
Here:
$622,242
State:
$95,910
Salary/wage: $514,988 (reported on 72.0% of returns)
Here:
$514,988
State:
$77,331
(% of AGI for various income ranges: 1325.7% for AGIs below $25k, 3826.9% for AGIs $25k-50k, 5886.6% for AGIs $50k-75k, 10021.0% for AGIs $75k-100k, 16773.2% for AGIs $100k-200k, 399705.2% for AGIs over 200k)
Taxable interest for individuals: $7,487 (reported on 75.4% of returns)
This zip code:
$7,487
California:
$2,294
(% of AGI for various income ranges: 90.3% for AGIs below $25k, 206.7% for AGIs $25k-50k, 371.1% for AGIs $50k-75k, 455.9% for AGIs $75k-100k, 764.5% for AGIs $100k-200k, 5374.4% for AGIs over 200k)
Ordinary dividends: $41,965 (reported on 73.1% of returns)
Here:
$41,965
State:
$10,949
(% of AGI for various income ranges: 308.4% for AGIs below $25k, 501.0% for AGIs $25k-50k, 837.6% for AGIs $50k-75k, 1462.8% for AGIs $75k-100k, 2780.9% for AGIs $100k-200k, 31440.9% for AGIs over 200k)
Net capital gain/loss in AGI: +$200,840 (reported on 70.3% of returns)
Here:
+$200,840
State:
+$49,306
(% of AGI for various income ranges: 187.6% for AGIs below $25k, 559.0% for AGIs $25k-50k, 930.5% for AGIs $50k-75k, 1444.5% for AGIs $75k-100k, 2544.7% for AGIs $100k-200k, 156926.3% for AGIs over 200k)
Profit/loss from business: +$65,574 (reported on 18.8% of returns)
Here:
+$65,574
State:
+$15,671
(% of AGI for various income ranges: 211.5% for AGIs below $25k, 532.6% for AGIs $25k-50k, 676.8% for AGIs $50k-75k, 927.9% for AGIs $75k-100k, 1452.7% for AGIs $100k-200k, 11948.8% for AGIs over 200k)
Taxable individual retirement arrangement distribution: $45,451 (reported on 15.1% of returns)
94024:
$45,451
California:
$23,505
(% of AGI for various income ranges: 93.5% for AGIs below $25k, 290.0% for AGIs $25k-50k, 765.8% for AGIs $50k-75k, 1234.8% for AGIs $75k-100k, 2952.8% for AGIs $100k-200k, 4658.5% for AGIs over 200k)
Self-employed (Keogh) retirement plans: $44,490 (reported on 5.4% of returns)
94024:
$44,490
California:
$30,163
(% of AGI for various income ranges: 179.7% for AGIs $50k-75k, 234.3% for AGIs $100k-200k, 2456.9% for AGIs over 200k)
Total itemized deductions: $81,230 (reported on 40.5% of returns)
Here:
$81,230
State:
$39,517
(% of AGI for various income ranges: 425.1% for AGIs below $25k, 832.1% for AGIs $25k-50k, 1762.4% for AGIs $50k-75k, 1906.6% for AGIs $75k-100k, 3365.0% for AGIs $100k-200k, 32832.5% for AGIs over 200k)
Charity contributions: $50,496 (reported on 35.5% of returns)
Here:
$50,496
State:
$12,598
(% of AGI for various income ranges: 13.2% for AGIs below $25k, 54.5% for AGIs $25k-50k, 166.3% for AGIs $50k-75k, 191.0% for AGIs $75k-100k, 475.7% for AGIs $100k-200k, 19835.6% for AGIs over 200k)
Taxes paid: $9,648 (reported on 40.5% of returns)
94024:
$9,648
State:
$8,807
(% of AGI for various income ranges: 75.2% for AGIs below $25k, 179.5% for AGIs $25k-50k, 345.5% for AGIs $50k-75k, 407.9% for AGIs $75k-100k, 754.1% for AGIs $100k-200k, 3457.6% for AGIs over 200k)
Earned income credit: $826 (reported on 1.7% of returns)
Here:
$826
State:
$2,074
(% of AGI for various income ranges: 14.1% for AGIs below $25k, 12.1% for AGIs $25k-50k)
Percentage of individuals using paid preparers for their 2020 taxes: 89.9%
Here:
90%
State:
92%
(% for various income ranges: 84.4% for AGIs below $25k, 87.5% for AGIs $25k-50k, 88.7% for AGIs $50k-75k, 90.5% for AGIs $75k-100k, 88.3% for AGIs $100k-200k, 92.8% for AGIs over 200k)
Averages for the 2012 tax year for zip code 94024, filed in 2013:
Average Adjusted Gross Income (AGI) in 2012: $367,208 (Individual Income Tax Returns)
Here:
$367,208
State:
$72,726
Salary/wage: $292,404 (reported on 71.8% of returns)
Here:
$292,404
State:
$59,079
(% of AGI for various income ranges: 62.0% for AGIs below $25k, 54.5% for AGIs $25k-50k, 51.3% for AGIs $50k-75k, 43.7% for AGIs $75k-100k, 52.6% for AGIs $100k-200k, 57.8% for AGIs over 200k)
Taxable interest for individuals: $6,151 (reported on 74.7% of returns)
This zip code:
$6,151
California:
$2,146
(% of AGI for various income ranges: 4.1% for AGIs below $25k, 3.7% for AGIs $25k-50k, 2.3% for AGIs $50k-75k, 2.6% for AGIs $75k-100k, 2.1% for AGIs $100k-200k, 1.1% for AGIs over 200k)
Ordinary dividends: $23,736 (reported on 69.3% of returns)
Here:
$23,736
State:
$9,308
(% of AGI for various income ranges: 13.6% for AGIs below $25k, 9.0% for AGIs $25k-50k, 8.7% for AGIs $50k-75k, 8.2% for AGIs $75k-100k, 6.9% for AGIs $100k-200k, 4.1% for AGIs over 200k)
Net capital gain/loss in AGI: +$104,905 (reported on 67.0% of returns)
Here:
+$104,905
State:
+$30,460
(% of AGI for various income ranges: 2.6% for AGIs below $25k, 2.0% for AGIs $25k-50k, 2.7% for AGIs $50k-75k, 2.9% for AGIs $75k-100k, 3.3% for AGIs $100k-200k, 21.2% for AGIs over 200k)
Profit/loss from business: +$62,069 (reported on 20.9% of returns)
Here:
+$62,069
State:
+$17,064
(% of AGI for various income ranges: 7.7% for AGIs below $25k, 8.2% for AGIs $25k-50k, 5.8% for AGIs $50k-75k, 6.3% for AGIs $75k-100k, 6.3% for AGIs $100k-200k, 3.1% for AGIs over 200k)
Taxable individual retirement arrangement distribution: $39,857 (reported on 19.3% of returns)
94024:
$39,857
California:
$19,557
(% of AGI for various income ranges: 6.0% for AGIs below $25k, 6.3% for AGIs $25k-50k, 8.4% for AGIs $50k-75k, 10.1% for AGIs $75k-100k, 8.4% for AGIs $100k-200k, 1.3% for AGIs over 200k)
Self-employment retirement plans: $30,567 (reported on 6.0% of returns)
94024:
$30,567
California:
$24,530
(% of AGI for various income ranges: 0.8% for AGIs below $25k, 1.8% for AGIs $50k-75k, 0.9% for AGIs $100k-200k, 0.5% for AGIs over 200k)
Total itemized deductions: $90,489 (17% of AGI, reported on 68.0% of returns)
Here:
$90,489
State:
$34,004
Here:
17.3% of AGI
State:
22.7% of AGI
(% of AGI for various income ranges: 35.5% for AGIs below $25k, 26.5% for AGIs $25k-50k, 21.1% for AGIs $50k-75k, 21.1% for AGIs $75k-100k, 23.8% for AGIs $100k-200k, 15.8% for AGIs over 200k)
Charity contributions: $9,957 (reported on 60.8% of returns)
Here:
$9,957
State:
$4,659
(% of AGI for various income ranges: 1.5% for AGIs below $25k, 1.5% for AGIs $25k-50k, 1.8% for AGIs $50k-75k, 2.0% for AGIs $75k-100k, 2.3% for AGIs $100k-200k, 1.6% for AGIs over 200k)
Taxes paid: $58,717 (reported on 67.7% of returns)
94024:
$58,717
State:
$14,448
(% of AGI for various income ranges: 8.4% for AGIs below $25k, 8.8% for AGIs $25k-50k, 7.0% for AGIs $50k-75k, 8.2% for AGIs $75k-100k, 10.5% for AGIs $100k-200k, 11.0% for AGIs over 200k)
Earned income credit: $912 (reported on 2.3% of returns)
Here:
$912
State:
$2,286
(% of AGI for various income ranges: 0.8% for AGIs below $25k, 0.1% for AGIs $25k-50k)
Percentage of individuals using paid preparers for their 2012 taxes: 57.9%
Here:
58%
State:
64%
(% for various income ranges: 45.5% for AGIs below $25k, 49.5% for AGIs $25k-50k, 51.3% for AGIs $50k-75k, 57.6% for AGIs $75k-100k, 59.6% for AGIs $100k-200k, 67.1% for AGIs over 200k)
Averages for the 2004 tax year for zip code 94024, filed in 2005:
Average Adjusted Gross Income (AGI) in 2004: $204,305 (Individual Income Tax Returns)
Here:
$204,305
State:
$58,600
Salary/wage: $170,301 (reported on 68.8% of returns)
Here:
$170,301
State:
$49,455
(% of AGI for various income ranges: 50.2% for AGIs $10k-25k, 50.4% for AGIs $25k-50k, 47.8% for AGIs $50k-75k, 48.4% for AGIs $75k-100k, 57.4% for AGIs over 100k)
Taxable interest for individuals: $5,951 (reported on 80.0% of returns)
This zip code:
$5,951
California:
$2,365
(% of AGI for various income ranges: 8.2% for AGIs $10k-25k, 5.7% for AGIs $25k-50k, 6.1% for AGIs $50k-75k, 4.3% for AGIs $75k-100k, 1.9% for AGIs over 100k)
Taxable dividends: $10,208 (reported on 71.7% of returns)
Here:
$10,208
State:
$4,746
(% of AGI for various income ranges: 9.6% for AGIs $10k-25k, 7.7% for AGIs $25k-50k, 7.2% for AGIs $50k-75k, 6.1% for AGIs $75k-100k, 3.1% for AGIs over 100k)
Net capital gain/loss: +$64,002 (reported on 66.9% of returns)
Here:
+$64,002
State:
+$23,418
(% of AGI for various income ranges: 4.8% for AGIs $10k-25k, 3.0% for AGIs $25k-50k, 4.1% for AGIs $50k-75k, 3.3% for AGIs $75k-100k, 22.4% for AGIs over 100k)
Profit/loss from business: +$43,107 (reported on 21.3% of returns)
Here:
+$43,107
State:
+$16,826
(% of AGI for various income ranges: 6.9% for AGIs $10k-25k, 8.4% for AGIs $25k-50k, 5.7% for AGIs $50k-75k, 8.8% for AGIs $75k-100k, 4.1% for AGIs over 100k)
IRA payment deduction: $3,964 (reported on 3.9% of returns)
94024:
$3,964
California:
$3,192
(% of AGI for various income ranges: 0.5% for AGIs $10k-25k, 0.4% for AGIs $25k-50k, 0.3% for AGIs $50k-75k, 0.3% for AGIs $75k-100k, 0.0% for AGIs over 100k)
Self-employed pension: $22,247 (reported on 6.2% of returns)
Here:
$22,247
California:
$17,688
(% of AGI for various income ranges: 0.4% for AGIs $25k-50k, 0.4% for AGIs $50k-75k, 0.9% for AGIs $75k-100k, 0.7% for AGIs over 100k)
Total itemized deductions: $65,468 (22% of AGI, reported on 64.0% of returns)
Here:
$65,468
State:
$28,113
Here:
21.7% of AGI
State:
25.3% of AGI
(% of AGI for various income ranges: 35.3% for AGIs $10k-25k, 25.3% for AGIs $25k-50k, 26.6% for AGIs $50k-75k, 26.7% for AGIs $75k-100k, 19.6% for AGIs over 100k)
Charity contributions deductions: $7,568 (2% of AGI, reported on 59.2% of returns)
Here:
$7,568
State:
$3,923
Here:
2.4% of AGI
State:
3.3% of AGI
(% of AGI for various income ranges: 2.2% for AGIs $10k-25k, 2.7% for AGIs $25k-50k, 2.4% for AGIs $50k-75k, 2.9% for AGIs $75k-100k, 2.1% for AGIs over 100k)
Total tax: $48,780 (reported on 84.3% of returns)
94024:
$48,780
State:
$10,761
(% of AGI for various income ranges: 5.2% for AGIs $10k-25k, 8.6% for AGIs $25k-50k, 10.4% for AGIs $50k-75k, 11.1% for AGIs $75k-100k, 20.9% for AGIs over 100k)
Earned income credit: $811 (reported on 1.6% of returns)
Here:
$811
State:
$1,763
Percentage of individuals using paid preparers for their 2004 taxes: 58.6%
Here:
59%
State:
66%
(% for various income ranges: 49.9% for AGIs below $10k, 51.6% for AGIs $10k-25k, 57.1% for AGIs $25k-50k, 58.3% for AGIs $50k-75k, 58.6% for AGIs $75k-100k, 63.8% for AGIs over 100k)
Likely homosexual households (counted as self-reported same-sex unmarried-partner households)
Lesbian couples: 0.1% of all households
Gay men: 0.0% of all households
Household received Food Stamps/SNAP in the past 12 months: 49 Household did not receive Food Stamps/SNAP in the past 12 months: 7,997
Women who had a birth in the past 12 months: 115 (110 now married, 4 unmarried) Women who did not have a birth in the past 12 months: 4,362 (2,451 now married, 1,881 unmarried)
Housing units in zip code 94024 with a mortgage: 4,433 (736 second mortgage, 122 home equity loan, 572 both second mortgage and home equity loan) Houses without a mortgage: 95
Median monthly owner costs for units with a mortgage: $3,876 Median monthly owner costs for units without a mortgage: $1,556
Residents with income below the poverty level in 2022:
This zip code:
2.9%
Whole state:
12.2%
Residents with income below 50% of the poverty level in 2022:
This zip code:
1.5%
Whole state:
6.2%
Median number of rooms in houses and condos:
Here:
7.4
State:
6.0
Median number of rooms in apartments:
Here:
5.3
State:
3.9
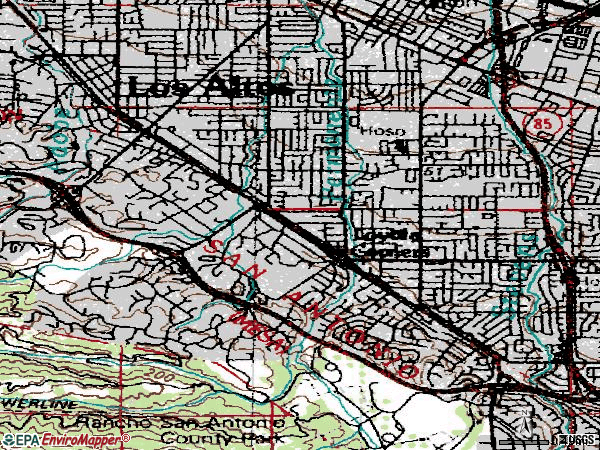
Notable locations in this zip code not listed on our city pages
Notable locations in zip code 94024: Los Altos Country Club (A), Santa Clara County Fire Department Loyola Fire Station (B), Los Altos-Woodland Branch Santa Clara County Free Library (C), Los Altos School District Office (D). Display/hide their locations on the map
Shopping Centers: Rancho Shopping Center (1), Woodland Plaza Shopping Center (2), Los Altos Rancho Shopping Center (3). Display/hide their locations on the map
Churches in zip code 94024 include: Saint Simons Catholic Church (A), Los Altos United Methodist Church (B), Los Altos Union Presbyterian Church (C), Foothill Baptist Church (D), Christ Episcopal Church (E). Display/hide their locations on the map
Parks in zip code 94024 include: Covington Mini Park (1), Grant Park (2), Heritage Oaks Park (3), Marymeade Park (4), McKenzie Park (5), Montclaire Park (6). Display/hide their locations on the map
In group quarters: 239 (-1 institutionalized population)
Size of family households: 2,847 2-persons, 1,580 3-persons, 1,803 4-persons, 631 5-persons, 81 6-persons, 86 7-or-more-persons
Size of nonfamily households: 1,087 1-person, 83 2-persons
5,011 married couples with children.
436 single-parent households (133 men, 303 women).
66.1% of residents of 94024 zip code speak English at home.
2.5% of residents speak Spanish at home (71% very well, 25% well, 3% not well, 1% not at all).
12.8% of residents speak other Indo-European language at home (91% very well, 7% well, 1% not well, 2% not at all).
17.2% of residents speak Asian or Pacific Island language at home (73% very well, 20% well, 4% not well, 3% not at all).
2.2% of residents speak other language at home (91% very well, 7% well, 2% not well).
Foreign born population: 7,897 (33.1%) (75.2% of them are naturalized citizens)
This zip code:
33.1%
Whole state:
26.7%
21%Bhutan
8%Hong Kong
6%Japan
6%India
4%China, excluding Hong Kong and Taiwan
3%Iraq
3%France
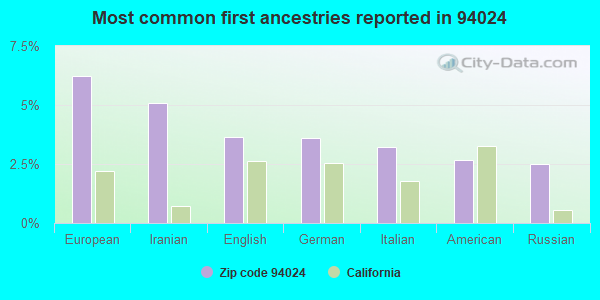
6%European
5%Iranian
4%English
4%German
3%Italian
3%American
3%Russian
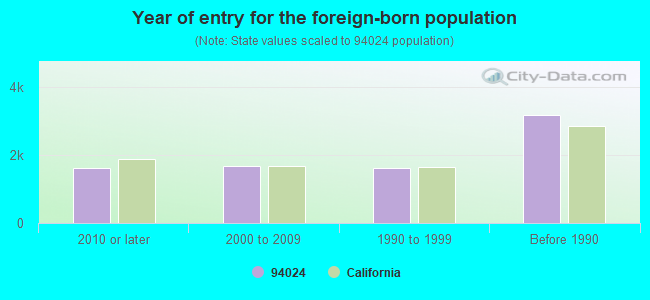
Year of entry for the foreign-born population
1,6032010 or later
1,6722000 to 2009
1,6111990 to 1999
3,172Before 1990
Facilities with environmental interests located in this zip code:
CHEVRON STATION 90288 (2300 HOMESTEAD RD in LOS ALTOS, CA)
STATE MASTER (California - Hazardous Waste Tracking) - HAZARDOU WASTE PROGRAM Small Quantity Generators, between 100 kg and 1000 kg of hazardous waste/month (Resource Conservation and Recovery Act (tracking hazardous waste)) - notification Organizations: CHEVRON PRODUCTS CO (CONTACT/OWNER)
LOYOLA ELEMENTARY (770 BERRY AVE. in LOS ALTOS, CA)
(National Center for Education Statistics) - STATE ID-6047450 Organizations: LOS ALTOS ELEMENTARY (SCHOOL DISTRICT)
MONTCLAIRE ELEMENTARY (1160 ST. JOSEPH AVE. in LOS ALTOS, CA)
(National Center for Education Statistics) - STATE ID-6046981 Organizations: CUPERTINO UNION SCHOOL (SCHOOL DISTRICT)
LOS ALTOS CHRISTIAN SCHOOL (625 MAGDALENA AVE in LOS ALTOS, CA)
COMPLIANCE ACTIVITY (Tracking inspections of insecticide, fungicide, and rodenticide, and toxic substances)
Housing units lacking complete plumbing facilities: 0.3% Housing units lacking complete kitchen facilities: 0.5%
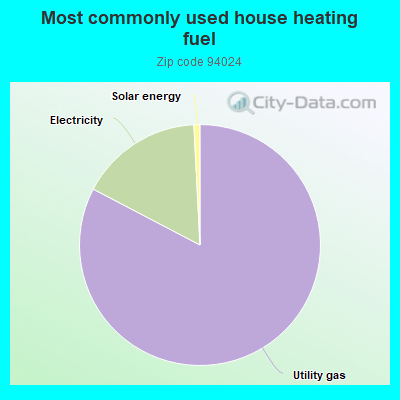
82.1%Utility gas
16.4%Electricity
0.8%Solar energy
Population in 1990: 20,795. Population change in the 1990s: +684 (+3.3%).
Place of birth for U.S.-born residents:
This state: 10,350
Northeast: 1,592
Midwest: 1,762
South: 1,020
West: 932
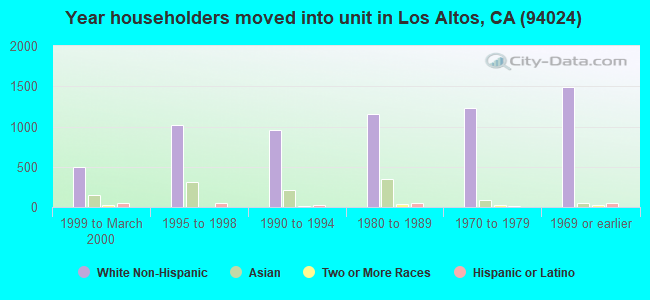
72% of the 94024 zip code residents lived in the same house 5 years ago. Out of people who lived in different houses, 63% lived in this county. Out of people who lived in different counties, 50% lived in California.
92% of the 94024 zip code residents lived in the same house 1 year ago. Out of people who lived in different houses, 68% moved from this county. Out of people who lived in different houses, 11% moved from different county within same state. Out of people who lived in different houses, 12% moved from different state. Out of people who lived in different houses, 10% moved from abroad.
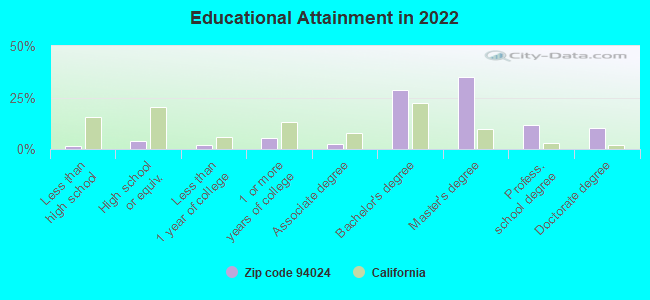
Private vs. public school enrollment:
Students in private schools in grades 1 to 8 (elementary and middle school): 656
Here:
22.7%
California:
10.5%
Students in private schools in grades 9 to 12 (high school): 395
Here:
24.0%
California:
8.5%
Students in private undergraduate colleges: 255
Here:
19.7%
California:
15.9%
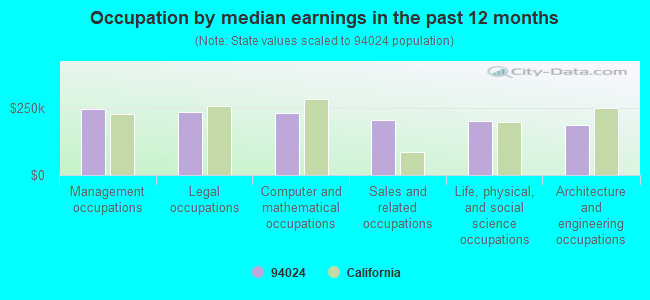
Occupation by median earnings in the past 12 months ($)
248,553Management occupations
234,915Legal occupations
232,124Computer and mathematical occupations
205,880Sales and related occupations
202,772Life, physical, and social science occupations
188,514Architecture and engineering occupations
Companies with federal contracts located in this zip code:
ZAXEL SYSTEMS, INC (11666 DAWSON DRIVE in LOS ALTOS HILL, CA; small business) : $1,148,461 in 5 contractsfrom 1999 to 2002
Contracts for Other Defense -- Applied Research and Exploratory Development (R&D) by Army Signed by year:2000: $375,000; 2001: $575,000; 2002: $100,000; 2003: $0; 2004: $0; 2005: $0; 2006: $0.
Biggest contracts:
$375,000 with Army for Other Defense -- Applied Research and Exploratory Development (R&D). Signed on 2001-03-08. Completion date: 2002-11-29.
$375,000, same as above.Signed on 2000-08-24. Completion date: 2002-11-29.
$200,000, same as above.Signed on 2001-10-11. Completion date: 2002-11-29.
$100,000, same as above.Signed on 2002-01-07. Completion date: 2002-11-29.
SUHIR, EPHRAIM (727 ALVINA CT in LOS ALTOS, CA; small business) : $357,000 in 2 contractsfrom 2002 to 2003
$287,000 with Navy for Other Defense -- Engineering Development (R&D). Signed on 2002-09-27. Completion date: 2003-11-01.
$70,000 with Navy for Engineering -- Basic Research (R&D). Signed on 2003-05-22. Completion date: 2003-11-21.
PROOFPOINT SYSTEMS, INC (1393 OAK AVE in LOS ALTOS, CA; small business) : $163,359 in 2 contractsin 2005
$145,344 with Navy for Miscellaneous Items. Signed on 2005-03-11. Completion date: 2005-09-30.
$18,015 with Army for ADP Support Equipment. Signed on 2005-08-09. Completion date: 2006-07-31.
ALTERNATIVE VISION CORPORATION (1274 THURSTON AVE in LOS ALTOS, CA; small business) : $60,400 in 2 contractsfrom 2003 to 2004
$56,500 with Army for Photographic Sets, Kits, and Outfits. Signed on 2003-06-18. Completion date: 2003-07-29.
$3,900 with Navy for Video Recording and Reproducing Equipment. Signed on 2004-06-24. Completion date: 2004-07-26.
SERVICE SUPPORT SYSTEMS (1365 MONTCLAIRE WAY in LOS ALTOS, CA; small business) : $20,460 in 2 contractsfrom 2004 to 2006
$11,160 with Navy for Combination and Miscellaneous Instruments. Signed on 2006-04-28. Completion date: 2006-07-27.
$9,300, same as above.Signed on 2004-12-15. Completion date: 2005-12-30.
ROOFTOP COMMUNICATIONS CORPORA (468 PACO DRIVE in LOS ALTOS, CA; small business) : -$62,675 in 2 contractsfrom 2003 to 2004
-$20,174 with Army for Other Defense -- Applied Research and Exploratory Development (R&D). Signed on 2003-08-13. Completion date: 1999-03-19.
-$42,501, same as above.Signed on 2004-08-19. Completion date: 1999-03-19.
Top industries in this zip code by the number of employees in 2005:
Other Services (except Public Administration): Religious Organizations (50-99 employees: 2 establishments, 5-9 employees: 2 establishments, 1-4 employees: 7 establishments)
Arts, Entertainment, and Recreation: Golf Courses and Country Clubs (100-249: 1)
Health Care and Social Assistance: Nursing Care Facilities (100-249: 1)
Health Care and Social Assistance: Offices of Dentists (20-49: 1, 10-19: 2, 5-9: 7, 1-4: 11)
Health Care and Social Assistance: Child Day Care Services (20-49: 2, 10-19: 2, 5-9: 4, 1-4: 3)
Health Care and Social Assistance: Offices of Physicians (except Mental Health Specialists) (20-49: 1, 10-19: 1, 5-9: 3, 1-4: 27)
Construction: New Single-Family Housing Construction (except Operative Builders) (50-99: 1, 10-19: 1, 5-9: 2, 1-4: 9)
Accommodation and Food Services: Food Service Contractors (50-99: 1, 10-19: 1)
Educational Services: Elementary and Secondary Schools (50-99: 1)
People in group quarters in 2010:
142 people in nursing facilities/skilled-nursing facilities
41 people in other noninstitutional facilities
8 people in workers' group living quarters and job corps centers
People in group quarters in 2000:
139 people in nursing homes
6 people in religious group quarters
4 people in other nonhousehold living situations
Fatal accident statistics in 2014:
Fatal accident count: 1
Vehicles involved in fatal accidents: 1
Fatal accidents caused by drunken drivers: 1
Fatalities: 1
Persons involved in fatal accidents: 2
Pedestrians involved in fatal accidents: 0
Fatal accident statistics in 2011:
Fatal accident count: 2
Vehicles involved in fatal accidents: 6
Fatal accidents caused by drunken drivers: 0
Fatalities: 2
Persons involved in fatal accidents: 6
Pedestrians involved in fatal accidents: 0
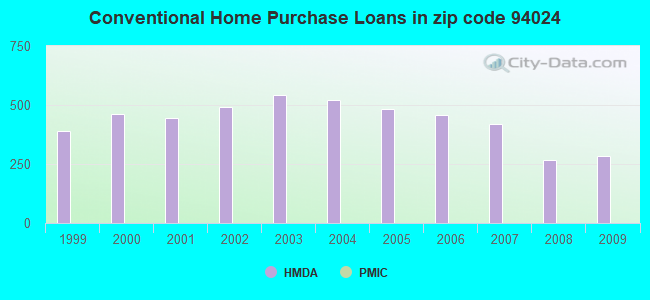
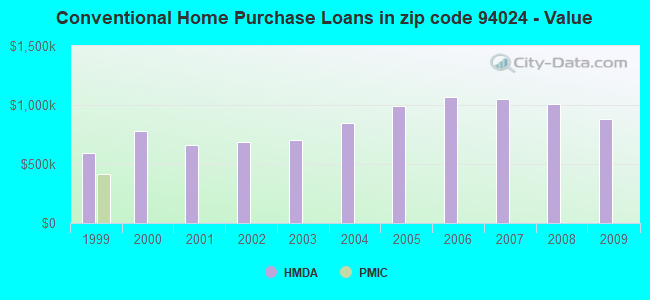
Home Mortgage Disclosure Act Aggregated Statistics For Year 2009 (Based on 7 full and 4 partial tracts)
A) FHA, FSA/RHS & VA Home Purchase Loans
B) Conventional Home Purchase Loans
C) Refinancings
D) Home Improvement Loans
F) Non-occupant Loans on < 5 Family Dwellings (A B C & D)
Number
Average Value
Number
Average Value
Number
Average Value
Number
Average Value
Number
Average Value
LOANS ORIGINATED
2
$857,735
286
$878,567
2,348
$542,895
99
$420,331
44
$510,472
APPLICATIONS APPROVED, NOT ACCEPTED
0
$0
20
$843,541
248
$567,645
10
$399,911
10
$403,680
APPLICATIONS DENIED
0
$0
35
$975,770
377
$784,141
11
$483,862
12
$458,315
APPLICATIONS WITHDRAWN
0
$0
26
$738,066
263
$621,902
17
$515,059
2
$418,460
FILES CLOSED FOR INCOMPLETENESS
0
$0
3
$331,927
55
$534,773
8
$454,858
4
$199,868
Aggregated Statistics For Year 2008 (Based on 7 full and 4 partial tracts)
B) Conventional Home Purchase Loans
C) Refinancings
D) Home Improvement Loans
F) Non-occupant Loans on < 5 Family Dwellings (A B C & D)
Number
Average Value
Number
Average Value
Number
Average Value
Number
Average Value
LOANS ORIGINATED
267
$1,006,897
807
$693,281
30
$643,404
29
$572,041
APPLICATIONS APPROVED, NOT ACCEPTED
55
$1,045,916
165
$676,490
4
$449,665
4
$295,568
APPLICATIONS DENIED
79
$1,057,103
164
$834,796
22
$827,478
4
$770,625
APPLICATIONS WITHDRAWN
49
$1,050,350
128
$731,859
17
$456,354
2
$538,030
FILES CLOSED FOR INCOMPLETENESS
16
$1,236,448
26
$697,420
8
$220,662
2
$795,565
Aggregated Statistics For Year 2007 (Based on 7 full and 4 partial tracts)
B) Conventional Home Purchase Loans
C) Refinancings
D) Home Improvement Loans
F) Non-occupant Loans on < 5 Family Dwellings (A B C & D)
Number
Average Value
Number
Average Value
Number
Average Value
Number
Average Value
LOANS ORIGINATED
418
$1,048,927
836
$841,582
64
$556,509
51
$574,960
APPLICATIONS APPROVED, NOT ACCEPTED
76
$1,042,345
179
$821,915
23
$884,297
12
$632,970
APPLICATIONS DENIED
65
$1,087,218
173
$1,057,206
21
$802,514
15
$571,482
APPLICATIONS WITHDRAWN
38
$989,311
92
$928,057
15
$584,907
18
$635,314
FILES CLOSED FOR INCOMPLETENESS
2
$1,009,705
32
$1,066,400
5
$223,002
0
$0
Aggregated Statistics For Year 2006 (Based on 7 full and 4 partial tracts)
B) Conventional Home Purchase Loans
C) Refinancings
D) Home Improvement Loans
F) Non-occupant Loans on < 5 Family Dwellings (A B C & D)
Number
Average Value
Number
Average Value
Number
Average Value
Number
Average Value
LOANS ORIGINATED
457
$1,063,600
786
$807,423
73
$569,987
63
$733,963
APPLICATIONS APPROVED, NOT ACCEPTED
87
$901,617
109
$723,730
10
$1,098,288
14
$898,856
APPLICATIONS DENIED
77
$1,113,312
177
$975,110
15
$880,099
11
$682,658
APPLICATIONS WITHDRAWN
37
$923,493
102
$664,083
6
$220,202
7
$689,596
FILES CLOSED FOR INCOMPLETENESS
7
$842,633
15
$1,035,999
2
$178,595
0
$0
Aggregated Statistics For Year 2005 (Based on 7 full and 4 partial tracts)
B) Conventional Home Purchase Loans
C) Refinancings
D) Home Improvement Loans
E) Loans on Dwellings For 5+ Families
F) Non-occupant Loans on < 5 Family Dwellings (A B C & D)
G) Loans On Manufactured Home Dwelling (A B C & D)
Number
Average Value
Number
Average Value
Number
Average Value
Number
Average Value
Number
Average Value
Number
Average Value
LOANS ORIGINATED
485
$988,138
1,041
$748,632
101
$654,860
2
$2,264,920
60
$605,097
0
$0
APPLICATIONS APPROVED, NOT ACCEPTED
76
$867,912
139
$790,285
15
$633,818
0
$0
7
$490,730
2
$73,060
APPLICATIONS DENIED
98
$979,244
179
$781,095
24
$325,398
0
$0
16
$817,948
0
$0
APPLICATIONS WITHDRAWN
60
$1,071,990
157
$702,514
20
$535,502
0
$0
11
$786,075
0
$0
FILES CLOSED FOR INCOMPLETENESS
7
$1,472,391
41
$683,699
9
$791,399
0
$0
2
$127,915
0
$0
Aggregated Statistics For Year 2004 (Based on 7 full and 4 partial tracts)
B) Conventional Home Purchase Loans
C) Refinancings
D) Home Improvement Loans
F) Non-occupant Loans on < 5 Family Dwellings (A B C & D)
Number
Average Value
Number
Average Value
Number
Average Value
Number
Average Value
LOANS ORIGINATED
523
$850,571
2,067
$612,321
66
$641,494
57
$559,634
APPLICATIONS APPROVED, NOT ACCEPTED
72
$867,540
304
$613,887
5
$723,112
16
$631,196
APPLICATIONS DENIED
75
$938,920
234
$702,931
14
$394,892
16
$691,931
APPLICATIONS WITHDRAWN
48
$865,453
203
$608,304
12
$430,803
8
$724,215
FILES CLOSED FOR INCOMPLETENESS
6
$898,260
28
$533,331
2
$644,540
0
$0
Aggregated Statistics For Year 2003 (Based on 7 full and 4 partial tracts)
A) FHA, FSA/RHS & VA Home Purchase Loans
B) Conventional Home Purchase Loans
C) Refinancings
D) Home Improvement Loans
F) Non-occupant Loans on < 5 Family Dwellings (A B C & D)
Number
Average Value
Number
Average Value
Number
Average Value
Number
Average Value
Number
Average Value
LOANS ORIGINATED
0
$0
542
$706,289
5,117
$516,066
11
$378,996
117
$373,858
APPLICATIONS APPROVED, NOT ACCEPTED
2
$148,365
73
$669,031
773
$567,725
10
$69,886
17
$337,916
APPLICATIONS DENIED
0
$0
75
$706,683
442
$628,546
11
$137,235
15
$592,759
APPLICATIONS WITHDRAWN
0
$0
58
$728,259
448
$517,913
0
$0
11
$271,458
FILES CLOSED FOR INCOMPLETENESS
0
$0
13
$522,550
177
$552,717
5
$145,816
9
$412,163
Aggregated Statistics For Year 2002 (Based on 7 full and 4 partial tracts)
B) Conventional Home Purchase Loans
C) Refinancings
D) Home Improvement Loans
F) Non-occupant Loans on < 5 Family Dwellings (A B C & D)
Number
Average Value
Number
Average Value
Number
Average Value
Number
Average Value
LOANS ORIGINATED
492
$683,094
4,589
$534,292
22
$163,064
82
$378,942
APPLICATIONS APPROVED, NOT ACCEPTED
54
$767,967
648
$554,339
8
$240,192
14
$471,537
APPLICATIONS DENIED
35
$693,258
349
$613,076
11
$110,398
12
$822,477
APPLICATIONS WITHDRAWN
42
$733,825
349
$489,307
4
$53,008
8
$182,518
FILES CLOSED FOR INCOMPLETENESS
11
$633,581
146
$617,217
2
$97,545
5
$316,466
Aggregated Statistics For Year 2001 (Based on 7 full and 4 partial tracts)
B) Conventional Home Purchase Loans
C) Refinancings
D) Home Improvement Loans
E) Loans on Dwellings For 5+ Families
F) Non-occupant Loans on < 5 Family Dwellings (A B C & D)
Number
Average Value
Number
Average Value
Number
Average Value
Number
Average Value
Number
Average Value
LOANS ORIGINATED
443
$662,604
2,340
$553,862
74
$135,838
2
$2,211,000
58
$451,349
APPLICATIONS APPROVED, NOT ACCEPTED
79
$648,383
306
$574,850
9
$137,341
0
$0
13
$523,170
APPLICATIONS DENIED
41
$762,070
253
$631,311
19
$72,061
0
$0
13
$498,087
APPLICATIONS WITHDRAWN
35
$729,841
209
$538,228
9
$162,482
0
$0
8
$860,966
FILES CLOSED FOR INCOMPLETENESS
13
$570,232
98
$565,231
2
$198,785
0
$0
2
$431,345
Aggregated Statistics For Year 2000 (Based on 7 full and 4 partial tracts)
B) Conventional Home Purchase Loans
C) Refinancings
D) Home Improvement Loans
E) Loans on Dwellings For 5+ Families
F) Non-occupant Loans on < 5 Family Dwellings (A B C & D)
Number
Average Value
Number
Average Value
Number
Average Value
Number
Average Value
Number
Average Value
LOANS ORIGINATED
461
$775,450
469
$522,139
84
$117,161
2
$770,000
31
$571,222
APPLICATIONS APPROVED, NOT ACCEPTED
71
$678,759
68
$488,917
21
$108,378
0
$0
8
$419,200
APPLICATIONS DENIED
70
$910,777
61
$564,604
17
$141,939
0
$0
17
$421,950
APPLICATIONS WITHDRAWN
42
$784,142
56
$222,652
13
$222,363
0
$0
2
$243,540
FILES CLOSED FOR INCOMPLETENESS
17
$723,091
38
$501,463
7
$332,177
0
$0
4
$879,685
Aggregated Statistics For Year 1999 (Based on 2 full and 5 partial tracts)
B) Conventional Home Purchase Loans
C) Refinancings
D) Home Improvement Loans
F) Non-occupant Loans on < 5 Family Dwellings (A B C & D)
2005 - 2018 National Fire Incident Reporting System (NFIRS) incidents
According to the data from the years 2005 - 2018 the average number of fires per year is 17. The highest number of reported fire incidents - 23 took place in 2011, and the least - 8 in 2012. The data has a decreasing trend.
When looking into fire subcategories, the most incidents belonged to: Outside Fires (40.0%), and Structure Fires (37.9%).
Fire incident types reported to NFIRS in Zip Code 94024


 Nearest zip codes: 94040, 94041, 95014, 94022, 94087, 94306.


 According to the data from the years 2005 - 2018 the average number of fires per year is 17. The highest number of reported fire incidents - 23 took place in 2011, and the least - 8 in 2012. The data has a decreasing trend.
 When looking into fire subcategories, the most incidents belonged to: Outside Fires (40.0%), and Structure Fires (37.9%).