Estimated zip code population in 2022: 20,103 Zip code population in 2010: 20,571 Zip code population in 2000: 19,802
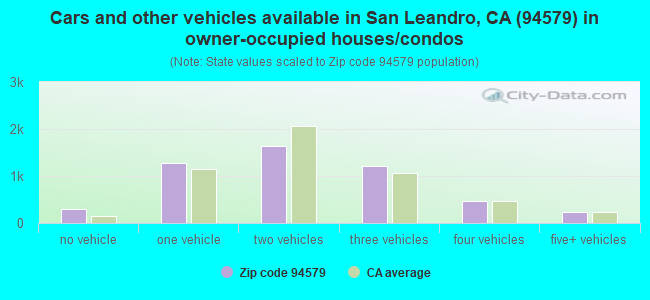
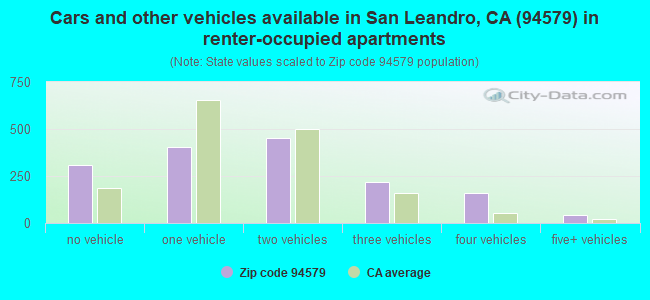
Houses and condos: 6,922 Renter-occupied apartments: 1,591
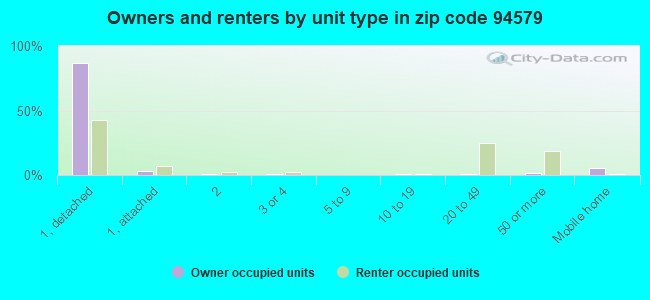
% of renters here:
24%
State:
44%
March 2022 cost of living index in zip code 94579: 119.5 (more than average, U.S. average is 100)
Land area: 3.1 sq. mi. Water area: 0.0 sq. mi.
Population density: 6,417 people per square mile
(high).
OSM Map
General Map
Google Map
MSN Map
OSM Map
General Map
Google Map
MSN Map
OSM Map
General Map
Google Map
MSN Map
OSM Map
General Map
Google Map
MSN Map
Please wait while loading the map...
Real estate property taxes paid for housing units in 2022:
This zip code:
0.7% ($5,556)
California:
0.7% ($4,831)
Median real estate property taxes paid for housing units with mortgages in 2022: $6,426 (0.7%) Median real estate property taxes paid for housing units with no mortgage in 2022: $3,153 (0.4%)
Estimated median house/condo value in 2022: $847,071
94579:
$847,071
California:
$715,900
According to our research of California and other state lists, there were 13 registered sex offenders living in 94579 zip code as of April 26, 2024. The ratio of all residents to sex offenders in zip code 94579 is 1,750 to 1. The ratio of registered sex offenders to all residents in this zip code is lower than the state average.
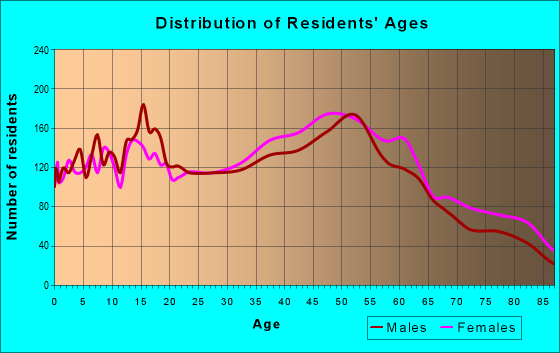
Median resident age:
This zip code:
47.0 years
California median age:
37.9 years
Average household size:
This zip code:
3.0 people
California:
2.8 people
Averages for the 2020 tax year for zip code 94579, filed in 2021:
Average Adjusted Gross Income (AGI) in 2020: $69,735 (Individual Income Tax Returns)
Here:
$69,735
State:
$95,910
Salary/wage: $64,315 (reported on 81.5% of returns)
Here:
$64,315
State:
$77,331
(% of AGI for various income ranges: 1191.0% for AGIs below $25k, 3935.1% for AGIs $25k-50k, 7684.9% for AGIs $50k-75k, 11322.1% for AGIs $75k-100k, 21536.0% for AGIs $100k-200k, 81857.3% for AGIs over 200k)
Taxable interest for individuals: $1,074 (reported on 37.4% of returns)
This zip code:
$1,074
California:
$2,294
(% of AGI for various income ranges: 21.7% for AGIs below $25k, 27.4% for AGIs $25k-50k, 51.5% for AGIs $50k-75k, 75.1% for AGIs $75k-100k, 140.1% for AGIs $100k-200k, 774.7% for AGIs over 200k)
Ordinary dividends: $2,864 (reported on 19.3% of returns)
Here:
$2,864
State:
$10,949
(% of AGI for various income ranges: 21.3% for AGIs below $25k, 24.5% for AGIs $25k-50k, 66.2% for AGIs $50k-75k, 90.4% for AGIs $75k-100k, 233.3% for AGIs $100k-200k, 1184.0% for AGIs over 200k)
Net capital gain/loss in AGI: +$10,494 (reported on 19.3% of returns)
Here:
+$10,494
State:
+$49,306
(% of AGI for various income ranges: 8.8% for AGIs below $25k, 31.0% for AGIs $25k-50k, 98.1% for AGIs $50k-75k, 179.9% for AGIs $75k-100k, 581.1% for AGIs $100k-200k, 9534.7% for AGIs over 200k)
Profit/loss from business: +$11,834 (reported on 15.8% of returns)
Here:
+$11,834
State:
+$15,671
(% of AGI for various income ranges: 183.4% for AGIs below $25k, 220.6% for AGIs $25k-50k, 207.4% for AGIs $50k-75k, 259.5% for AGIs $75k-100k, 496.7% for AGIs $100k-200k, 3158.7% for AGIs over 200k)
Taxable individual retirement arrangement distribution: $14,981 (reported on 6.4% of returns)
94579:
$14,981
California:
$23,505
(% of AGI for various income ranges: 57.0% for AGIs below $25k, 56.0% for AGIs $25k-50k, 140.2% for AGIs $50k-75k, 224.0% for AGIs $75k-100k, 471.0% for AGIs $100k-200k, 706.7% for AGIs over 200k)
Self-employed (Keogh) retirement plans: $14,175 (reported on 0.3% of returns)
94579:
$14,175
California:
$30,163
(% of AGI for various income ranges: 58.5% for AGIs $100k-200k)
Total itemized deductions: $29,437 (reported on 14.3% of returns)
Here:
$29,437
State:
$39,517
(% of AGI for various income ranges: 130.8% for AGIs below $25k, 280.1% for AGIs $25k-50k, 508.2% for AGIs $50k-75k, 903.1% for AGIs $75k-100k, 1975.3% for AGIs $100k-200k, 5826.0% for AGIs over 200k)
Charity contributions: $5,013 (reported on 10.6% of returns)
Here:
$5,013
State:
$12,598
(% of AGI for various income ranges: 3.2% for AGIs below $25k, 17.1% for AGIs $25k-50k, 48.3% for AGIs $50k-75k, 94.4% for AGIs $75k-100k, 262.6% for AGIs $100k-200k, 1274.7% for AGIs over 200k)
Taxes paid: $8,878 (reported on 14.3% of returns)
94579:
$8,878
State:
$8,807
(% of AGI for various income ranges: 29.7% for AGIs below $25k, 78.9% for AGIs $25k-50k, 150.8% for AGIs $50k-75k, 320.1% for AGIs $75k-100k, 619.4% for AGIs $100k-200k, 1574.7% for AGIs over 200k)
Earned income credit: $1,953 (reported on 12.1% of returns)
Here:
$1,953
State:
$2,074
(% of AGI for various income ranges: 81.7% for AGIs below $25k, 65.2% for AGIs $25k-50k)
Percentage of individuals using paid preparers for their 2020 taxes: 89.5%
Here:
90%
State:
92%
(% for various income ranges: 86.8% for AGIs below $25k, 89.9% for AGIs $25k-50k, 90.6% for AGIs $50k-75k, 90.5% for AGIs $75k-100k, 91.1% for AGIs $100k-200k, 92.7% for AGIs over 200k)
Averages for the 2012 tax year for zip code 94579, filed in 2013:
Average Adjusted Gross Income (AGI) in 2012: $53,383 (Individual Income Tax Returns)
Here:
$53,383
State:
$72,726
Salary/wage: $51,401 (reported on 81.9% of returns)
Here:
$51,401
State:
$59,079
(% of AGI for various income ranges: 69.0% for AGIs below $25k, 77.7% for AGIs $25k-50k, 79.1% for AGIs $50k-75k, 79.6% for AGIs $75k-100k, 83.3% for AGIs $100k-200k, 72.6% for AGIs over 200k)
Taxable interest for individuals: $822 (reported on 39.2% of returns)
This zip code:
$822
California:
$2,146
(% of AGI for various income ranges: 1.2% for AGIs below $25k, 0.7% for AGIs $25k-50k, 0.6% for AGIs $50k-75k, 0.5% for AGIs $75k-100k, 0.5% for AGIs $100k-200k, 0.5% for AGIs over 200k)
Ordinary dividends: $3,106 (reported on 17.2% of returns)
Here:
$3,106
State:
$9,308
(% of AGI for various income ranges: 1.5% for AGIs below $25k, 0.7% for AGIs $25k-50k, 1.0% for AGIs $50k-75k, 1.1% for AGIs $75k-100k, 1.0% for AGIs $100k-200k, 1.0% for AGIs over 200k)
Net capital gain/loss in AGI: +$2,470 (reported on 14.2% of returns)
Here:
+$2,470
State:
+$30,460
(% of AGI for various income ranges: 0.8% for AGIs $100k-200k, 5.1% for AGIs over 200k)
Profit/loss from business: +$13,458 (reported on 14.6% of returns)
Here:
+$13,458
State:
+$17,064
(% of AGI for various income ranges: 10.6% for AGIs below $25k, 5.3% for AGIs $25k-50k, 2.7% for AGIs $50k-75k, 1.7% for AGIs $75k-100k, 2.3% for AGIs $100k-200k, 4.8% for AGIs over 200k)
Taxable individual retirement arrangement distribution: $12,504 (reported on 8.3% of returns)
94579:
$12,504
California:
$19,557
(% of AGI for various income ranges: 3.2% for AGIs below $25k, 1.9% for AGIs $25k-50k, 2.0% for AGIs $50k-75k, 1.8% for AGIs $75k-100k, 1.6% for AGIs $100k-200k, 2.3% for AGIs over 200k)
Self-employment retirement plans: $17,667 (reported on 0.3% of returns)
94579:
$17,667
California:
$24,530
Total itemized deductions: $23,566 (26% of AGI, reported on 35.1% of returns)
Here:
$23,566
State:
$34,004
Here:
25.9% of AGI
State:
22.7% of AGI
(% of AGI for various income ranges: 11.6% for AGIs below $25k, 11.3% for AGIs $25k-50k, 14.2% for AGIs $50k-75k, 16.9% for AGIs $75k-100k, 18.6% for AGIs $100k-200k, 16.5% for AGIs over 200k)
Charity contributions: $2,525 (reported on 27.4% of returns)
Here:
$2,525
State:
$4,659
(% of AGI for various income ranges: 0.5% for AGIs below $25k, 0.7% for AGIs $25k-50k, 1.3% for AGIs $50k-75k, 1.4% for AGIs $75k-100k, 1.8% for AGIs $100k-200k, 1.4% for AGIs over 200k)
Taxes paid: $8,468 (reported on 34.9% of returns)
94579:
$8,468
State:
$14,448
(% of AGI for various income ranges: 2.5% for AGIs below $25k, 3.0% for AGIs $25k-50k, 4.3% for AGIs $50k-75k, 5.8% for AGIs $75k-100k, 7.5% for AGIs $100k-200k, 8.8% for AGIs over 200k)
Earned income credit: $1,990 (reported on 16.1% of returns)
Here:
$1,990
State:
$2,286
(% of AGI for various income ranges: 5.4% for AGIs below $25k, 1.0% for AGIs $25k-50k)
Percentage of individuals using paid preparers for their 2012 taxes: 58.2%
Here:
58%
State:
64%
(% for various income ranges: 53.9% for AGIs below $25k, 59.7% for AGIs $25k-50k, 60.9% for AGIs $50k-75k, 60.6% for AGIs $75k-100k, 59.7% for AGIs $100k-200k, 68.4% for AGIs over 200k)
Averages for the 2004 tax year for zip code 94579, filed in 2005:
Average Adjusted Gross Income (AGI) in 2004: $48,307 (Individual Income Tax Returns)
Here:
$48,307
State:
$58,600
Salary/wage: $46,683 (reported on 81.4% of returns)
Here:
$46,683
State:
$49,455
(% of AGI for various income ranges: 102.3% for AGIs below $10k, 66.2% for AGIs $10k-25k, 77.8% for AGIs $25k-50k, 80.7% for AGIs $50k-75k, 85.5% for AGIs $75k-100k, 76.0% for AGIs over 100k)
Taxable interest for individuals: $1,218 (reported on 54.4% of returns)
This zip code:
$1,218
California:
$2,365
(% of AGI for various income ranges: 6.3% for AGIs below $10k, 2.8% for AGIs $10k-25k, 1.6% for AGIs $25k-50k, 1.3% for AGIs $50k-75k, 1.3% for AGIs $75k-100k, 0.8% for AGIs over 100k)
Taxable dividends: $1,648 (reported on 24.1% of returns)
Here:
$1,648
State:
$4,746
(% of AGI for various income ranges: 3.3% for AGIs below $10k, 1.5% for AGIs $10k-25k, 1.0% for AGIs $25k-50k, 0.8% for AGIs $50k-75k, 0.7% for AGIs $75k-100k, 0.5% for AGIs over 100k)
Net capital gain/loss: +$5,109 (reported on 20.5% of returns)
Here:
+$5,109
State:
+$23,418
(% of AGI for various income ranges: -2.2% for AGIs below $10k, -0.2% for AGIs $10k-25k, -0.0% for AGIs $25k-50k, 0.5% for AGIs $50k-75k, 0.6% for AGIs $75k-100k, 6.4% for AGIs over 100k)
Profit/loss from business: +$13,530 (reported on 13.2% of returns)
Here:
+$13,530
State:
+$16,826
(% of AGI for various income ranges: 6.6% for AGIs below $10k, 7.3% for AGIs $10k-25k, 4.7% for AGIs $25k-50k, 3.3% for AGIs $50k-75k, 2.3% for AGIs $75k-100k, 3.1% for AGIs over 100k)
IRA payment deduction: $3,456 (reported on 3.6% of returns)
94579:
$3,456
California:
$3,192
(% of AGI for various income ranges: 0.4% for AGIs $10k-25k, 0.5% for AGIs $25k-50k, 0.3% for AGIs $50k-75k, 0.2% for AGIs $75k-100k, 0.1% for AGIs over 100k)
Self-employed pension: $10,562 (reported on 0.7% of returns)
Here:
$10,562
California:
$17,688
(% of AGI for various income ranges: 0.1% for AGIs $25k-50k, 0.1% for AGIs $50k-75k, 0.2% for AGIs $75k-100k, 0.3% for AGIs over 100k)
Total itemized deductions: $23,026 (29% of AGI, reported on 39.7% of returns)
Here:
$23,026
State:
$28,113
Here:
29.2% of AGI
State:
25.3% of AGI
(% of AGI for various income ranges: 21.0% for AGIs below $10k, 12.7% for AGIs $10k-25k, 15.5% for AGIs $25k-50k, 18.9% for AGIs $50k-75k, 21.8% for AGIs $75k-100k, 21.0% for AGIs over 100k)
Charity contributions deductions: $2,333 (3% of AGI, reported on 33.5% of returns)
Here:
$2,333
State:
$3,923
Here:
2.8% of AGI
State:
3.3% of AGI
(% of AGI for various income ranges: 0.5% for AGIs below $10k, 0.7% for AGIs $10k-25k, 1.1% for AGIs $25k-50k, 1.5% for AGIs $50k-75k, 1.9% for AGIs $75k-100k, 2.2% for AGIs over 100k)
Total tax: $6,076 (reported on 79.6% of returns)
94579:
$6,076
State:
$10,761
(% of AGI for various income ranges: 3.5% for AGIs below $10k, 4.3% for AGIs $10k-25k, 7.3% for AGIs $25k-50k, 8.9% for AGIs $50k-75k, 9.4% for AGIs $75k-100k, 14.5% for AGIs over 100k)
Earned income credit: $1,527 (reported on 10.9% of returns)
Here:
$1,527
State:
$1,763
Percentage of individuals using paid preparers for their 2004 taxes: 61.5%
Here:
61%
State:
66%
(% for various income ranges: 55.1% for AGIs below $10k, 62.9% for AGIs $10k-25k, 62.8% for AGIs $25k-50k, 61.9% for AGIs $50k-75k, 62.2% for AGIs $75k-100k, 63.0% for AGIs over 100k)
Likely homosexual households (counted as self-reported same-sex unmarried-partner households)
Lesbian couples: 0.2% of all households
Gay men: 0.3% of all households
Household received Food Stamps/SNAP in the past 12 months: 789 Household did not receive Food Stamps/SNAP in the past 12 months: 5,901
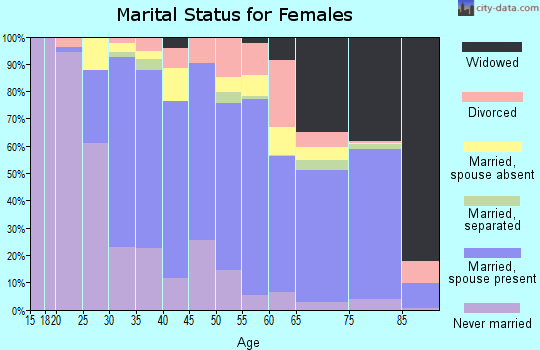
Women who had a birth in the past 12 months: 37 (37 now married, 0 unmarried) Women who did not have a birth in the past 12 months: 4,552 (1,841 now married, 2,709 unmarried)
Housing units in zip code 94579 with a mortgage: 2,995 (307 second mortgage, 15 home equity loan, 234 both second mortgage and home equity loan) Houses without a mortgage: 20
Median monthly owner costs for units with a mortgage: $2,728 Median monthly owner costs for units without a mortgage: $722
Residents with income below the poverty level in 2022:
This zip code:
8.5%
Whole state:
12.2%
Residents with income below 50% of the poverty level in 2022:
This zip code:
5.3%
Whole state:
6.2%
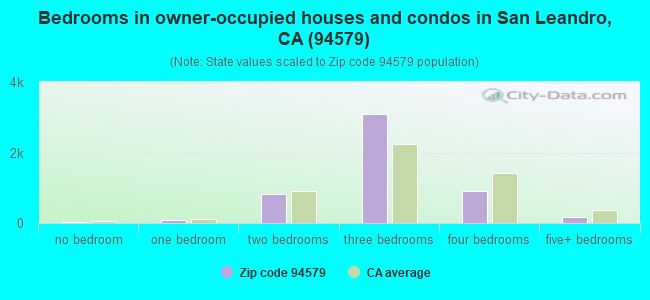
Median number of rooms in houses and condos:
Here:
5.6
State:
6.0
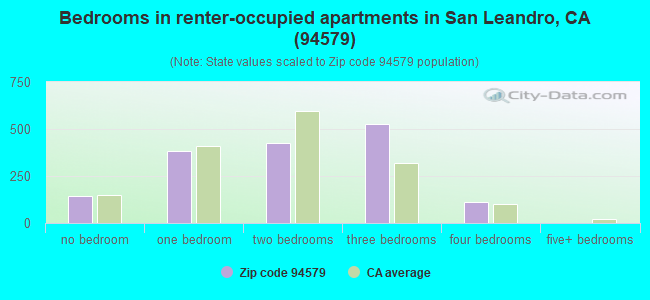
Median number of rooms in apartments:
Here:
4.1
State:
3.9
Notable locations in this zip code not listed on our city pages
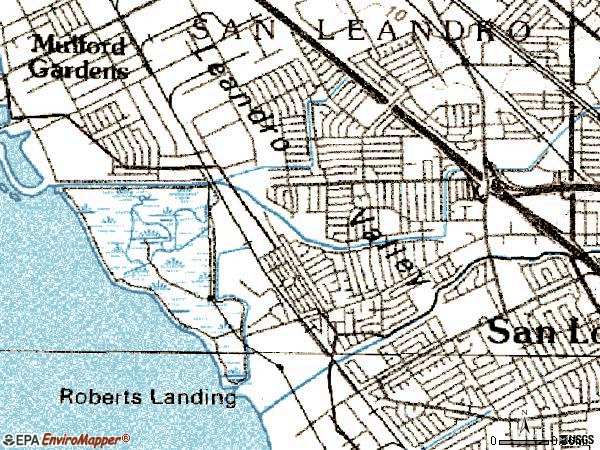
Notable locations in zip code 94579: Roberts Landing (A), Manor Branch San Leandro Community Library (B), Alameda County Fire Department Station 13 (C). Display/hide their locations on the map
Churches in zip code 94579 include: San Lorenzo Japanese Christian Church (A), Lewelling Community Church (B), Saint Felicitas Catholic Church (C), Christ Presbyterian Church (D). Display/hide their locations on the map
Parks in zip code 94579 include: Washington Manor Park (1), Bonaire Park (2), Stenzel Park (3), Dayton Playground (4), Lewelling Playground (5), Madison Playground (6). Display/hide their locations on the map
2,025 married couples with children.
403 single-parent households (207 men, 196 women).
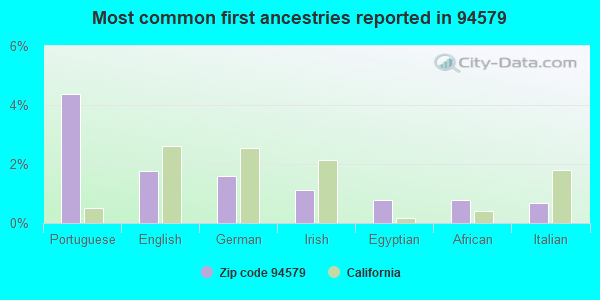
46.1% of residents of 94579 zip code speak English at home.
11.1% of residents speak Spanish at home (63% very well, 21% well, 14% not well, 2% not at all).
1.1% of residents speak other Indo-European language at home (49% very well, 36% well, 6% not well, 9% not at all).
41.3% of residents speak Asian or Pacific Island language at home (38% very well, 27% well, 21% not well, 14% not at all).
0.5% of residents speak other language at home (49% very well, 51% well).
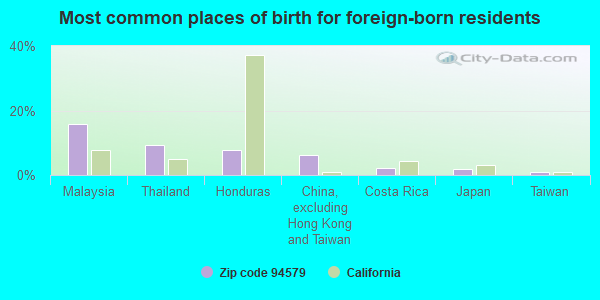
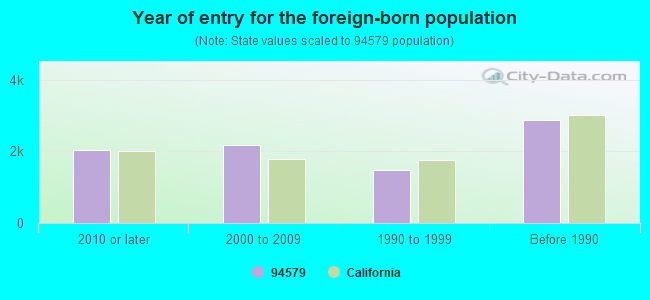
Foreign born population: 8,313 (41.4%) (73.4% of them are naturalized citizens)
Facilities with environmental interests located in this zip code:
MOELLER BROTHERS BODY SHOP INCORPORATED (539 LEWELLING BOULEVARD in SAN LEANDRO, CA)
STATE MASTER (California - Hazardous Waste Tracking) - HAZARDOU WASTE PROGRAM CRITERIA AND HAZARDOUS AIR POLLUTANT INVENTORY (Inventory of air pollution sources) Small Quantity Generators, between 100 kg and 1000 kg of hazardous waste/month (Resource Conservation and Recovery Act (tracking hazardous waste)) - notification Business SIC classification: TOP, BODY, AND UPHOLSTERY REPAIR SHOPS AND PAINT SHOPS Business NAICS classification: AUTOMOTIVE BODY, PAINT, AND INTERIOR REPAIR AND MAINTENANCE. Organizations: QUENTIN BAMMER (CONTACT/OWNER)
LINCOLN HIGH (CONT.) (2600 TEAGARDEN ST. in SAN LEANDRO, CA)
(National Center for Education Statistics) - STATE ID-0134528 Organizations: SAN LEANDRO UNIFIED (SCHOOL DISTRICT)
MADISON (JAMES) ELEMENTARY (14751 JUNIPER ST. in SAN LEANDRO, CA)
(National Center for Education Statistics) - STATE ID-6002414 Organizations: SAN LEANDRO UNIFIED (SCHOOL DISTRICT)
ACME PRINTING INK CO DELAWARE (2785 TEAGARDEN ST in SAN LEANDRO, CA)
(Resource Conservation and Recovery Act (tracking hazardous waste)) Organizations: ACME PRINTING INK CO. OF DELAWARE (CONTACT/OWNER)
ELECTRO ENGINEERING WORKS SAN LEANDRO IN (399 PREDA ST in SAN LEANDRO, CA)
Large Quantity Generators, more that 1000 kg of hazardous waste/month (Resource Conservation and Recovery Act (tracking hazardous waste)) - notification
KEELING TRUCKING (15032 DEWEY ST in SAN LEANDRO, CA)
TRANSPORTER (Resource Conservation and Recovery Act (tracking hazardous waste)) Organizations: NOEL D KEELING (CONTACT/OWNER)
ACME FIXTURE & CASEWORK INC (2527 GRANT STREET in SAN LEANDRO, CA)
CRITERIA AND HAZARDOUS AIR POLLUTANT INVENTORY (Inventory of air pollution sources) Business SIC classification: WOOD OFFICE AND STORE FIXTURES, PARTITIONS, SHELVING, AND LOCKERS
EQUILON ENTERPRISES (15275 WASHINGTON AVENUE in SAN LEANDRO, CA)
CRITERIA AND HAZARDOUS AIR POLLUTANT INVENTORY (Inventory of air pollution sources) Business SIC classification: REFUSE SYSTEMS
FANTASTIC CLEANERS (15225 WASHINGTON AVENUE in SAN LEANDRO, CA)
CRITERIA AND HAZARDOUS AIR POLLUTANT INVENTORY (Inventory of air pollution sources) Business SIC classification: DRYCLEANING PLANTS, EXCEPT RUG CLEANING
GROUP II BODY & PAINT (534 LEWELLING BOULEVARD in SAN LEANDRO, CA)
CRITERIA AND HAZARDOUS AIR POLLUTANT INVENTORY (Inventory of air pollution sources) Business SIC classification: TOP, BODY, AND UPHOLSTERY REPAIR SHOPS AND PAINT SHOPS
MANOR BAPTIST CHRISTIAN ELEM (1845 LEWELLING BLVD in SAN LEANDRO, CA)
COMPLIANCE ACTIVITY (Tracking inspections of insecticide, fungicide, and rodenticide, and toxic substances)
Housing units lacking complete plumbing facilities: 1.0% Housing units lacking complete kitchen facilities: 1.3%
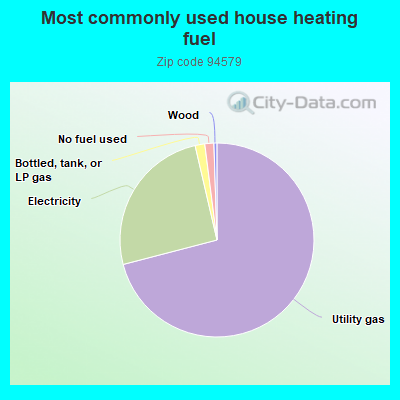
70.6%Utility gas
25.3%Electricity
1.6%Bottled, tank, or LP gas
1.5%No fuel used
0.5%Wood
Population in 1990: 15,754. Population change in the 1990s: +4,048 (+25.7%).
Place of birth for U.S.-born residents:
This state: 10,077
Northeast: 393
Midwest: 355
South: 573
West: 238
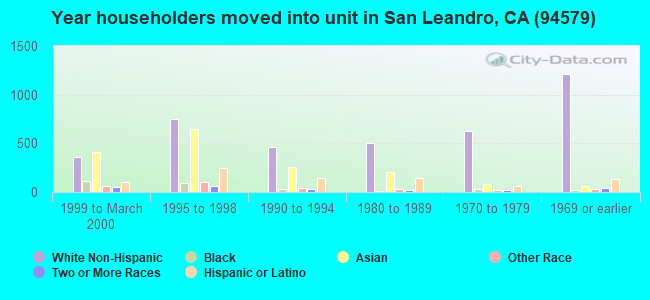
58% of the 94579 zip code residents lived in the same house 5 years ago. Out of people who lived in different houses, 67% lived in this county. Out of people who lived in different counties, 50% lived in California.
94% of the 94579 zip code residents lived in the same house 1 year ago. Out of people who lived in different houses, 72% moved from this county. Out of people who lived in different houses, 18% moved from different county within same state. Out of people who lived in different houses, 9% moved from different state. Out of people who lived in different houses, 3% moved from abroad.
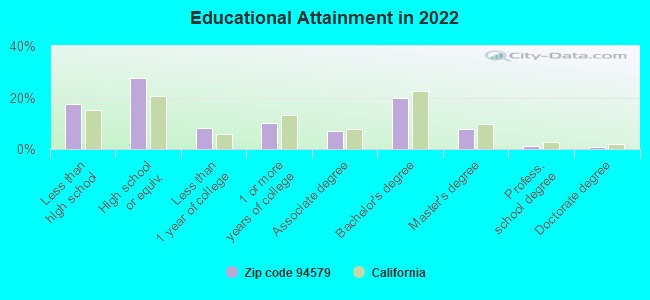
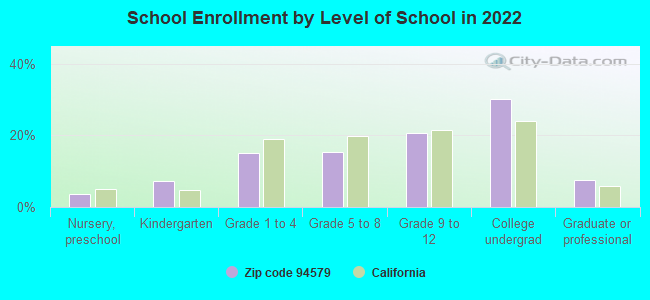
Private vs. public school enrollment:
Students in private schools in grades 1 to 8 (elementary and middle school): 320
Here:
24.4%
California:
10.5%
Students in private schools in grades 9 to 12 (high school): 41
Here:
4.8%
California:
8.5%
Students in private undergraduate colleges: 159
Here:
12.5%
California:
15.9%
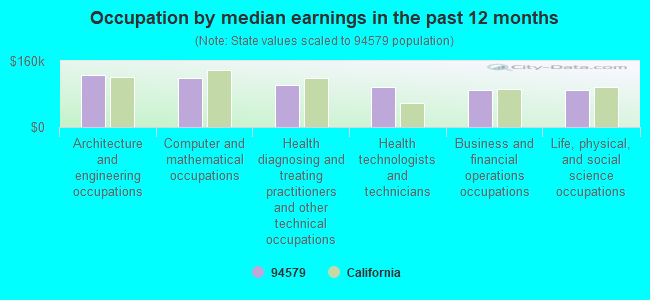
Occupation by median earnings in the past 12 months ($)
126,057Architecture and engineering occupations
119,583Computer and mathematical occupations
101,057Health diagnosing and treating practitioners and other technical occupations
97,199Health technologists and technicians
90,218Business and financial operations occupations
90,074Life, physical, and social science occupations
Companies with federal contracts located in this zip code:
HILTON GARDEN INN (510 LEWELLING BLVD in SAN LEANDRO, CA; small business)
$6,126 with Army for Lodging - Hotel/Motel. Signed on 2004-09-08. Completion date: 2004-09-11.
Top industries in this zip code by the number of employees in 2005:
Other Services (except Public Administration): Religious Organizations (100-249 employees: 1 establishment, 20-49 employees: 2 establishments, 5-9 employees: 1 establishment, 1-4 employees: 2 establishments)
2005 - 2018 National Fire Incident Reporting System (NFIRS) incidents
According to the data from the years 2005 - 2018 the average number of fire incidents per year is 24. The highest number of reported fires - 49 took place in 2011, and the least - 0 in 2013. The data has a declining trend.
When looking into fire subcategories, the most reports belonged to: Structure Fires (44.1%), and Outside Fires (31.8%).
Fire incident types reported to NFIRS in Zip Code 94579


 Nearest zip codes: 94580, 94577, 94578, 94603, 94541, 94605.
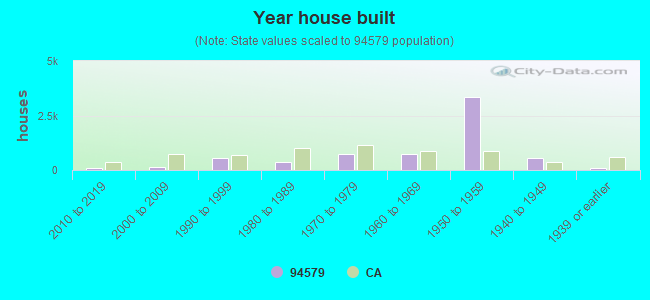


 According to the data from the years 2005 - 2018 the average number of fire incidents per year is 24. The highest number of reported fires - 49 took place in 2011, and the least - 0 in 2013. The data has a declining trend.
 When looking into fire subcategories, the most reports belonged to: Structure Fires (44.1%), and Outside Fires (31.8%).