Estimated zip code population in 2022: 46,901 Zip code population in 2010: 42,989 Zip code population in 2000: 36,924
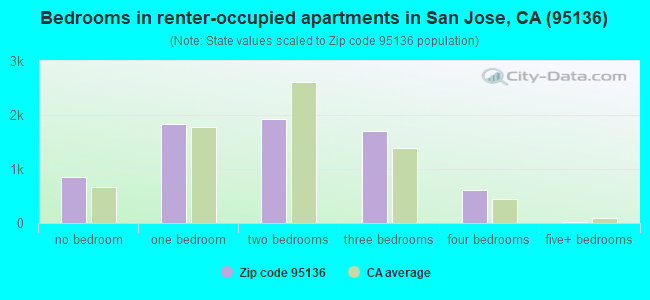
Houses and condos: 16,715 Renter-occupied apartments: 6,953
% of renters here:
43%
State:
44%
March 2022 cost of living index in zip code 95136: 122.6 (high, U.S. average is 100)
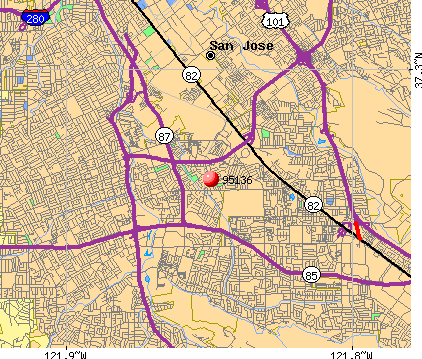
Land area: 4.7 sq. mi. Water area: 0.0 sq. mi.
Population density: 10,017 people per square mile
(high).
OSM Map
General Map
Google Map
MSN Map
OSM Map
General Map
Google Map
MSN Map
OSM Map
General Map
Google Map
MSN Map
OSM Map
General Map
Google Map
MSN Map
Please wait while loading the map...
Real estate property taxes paid for housing units in 2022:
This zip code:
0.7% ($8,462)
California:
0.7% ($4,831)
Median real estate property taxes paid for housing units with mortgages in 2022: $10,007 (0.9%) Median real estate property taxes paid for housing units with no mortgage in 2022: $5,220 (0.5%)
Estimated median house/condo value in 2022: $1,137,318
95136:
$1,137,318
California:
$715,900
According to our research of California and other state lists, there were 63 registered sex offenders living in 95136 zip code as of May 09, 2024. The ratio of all residents to sex offenders in zip code 95136 is 715 to 1. The ratio of registered sex offenders to all residents in this zip code is near the state average.
Median resident age:
This zip code:
37.9 years
California median age:
37.9 years
Average household size:
This zip code:
2.8 people
California:
2.8 people
Averages for the 2020 tax year for zip code 95136, filed in 2021:
Average Adjusted Gross Income (AGI) in 2020: $113,676 (Individual Income Tax Returns)
Here:
$113,676
State:
$95,910
Salary/wage: $107,823 (reported on 85.5% of returns)
Here:
$107,823
State:
$77,331
(% of AGI for various income ranges: 1188.9% for AGIs below $25k, 3983.6% for AGIs $25k-50k, 7510.9% for AGIs $50k-75k, 11019.9% for AGIs $75k-100k, 21017.2% for AGIs $100k-200k, 114436.2% for AGIs over 200k)
Taxable interest for individuals: $1,057 (reported on 38.2% of returns)
This zip code:
$1,057
California:
$2,294
(% of AGI for various income ranges: 16.6% for AGIs below $25k, 23.7% for AGIs $25k-50k, 28.7% for AGIs $50k-75k, 74.0% for AGIs $75k-100k, 98.3% for AGIs $100k-200k, 402.8% for AGIs over 200k)
Ordinary dividends: $3,914 (reported on 27.7% of returns)
Here:
$3,914
State:
$10,949
(% of AGI for various income ranges: 24.1% for AGIs below $25k, 38.4% for AGIs $25k-50k, 66.8% for AGIs $50k-75k, 112.3% for AGIs $75k-100k, 243.0% for AGIs $100k-200k, 1421.9% for AGIs over 200k)
Net capital gain/loss in AGI: +$20,950 (reported on 28.2% of returns)
Here:
+$20,950
State:
+$49,306
(% of AGI for various income ranges: 9.1% for AGIs below $25k, 25.0% for AGIs $25k-50k, 93.6% for AGIs $50k-75k, 180.2% for AGIs $75k-100k, 492.6% for AGIs $100k-200k, 12027.7% for AGIs over 200k)
Profit/loss from business: +$15,122 (reported on 15.2% of returns)
Here:
+$15,122
State:
+$15,671
(% of AGI for various income ranges: 179.5% for AGIs below $25k, 210.9% for AGIs $25k-50k, 264.8% for AGIs $50k-75k, 312.0% for AGIs $75k-100k, 462.8% for AGIs $100k-200k, 1949.6% for AGIs over 200k)
Taxable individual retirement arrangement distribution: $20,966 (reported on 6.3% of returns)
95136:
$20,966
California:
$23,505
(% of AGI for various income ranges: 49.4% for AGIs below $25k, 81.9% for AGIs $25k-50k, 158.3% for AGIs $50k-75k, 246.9% for AGIs $75k-100k, 459.6% for AGIs $100k-200k, 833.0% for AGIs over 200k)
Self-employed (Keogh) retirement plans: $21,593 (reported on 0.7% of returns)
95136:
$21,593
California:
$30,163
(% of AGI for various income ranges: 16.7% for AGIs $50k-75k, 18.5% for AGIs $100k-200k, 250.2% for AGIs over 200k)
Total itemized deductions: $32,698 (reported on 20.2% of returns)
Here:
$32,698
State:
$39,517
(% of AGI for various income ranges: 95.8% for AGIs below $25k, 218.6% for AGIs $25k-50k, 399.8% for AGIs $50k-75k, 919.0% for AGIs $75k-100k, 1929.4% for AGIs $100k-200k, 7441.9% for AGIs over 200k)
Charity contributions: $5,675 (reported on 15.8% of returns)
Here:
$5,675
State:
$12,598
(% of AGI for various income ranges: 2.7% for AGIs below $25k, 18.8% for AGIs $25k-50k, 52.8% for AGIs $50k-75k, 107.4% for AGIs $75k-100k, 259.5% for AGIs $100k-200k, 1107.4% for AGIs over 200k)
Taxes paid: $9,354 (reported on 20.2% of returns)
95136:
$9,354
State:
$8,807
(% of AGI for various income ranges: 23.1% for AGIs below $25k, 51.6% for AGIs $25k-50k, 111.3% for AGIs $50k-75k, 279.5% for AGIs $75k-100k, 612.2% for AGIs $100k-200k, 2007.4% for AGIs over 200k)
Earned income credit: $1,772 (reported on 8.4% of returns)
Here:
$1,772
State:
$2,074
(% of AGI for various income ranges: 60.0% for AGIs below $25k, 47.8% for AGIs $25k-50k)
Percentage of individuals using paid preparers for their 2020 taxes: 92.0%
Here:
92%
State:
92%
(% for various income ranges: 88.7% for AGIs below $25k, 91.9% for AGIs $25k-50k, 92.1% for AGIs $50k-75k, 92.6% for AGIs $75k-100k, 93.1% for AGIs $100k-200k, 95.2% for AGIs over 200k)
Averages for the 2012 tax year for zip code 95136, filed in 2013:
Average Adjusted Gross Income (AGI) in 2012: $73,449 (Individual Income Tax Returns)
Here:
$73,449
State:
$72,726
Salary/wage: $70,591 (reported on 87.1% of returns)
Here:
$70,591
State:
$59,079
(% of AGI for various income ranges: 76.2% for AGIs below $25k, 83.0% for AGIs $25k-50k, 82.9% for AGIs $50k-75k, 81.9% for AGIs $75k-100k, 85.4% for AGIs $100k-200k, 84.5% for AGIs over 200k)
Taxable interest for individuals: $683 (reported on 39.2% of returns)
This zip code:
$683
California:
$2,146
(% of AGI for various income ranges: 0.9% for AGIs below $25k, 0.4% for AGIs $25k-50k, 0.4% for AGIs $50k-75k, 0.4% for AGIs $75k-100k, 0.3% for AGIs $100k-200k, 0.3% for AGIs over 200k)
Ordinary dividends: $3,017 (reported on 22.0% of returns)
Here:
$3,017
State:
$9,308
(% of AGI for various income ranges: 1.3% for AGIs below $25k, 0.7% for AGIs $25k-50k, 0.8% for AGIs $50k-75k, 0.9% for AGIs $75k-100k, 0.9% for AGIs $100k-200k, 1.0% for AGIs over 200k)
Net capital gain/loss in AGI: +$5,303 (reported on 20.2% of returns)
Here:
+$5,303
State:
+$30,460
(% of AGI for various income ranges: 0.5% for AGIs $50k-75k, 0.2% for AGIs $75k-100k, 0.6% for AGIs $100k-200k, 5.0% for AGIs over 200k)
Profit/loss from business: +$15,359 (reported on 15.0% of returns)
Here:
+$15,359
State:
+$17,064
(% of AGI for various income ranges: 10.2% for AGIs below $25k, 5.0% for AGIs $25k-50k, 2.9% for AGIs $50k-75k, 2.8% for AGIs $75k-100k, 2.3% for AGIs $100k-200k, 2.4% for AGIs over 200k)
Taxable individual retirement arrangement distribution: $16,039 (reported on 7.4% of returns)
95136:
$16,039
California:
$19,557
(% of AGI for various income ranges: 2.6% for AGIs below $25k, 2.0% for AGIs $25k-50k, 1.9% for AGIs $50k-75k, 2.1% for AGIs $75k-100k, 1.6% for AGIs $100k-200k, 0.8% for AGIs over 200k)
Self-employment retirement plans: $15,593 (reported on 0.7% of returns)
95136:
$15,593
California:
$24,530
(% of AGI for various income ranges: 0.2% for AGIs $25k-50k, 0.1% for AGIs $75k-100k, 0.2% for AGIs $100k-200k, 0.2% for AGIs over 200k)
Total itemized deductions: $29,084 (23% of AGI, reported on 40.5% of returns)
Here:
$29,084
State:
$34,004
Here:
22.9% of AGI
State:
22.7% of AGI
(% of AGI for various income ranges: 10.3% for AGIs below $25k, 10.0% for AGIs $25k-50k, 13.7% for AGIs $50k-75k, 17.0% for AGIs $75k-100k, 18.7% for AGIs $100k-200k, 16.5% for AGIs over 200k)
Charity contributions: $2,800 (reported on 33.1% of returns)
Here:
$2,800
State:
$4,659
(% of AGI for various income ranges: 0.6% for AGIs below $25k, 0.8% for AGIs $25k-50k, 1.1% for AGIs $50k-75k, 1.4% for AGIs $75k-100k, 1.5% for AGIs $100k-200k, 1.2% for AGIs over 200k)
Taxes paid: $12,603 (reported on 40.5% of returns)
95136:
$12,603
State:
$14,448
(% of AGI for various income ranges: 2.8% for AGIs below $25k, 2.5% for AGIs $25k-50k, 4.2% for AGIs $50k-75k, 6.2% for AGIs $75k-100k, 8.2% for AGIs $100k-200k, 9.6% for AGIs over 200k)
Earned income credit: $1,933 (reported on 12.4% of returns)
Here:
$1,933
State:
$2,286
(% of AGI for various income ranges: 4.9% for AGIs below $25k, 0.8% for AGIs $25k-50k)
Percentage of individuals using paid preparers for their 2012 taxes: 56.4%
Here:
56%
State:
64%
(% for various income ranges: 54.1% for AGIs below $25k, 58.3% for AGIs $25k-50k, 57.3% for AGIs $50k-75k, 59.0% for AGIs $75k-100k, 55.4% for AGIs $100k-200k, 57.4% for AGIs over 200k)
Averages for the 2004 tax year for zip code 95136, filed in 2005:
Average Adjusted Gross Income (AGI) in 2004: $60,777 (Individual Income Tax Returns)
Here:
$60,777
State:
$58,600
Salary/wage: $59,104 (reported on 88.9% of returns)
Here:
$59,104
State:
$49,455
(% of AGI for various income ranges: 141.4% for AGIs below $10k, 78.1% for AGIs $10k-25k, 86.6% for AGIs $25k-50k, 86.4% for AGIs $50k-75k, 87.3% for AGIs $75k-100k, 86.2% for AGIs over 100k)
Taxable interest for individuals: $918 (reported on 49.7% of returns)
This zip code:
$918
California:
$2,365
(% of AGI for various income ranges: 5.1% for AGIs below $10k, 1.6% for AGIs $10k-25k, 0.8% for AGIs $25k-50k, 0.8% for AGIs $50k-75k, 0.6% for AGIs $75k-100k, 0.6% for AGIs over 100k)
Taxable dividends: $1,526 (reported on 25.2% of returns)
Here:
$1,526
State:
$4,746
(% of AGI for various income ranges: 4.1% for AGIs below $10k, 1.2% for AGIs $10k-25k, 0.5% for AGIs $25k-50k, 0.6% for AGIs $50k-75k, 0.6% for AGIs $75k-100k, 0.6% for AGIs over 100k)
Net capital gain/loss: +$4,736 (reported on 24.6% of returns)
Here:
+$4,736
State:
+$23,418
(% of AGI for various income ranges: -3.3% for AGIs below $10k, -0.2% for AGIs $10k-25k, -0.0% for AGIs $25k-50k, 0.3% for AGIs $50k-75k, 0.5% for AGIs $75k-100k, 3.9% for AGIs over 100k)
Profit/loss from business: +$14,859 (reported on 14.6% of returns)
Here:
+$14,859
State:
+$16,826
(% of AGI for various income ranges: 6.3% for AGIs below $10k, 7.8% for AGIs $10k-25k, 4.4% for AGIs $25k-50k, 3.5% for AGIs $50k-75k, 3.1% for AGIs $75k-100k, 3.0% for AGIs over 100k)
IRA payment deduction: $3,105 (reported on 2.6% of returns)
95136:
$3,105
California:
$3,192
(% of AGI for various income ranges: 0.2% for AGIs $10k-25k, 0.2% for AGIs $25k-50k, 0.1% for AGIs $50k-75k, 0.2% for AGIs $75k-100k, 0.1% for AGIs over 100k)
Self-employed pension: $12,904 (reported on 0.9% of returns)
Here:
$12,904
California:
$17,688
(% of AGI for various income ranges: 0.1% for AGIs $25k-50k, 0.1% for AGIs $50k-75k, 0.2% for AGIs $75k-100k, 0.3% for AGIs over 100k)
Total itemized deductions: $25,522 (26% of AGI, reported on 45.5% of returns)
Here:
$25,522
State:
$28,113
Here:
26.4% of AGI
State:
25.3% of AGI
(% of AGI for various income ranges: 34.7% for AGIs below $10k, 14.1% for AGIs $10k-25k, 14.7% for AGIs $25k-50k, 19.7% for AGIs $50k-75k, 21.6% for AGIs $75k-100k, 19.7% for AGIs over 100k)
Charity contributions deductions: $2,574 (3% of AGI, reported on 39.6% of returns)
Here:
$2,574
State:
$3,923
Here:
2.6% of AGI
State:
3.3% of AGI
(% of AGI for various income ranges: 1.1% for AGIs below $10k, 0.8% for AGIs $10k-25k, 1.2% for AGIs $25k-50k, 1.7% for AGIs $50k-75k, 1.7% for AGIs $75k-100k, 1.9% for AGIs over 100k)
Total tax: $8,895 (reported on 83.1% of returns)
95136:
$8,895
State:
$10,761
(% of AGI for various income ranges: 5.1% for AGIs below $10k, 4.8% for AGIs $10k-25k, 7.6% for AGIs $25k-50k, 9.8% for AGIs $50k-75k, 10.8% for AGIs $75k-100k, 15.7% for AGIs over 100k)
Earned income credit: $1,472 (reported on 9.0% of returns)
Here:
$1,472
State:
$1,763
Percentage of individuals using paid preparers for their 2004 taxes: 57.0%
Here:
57%
State:
66%
(% for various income ranges: 49.0% for AGIs below $10k, 57.4% for AGIs $10k-25k, 60.5% for AGIs $25k-50k, 61.0% for AGIs $50k-75k, 56.9% for AGIs $75k-100k, 54.7% for AGIs over 100k)
Likely homosexual households (counted as self-reported same-sex unmarried-partner households)
Lesbian couples: 0.0% of all households
Gay men: 0.2% of all households
Household received Food Stamps/SNAP in the past 12 months: 1,216 Household did not receive Food Stamps/SNAP in the past 12 months: 14,899
Women who had a birth in the past 12 months: 546 (453 now married, 91 unmarried) Women who did not have a birth in the past 12 months: 11,695 (5,169 now married, 6,503 unmarried)
Housing units in zip code 95136 with a mortgage: 6,177 (940 second mortgage, 8 home equity loan, 835 both second mortgage and home equity loan) Houses without a mortgage: 74
Median monthly owner costs for units with a mortgage: $3,601 Median monthly owner costs for units without a mortgage: $1,056
Residents with income below the poverty level in 2022:
This zip code:
7.3%
Whole state:
12.2%
Residents with income below 50% of the poverty level in 2022:
This zip code:
2.6%
Whole state:
6.2%
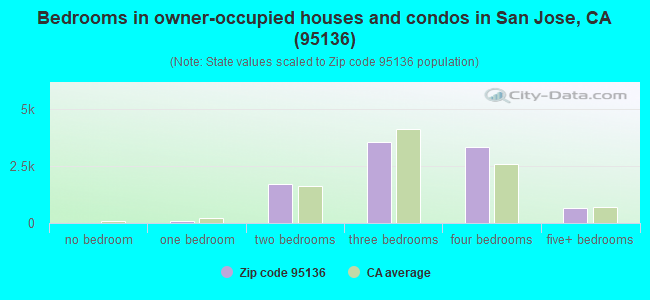
Median number of rooms in houses and condos:
Here:
6.1
State:
6.0
Median number of rooms in apartments:
Here:
3.8
State:
3.9
Notable locations in this zip code not listed on our city pages
Notable locations in zip code 95136: Capitol Drive-In (A), Golden State Medical Services (B), San Jose Fire Department Station 13 (C). Display/hide their locations on the map
6,374 married couples with children.
2,299 single-parent households (483 men, 1,816 women).
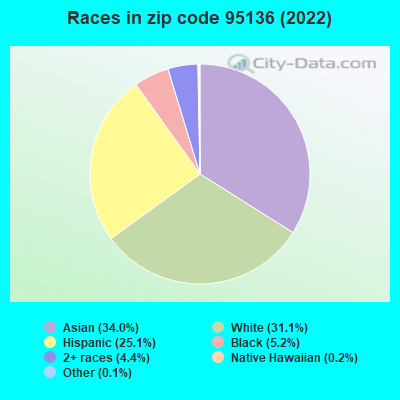
47.5% of residents of 95136 zip code speak English at home.
15.7% of residents speak Spanish at home (67% very well, 17% well, 13% not well, 4% not at all).
8.5% of residents speak other Indo-European language at home (70% very well, 20% well, 7% not well, 3% not at all).
24.6% of residents speak Asian or Pacific Island language at home (51% very well, 26% well, 22% not well, 2% not at all).
3.7% of residents speak other language at home (57% very well, 19% well, 14% not well, 10% not at all).
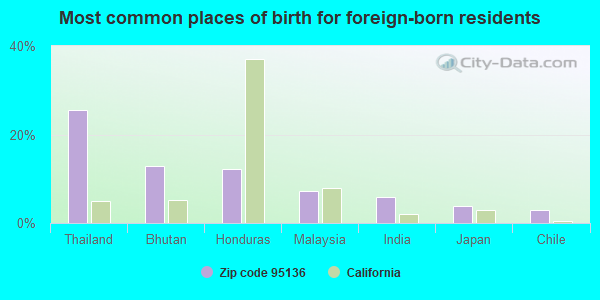
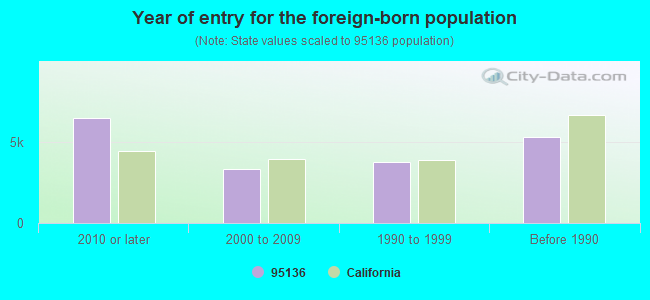
Foreign born population: 17,941 (38.3%) (58.9% of them are naturalized citizens)
Major facilities with environmental interests located in this zip code:
MICRO CHASSIS DIV KEENE CORP (3590 SNELL AVE in SAN JOSE, CA)
STATE MASTER (California - Hazardous Waste Tracking) - HAZARDOU WASTE PROGRAM CRITERIA AND HAZARDOUS AIR POLLUTANT INVENTORY (Inventory of air pollution sources) Small Quantity Generators, between 100 kg and 1000 kg of hazardous waste/month (Resource Conservation and Recovery Act (tracking hazardous waste)) - notification Business SIC classification: COATING, ENGRAVING, AND ALLIED SERVICES Organizations: BAIRNCO CORP (CONTACT/OWNER)
Alternative names: MICRO CHASSIS DIV. OF SERRA CORP., MICRO CHASSIS, DIVISION OF SER
EXPRESSWAY AUTO BODY (905 WEST CAPITOL EXPRESSWAY in SAN JOSE, CA)
STATE MASTER (California - Hazardous Waste Tracking) - HAZARDOU WASTE PROGRAM CRITERIA AND HAZARDOUS AIR POLLUTANT INVENTORY (Inventory of air pollution sources) Small Quantity Generators, between 100 kg and 1000 kg of hazardous waste/month (Resource Conservation and Recovery Act (tracking hazardous waste)) - notification Business SIC classification: TOP, BODY, AND UPHOLSTERY REPAIR SHOPS AND PAINT SHOPS Organizations: MICHAEL AND CO INC (CONTACT/OWNER)
Alternative names: EXPRESSWAY AUTOBODY
CAPITOL COLLISION (3517 HILLCAP AVE in SAN JOSE, CA)
STATE MASTER (California - Hazardous Waste Tracking) - HAZARDOU WASTE PROGRAM CRITERIA AND HAZARDOUS AIR POLLUTANT INVENTORY (Inventory of air pollution sources) Small Quantity Generators, between 100 kg and 1000 kg of hazardous waste/month (Resource Conservation and Recovery Act (tracking hazardous waste)) - notification Business SIC classification: TOP, BODY, AND UPHOLSTERY REPAIR SHOPS AND PAINT SHOPS Organizations: CREEKSIDE AUTO GROUP (CONTACT/OWNER)
NORMANDIN CHRYSLER PLYMOUTH (900 WEST CAPITOL EXPRESSWAY in SAN JOSE, CA)
STATE MASTER (California - Hazardous Waste Tracking) - HAZARDOU WASTE PROGRAM CRITERIA AND HAZARDOUS AIR POLLUTANT INVENTORY (Inventory of air pollution sources) Small Quantity Generators, between 100 kg and 1000 kg of hazardous waste/month (Resource Conservation and Recovery Act (tracking hazardous waste)) Business SIC classification: MOTOR VEHICLE DEALERS (NEW AND USED) Alternative names: NORMANDIN CHRYSLER-JEEP
BALL SCREWS & ACTUATORS (3616 SNELL AVE in SAN JOSE, CA)
STATE MASTER (California - Hazardous Waste Tracking) - HAZARDOU WASTE PROGRAM Small Quantity Generators, between 100 kg and 1000 kg of hazardous waste/month (Resource Conservation and Recovery Act (tracking hazardous waste)) - notification Business NAICS classification: MECHANICAL POWER TRANSMISSION EQUIPMENT MANUFACTURING. Organizations: BALL SCREW & ACTUATOR CO INC (CONTACT/OWNER)
CAPITOL DODGE INC (1050 W CAPITOL EXP in SAN JOSE, CA)
STATE MASTER (California - Hazardous Waste Tracking) - HAZARDOU WASTE PROGRAM Small Quantity Generators, between 100 kg and 1000 kg of hazardous waste/month (Resource Conservation and Recovery Act (tracking hazardous waste)) - notification Alternative names: HARTZHEIM DODGE
CAPITOL NISSAN VOLVO (1120 W CAPITOL EXPWY in SAN JOSE, CA)
STATE MASTER (California - Hazardous Waste Tracking) - HAZARDOU WASTE PROGRAM Small Quantity Generators, between 100 kg and 1000 kg of hazardous waste/month (Resource Conservation and Recovery Act (tracking hazardous waste)) - notification Organizations: SIERRA MGNT GRP (CONTACT/OWNER)
CAPITOL OLDSMOBILE GMC HYUNDAI (980 W CAPITOL EXPRESS WAY in SAN JOSE, CA)
STATE MASTER (California - Hazardous Waste Tracking) - HAZARDOU WASTE PROGRAM Small Quantity Generators, between 100 kg and 1000 kg of hazardous waste/month (Resource Conservation and Recovery Act (tracking hazardous waste)) - notification Organizations: KENNETH H OKENQUIST (CONTACT/OWNER)
Alternative names: CAPITOL BUICK PONTIAC GMC
CAPITOL TOYOTA (775 CAPITOL EXPWY AUTO MALL in SAN JOSE, CA)
STATE MASTER (California - Hazardous Waste Tracking) - HAZARDOU WASTE PROGRAM Small Quantity Generators, between 100 kg and 1000 kg of hazardous waste/month (Resource Conservation and Recovery Act (tracking hazardous waste)) - notification Organizations: JERRY BRASSFIELD (CONTACT/OWNER)
ALMADEN MAZDA (920 W CAPITOL EXPRESSWAY in SAN JOSE, CA)
STATE MASTER (California - Hazardous Waste Tracking) - HAZARDOU WASTE PROGRAM Small Quantity Generators, between 100 kg and 1000 kg of hazardous waste/month (Resource Conservation and Recovery Act (tracking hazardous waste))
ERIKSON ELEMENTARY (4849 PEARL AVE. in SAN JOSE, CA)
(National Center for Education Statistics) - STATE ID-6048524 Organizations: SAN JOSE UNIFIED (SCHOOL DISTRICT)
GUNDERSON HIGH (620 GAUNDABERT LANE in SAN JOSE, CA)
(National Center for Education Statistics) - STATE ID-4330080 Organizations: SAN JOSE UNIFIED (SCHOOL DISTRICT)
GUNDERSON PLUS (CONT.) (622 GAUNDABERT LANE in SAN JOSE, CA)
(National Center for Education Statistics) - STATE ID-4330429 Organizations: SAN JOSE UNIFIED (SCHOOL DISTRICT)
Housing units lacking complete plumbing facilities: 0.7% Housing units lacking complete kitchen facilities: 1.8%
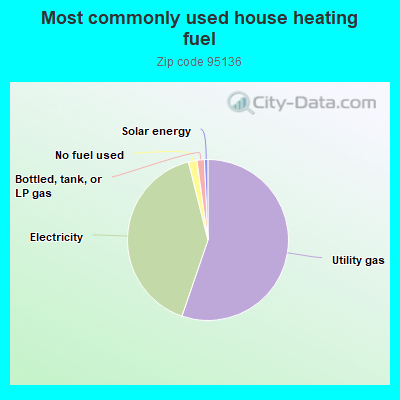
55.2%Utility gas
40.8%Electricity
1.7%No fuel used
1.5%Bottled, tank, or LP gas
0.7%Solar energy
Population in 1990: 31,200. Population change in the 1990s: +5,724 (+18.3%).
Place of birth for U.S.-born residents:
This state: 22,900
Northeast: 1,165
Midwest: 1,402
South: 1,475
West: 1,572
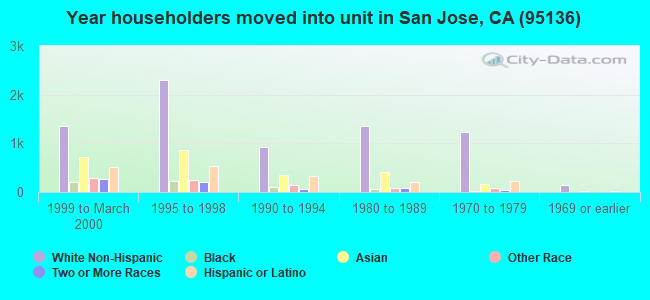
51% of the 95136 zip code residents lived in the same house 5 years ago. Out of people who lived in different houses, 75% lived in this county. Out of people who lived in different counties, 50% lived in California.
88% of the 95136 zip code residents lived in the same house 1 year ago. Out of people who lived in different houses, 62% moved from this county. Out of people who lived in different houses, 17% moved from different county within same state. Out of people who lived in different houses, 6% moved from different state. Out of people who lived in different houses, 15% moved from abroad.
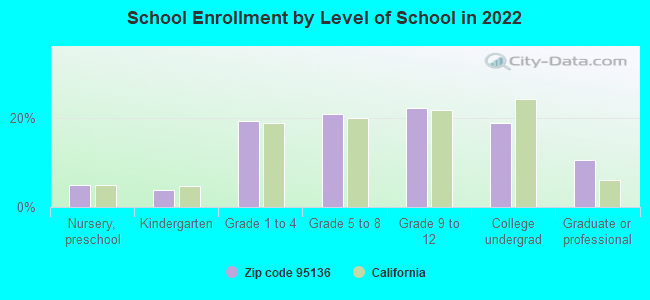
Private vs. public school enrollment:
Students in private schools in grades 1 to 8 (elementary and middle school): 1,100
Here:
23.9%
California:
10.5%
Students in private schools in grades 9 to 12 (high school): 274
Here:
11.0%
California:
8.5%
Students in private undergraduate colleges: 217
Here:
10.2%
California:
15.9%
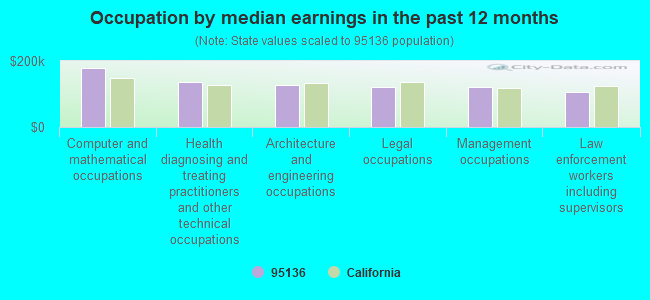
Occupation by median earnings in the past 12 months ($)
180,285Computer and mathematical occupations
135,254Health diagnosing and treating practitioners and other technical occupations
128,681Architecture and engineering occupations
121,414Legal occupations
121,214Management occupations
104,693Law enforcement workers including supervisors
Companies with federal contracts located in this zip code:
ACME & SONS SANITATION, INC (3408 HILLCAP AVENUE in SAN JOSE, CA) : $497,881 in 140 contractsfrom 1999 to 2006
Contracts for Lease or Rental of Equipment -- Plumbing, Heating, and Waste Disposal Equipment by Army Signed by year:2000: $125,989; 2001: $0; 2002: $76,438; 2003: $109,459; 2004: $89,542; 2005: $65,085; 2006: $2,670.
Biggest contracts:
$31,878 with Army for Lease or Rental of Equipment -- Plumbing, Heating, and Waste Disposal Equipment. Signed on 2000-07-26. Completion date: 2000-06-30.
$27,235, same as above.Signed on 2002-06-03. Completion date: 2002-06-30.
$26,211, same as above.Signed on 2002-08-07. Completion date: 2002-07-31.
$25,515, same as above.Signed on 2000-07-26. Completion date: 2000-07-31.
ADD CUBE EQUIPMENT (5282 TURNBERRY PLACE in SAN JOSE, CA; small business)
$39,380 with Air Force for Miscellaneous Construction Equipment. Signed on 2003-03-28. Completion date: 2003-06-27.
UNITED SITE SERVICES (3408 HILLCAP AVENUE in SAN JOSE, CA; small business)
$11,950 with Air Force for Lease or Rental of Equipment -- Miscellaneous. Signed on 2005-10-07. Completion date: 2005-10-17.
Top industries in this zip code by the number of employees in 2005:
2006 - 2017 National Fire Incident Reporting System (NFIRS) incidents
According to the data from the years 2006 - 2017 the average number of fire incidents per year is 24. The highest number of fire incidents - 99 took place in 2017, and the least - 0 in 2007. The data has a growing trend.
When looking into fire subcategories, the most incidents belonged to: Outside Fires (58.4%), and Structure Fires (22.7%).
Fire incident types reported to NFIRS in Zip Code 95136


 Nearest zip codes: 95111, 95123, 95118, 95125, 95121, 95122.
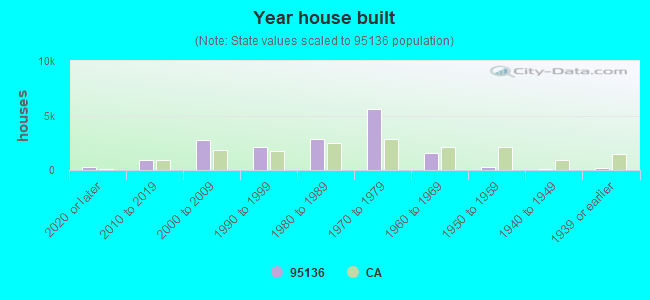


 According to the data from the years 2006 - 2017 the average number of fire incidents per year is 24. The highest number of fire incidents - 99 took place in 2017, and the least - 0 in 2007. The data has a growing trend.
 When looking into fire subcategories, the most incidents belonged to: Outside Fires (58.4%), and Structure Fires (22.7%).