Estimated zip code population in 2022: 23,872 Zip code population in 2010: 24,152 Zip code population in 2000: 23,557
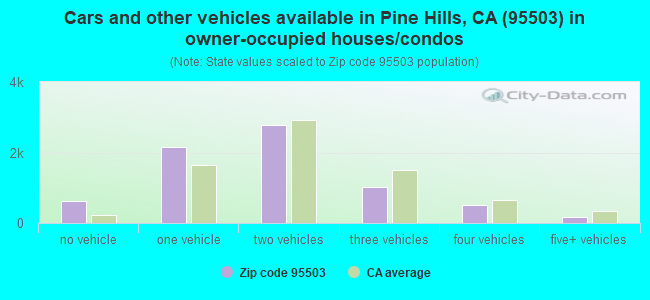
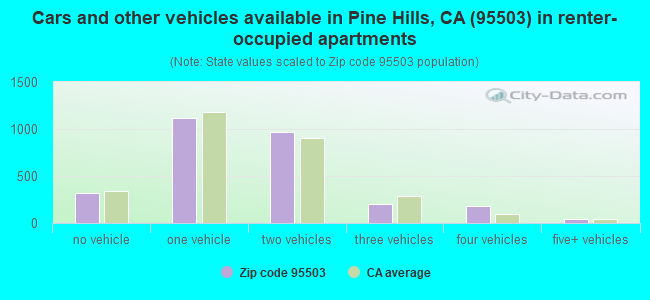
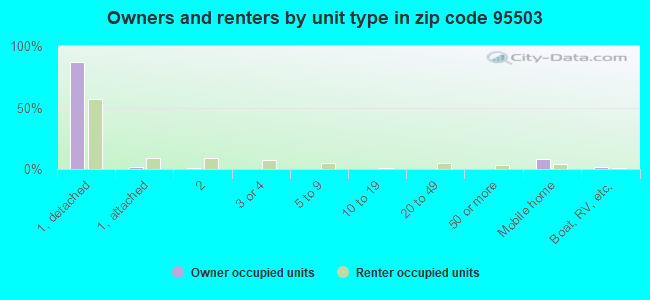
Houses and condos: 10,734 Renter-occupied apartments: 2,845
% of renters here:
28%
State:
44%
March 2022 cost of living index in zip code 95503: 94.1 (less than average, U.S. average is 100)
Land area: 86.4 sq. mi. Water area: 3.2 sq. mi.
Population density: 276 people per square mile
(very low).
OSM Map
General Map
Google Map
MSN Map
OSM Map
General Map
Google Map
MSN Map
OSM Map
General Map
Google Map
MSN Map
OSM Map
General Map
Google Map
MSN Map
Please wait while loading the map...
Real estate property taxes paid for housing units in 2022:
This zip code:
0.6% ($2,664)
California:
0.7% ($4,831)
Median real estate property taxes paid for housing units with mortgages in 2022: $2,955 (0.7%) Median real estate property taxes paid for housing units with no mortgage in 2022: $2,236 (0.6%)
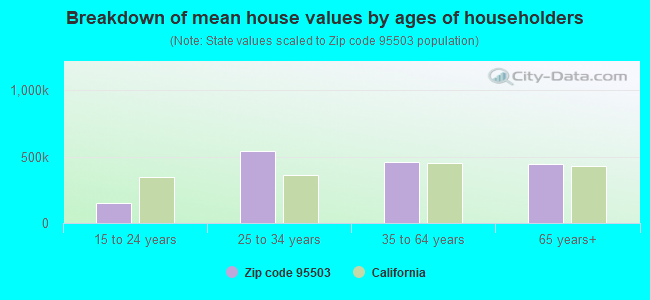
Estimated median house/condo value in 2022: $411,102
95503:
$411,102
California:
$715,900
According to our research of California and other state lists, there were 32 registered sex offenders living in 95503 zip code as of April 27, 2024. The ratio of all residents to sex offenders in zip code 95503 is 819 to 1. The ratio of registered sex offenders to all residents in this zip code is near the state average.
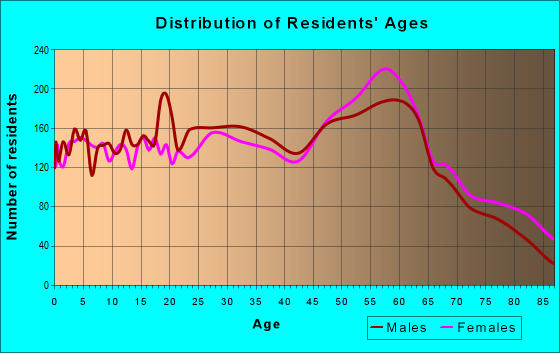
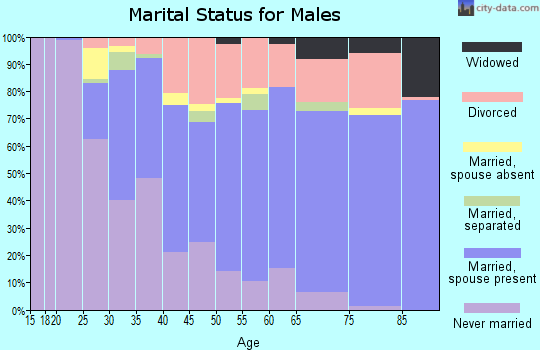
Median resident age:
This zip code:
46.4 years
California median age:
37.9 years
Average household size:
This zip code:
2.3 people
California:
2.8 people
Averages for the 2020 tax year for zip code 95503, filed in 2021:
Average Adjusted Gross Income (AGI) in 2020: $63,669 (Individual Income Tax Returns)
Here:
$63,669
State:
$95,910
Salary/wage: $50,487 (reported on 74.3% of returns)
Here:
$50,487
State:
$77,331
(% of AGI for various income ranges: 1185.9% for AGIs below $25k, 3890.8% for AGIs $25k-50k, 6642.6% for AGIs $50k-75k, 9966.2% for AGIs $75k-100k, 17230.4% for AGIs $100k-200k, 62390.0% for AGIs over 200k)
Taxable interest for individuals: $1,694 (reported on 40.9% of returns)
This zip code:
$1,694
California:
$2,294
(% of AGI for various income ranges: 29.5% for AGIs below $25k, 33.8% for AGIs $25k-50k, 98.7% for AGIs $50k-75k, 120.3% for AGIs $75k-100k, 251.5% for AGIs $100k-200k, 3228.8% for AGIs over 200k)
Ordinary dividends: $5,943 (reported on 17.2% of returns)
Here:
$5,943
State:
$10,949
(% of AGI for various income ranges: 37.7% for AGIs below $25k, 53.9% for AGIs $25k-50k, 110.3% for AGIs $50k-75k, 187.2% for AGIs $75k-100k, 456.6% for AGIs $100k-200k, 4445.0% for AGIs over 200k)
Net capital gain/loss in AGI: +$16,803 (reported on 16.3% of returns)
Here:
+$16,803
State:
+$49,306
(% of AGI for various income ranges: 12.7% for AGIs below $25k, 44.4% for AGIs $25k-50k, 157.6% for AGIs $50k-75k, 214.3% for AGIs $75k-100k, 947.3% for AGIs $100k-200k, 22875.0% for AGIs over 200k)
Profit/loss from business: +$19,009 (reported on 16.8% of returns)
Here:
+$19,009
State:
+$15,671
(% of AGI for various income ranges: 197.6% for AGIs below $25k, 277.4% for AGIs $25k-50k, 475.8% for AGIs $50k-75k, 725.2% for AGIs $75k-100k, 1271.9% for AGIs $100k-200k, 7813.8% for AGIs over 200k)
Taxable individual retirement arrangement distribution: $16,116 (reported on 9.3% of returns)
95503:
$16,116
California:
$23,505
(% of AGI for various income ranges: 64.7% for AGIs below $25k, 97.7% for AGIs $25k-50k, 251.9% for AGIs $50k-75k, 359.5% for AGIs $75k-100k, 796.5% for AGIs $100k-200k, 2811.2% for AGIs over 200k)
Self-employed (Keogh) retirement plans: $20,386 (reported on 0.7% of returns)
95503:
$20,386
California:
$30,163
(% of AGI for various income ranges: 24.9% for AGIs $50k-75k, 159.2% for AGIs $100k-200k)
Total itemized deductions: $30,166 (reported on 8.5% of returns)
Here:
$30,166
State:
$39,517
(% of AGI for various income ranges: 70.4% for AGIs below $25k, 140.5% for AGIs $25k-50k, 397.9% for AGIs $50k-75k, 618.4% for AGIs $75k-100k, 1109.7% for AGIs $100k-200k, 9416.2% for AGIs over 200k)
Charity contributions: $6,887 (reported on 5.7% of returns)
Here:
$6,887
State:
$12,598
(% of AGI for various income ranges: 5.4% for AGIs below $25k, 11.6% for AGIs $25k-50k, 37.7% for AGIs $50k-75k, 75.3% for AGIs $75k-100k, 181.1% for AGIs $100k-200k, 2142.5% for AGIs over 200k)
Taxes paid: $7,136 (reported on 8.4% of returns)
95503:
$7,136
State:
$8,807
(% of AGI for various income ranges: 10.5% for AGIs below $25k, 22.5% for AGIs $25k-50k, 91.1% for AGIs $50k-75k, 189.5% for AGIs $75k-100k, 336.2% for AGIs $100k-200k, 1596.2% for AGIs over 200k)
Earned income credit: $1,867 (reported on 14.6% of returns)
Here:
$1,867
State:
$2,074
(% of AGI for various income ranges: 83.3% for AGIs below $25k, 61.2% for AGIs $25k-50k, 1.0% for AGIs $50k-75k)
Percentage of individuals using paid preparers for their 2020 taxes: 94.1%
Here:
94%
State:
92%
(% for various income ranges: 92.5% for AGIs below $25k, 94.7% for AGIs $25k-50k, 93.8% for AGIs $50k-75k, 95.2% for AGIs $75k-100k, 95.4% for AGIs $100k-200k, 96.9% for AGIs over 200k)
Averages for the 2012 tax year for zip code 95503, filed in 2013:
Average Adjusted Gross Income (AGI) in 2012: $52,322 (Individual Income Tax Returns)
Here:
$52,322
State:
$72,726
Salary/wage: $41,845 (reported on 77.0% of returns)
Here:
$41,845
State:
$59,079
(% of AGI for various income ranges: 69.8% for AGIs below $25k, 72.1% for AGIs $25k-50k, 66.0% for AGIs $50k-75k, 66.0% for AGIs $75k-100k, 61.1% for AGIs $100k-200k, 36.0% for AGIs over 200k)
Taxable interest for individuals: $1,515 (reported on 45.7% of returns)
This zip code:
$1,515
California:
$2,146
(% of AGI for various income ranges: 1.6% for AGIs below $25k, 0.9% for AGIs $25k-50k, 0.9% for AGIs $50k-75k, 1.3% for AGIs $75k-100k, 1.6% for AGIs $100k-200k, 1.7% for AGIs over 200k)
Ordinary dividends: $5,495 (reported on 20.6% of returns)
Here:
$5,495
State:
$9,308
(% of AGI for various income ranges: 2.4% for AGIs below $25k, 1.2% for AGIs $25k-50k, 1.6% for AGIs $50k-75k, 1.5% for AGIs $75k-100k, 2.4% for AGIs $100k-200k, 4.2% for AGIs over 200k)
Net capital gain/loss in AGI: +$5,911 (reported on 16.7% of returns)
Here:
+$5,911
State:
+$30,460
(% of AGI for various income ranges: 0.2% for AGIs $25k-50k, 0.6% for AGIs $50k-75k, 0.9% for AGIs $75k-100k, 1.8% for AGIs $100k-200k, 7.8% for AGIs over 200k)
Profit/loss from business: +$17,124 (reported on 17.5% of returns)
Here:
+$17,124
State:
+$17,064
(% of AGI for various income ranges: 10.5% for AGIs below $25k, 6.8% for AGIs $25k-50k, 4.7% for AGIs $50k-75k, 4.2% for AGIs $75k-100k, 5.6% for AGIs $100k-200k, 4.7% for AGIs over 200k)
Taxable individual retirement arrangement distribution: $12,597 (reported on 11.6% of returns)
95503:
$12,597
California:
$19,557
(% of AGI for various income ranges: 3.4% for AGIs below $25k, 2.3% for AGIs $25k-50k, 2.8% for AGIs $50k-75k, 3.2% for AGIs $75k-100k, 3.3% for AGIs $100k-200k, 1.9% for AGIs over 200k)
Self-employment retirement plans: $18,400 (reported on 0.9% of returns)
95503:
$18,400
California:
$24,530
(% of AGI for various income ranges: 0.2% for AGIs $50k-75k, 0.5% for AGIs $100k-200k, 0.9% for AGIs over 200k)
Total itemized deductions: $21,738 (24% of AGI, reported on 33.2% of returns)
Here:
$21,738
State:
$34,004
Here:
23.6% of AGI
State:
22.7% of AGI
(% of AGI for various income ranges: 12.9% for AGIs below $25k, 11.7% for AGIs $25k-50k, 13.8% for AGIs $50k-75k, 14.1% for AGIs $75k-100k, 15.6% for AGIs $100k-200k, 13.5% for AGIs over 200k)
Charity contributions: $2,814 (reported on 24.1% of returns)
Here:
$2,814
State:
$4,659
(% of AGI for various income ranges: 0.6% for AGIs below $25k, 0.9% for AGIs $25k-50k, 1.2% for AGIs $50k-75k, 1.3% for AGIs $75k-100k, 1.6% for AGIs $100k-200k, 1.8% for AGIs over 200k)
Taxes paid: $7,658 (reported on 33.0% of returns)
95503:
$7,658
State:
$14,448
(% of AGI for various income ranges: 2.4% for AGIs below $25k, 2.5% for AGIs $25k-50k, 3.8% for AGIs $50k-75k, 4.6% for AGIs $75k-100k, 6.4% for AGIs $100k-200k, 7.9% for AGIs over 200k)
Earned income credit: $1,953 (reported on 18.2% of returns)
Here:
$1,953
State:
$2,286
(% of AGI for various income ranges: 5.4% for AGIs below $25k, 1.0% for AGIs $25k-50k)
Percentage of individuals using paid preparers for their 2012 taxes: 58.7%
Here:
59%
State:
64%
(% for various income ranges: 49.9% for AGIs below $25k, 59.0% for AGIs $25k-50k, 65.6% for AGIs $50k-75k, 67.0% for AGIs $75k-100k, 69.0% for AGIs $100k-200k, 84.2% for AGIs over 200k)
Averages for the 2004 tax year for zip code 95503, filed in 2005:
Average Adjusted Gross Income (AGI) in 2004: $43,684 (Individual Income Tax Returns)
Here:
$43,684
State:
$58,600
Salary/wage: $35,095 (reported on 79.3% of returns)
Here:
$35,095
State:
$49,455
(% of AGI for various income ranges: 99.0% for AGIs below $10k, 70.9% for AGIs $10k-25k, 74.5% for AGIs $25k-50k, 71.7% for AGIs $50k-75k, 71.9% for AGIs $75k-100k, 42.9% for AGIs over 100k)
Taxable interest for individuals: $1,726 (reported on 53.6% of returns)
This zip code:
$1,726
California:
$2,365
(% of AGI for various income ranges: 5.9% for AGIs below $10k, 3.2% for AGIs $10k-25k, 1.8% for AGIs $25k-50k, 1.7% for AGIs $50k-75k, 1.6% for AGIs $75k-100k, 2.4% for AGIs over 100k)
Taxable dividends: $3,239 (reported on 24.8% of returns)
Here:
$3,239
State:
$4,746
(% of AGI for various income ranges: 4.8% for AGIs below $10k, 1.8% for AGIs $10k-25k, 1.3% for AGIs $25k-50k, 1.4% for AGIs $50k-75k, 1.1% for AGIs $75k-100k, 2.7% for AGIs over 100k)
Net capital gain/loss: +$14,200 (reported on 21.4% of returns)
Here:
+$14,200
State:
+$23,418
(% of AGI for various income ranges: -1.4% for AGIs below $10k, 0.6% for AGIs $10k-25k, 0.7% for AGIs $25k-50k, 1.7% for AGIs $50k-75k, 2.4% for AGIs $75k-100k, 19.4% for AGIs over 100k)
Profit/loss from business: +$18,287 (reported on 17.5% of returns)
Here:
+$18,287
State:
+$16,826
(% of AGI for various income ranges: 4.6% for AGIs below $10k, 6.3% for AGIs $10k-25k, 5.5% for AGIs $25k-50k, 4.7% for AGIs $50k-75k, 7.6% for AGIs $75k-100k, 10.7% for AGIs over 100k)
IRA payment deduction: $3,229 (reported on 4.1% of returns)
95503:
$3,229
California:
$3,192
(% of AGI for various income ranges: 0.4% for AGIs $10k-25k, 0.4% for AGIs $25k-50k, 0.4% for AGIs $50k-75k, 0.2% for AGIs $75k-100k, 0.2% for AGIs over 100k)
Self-employed pension: $16,259 (reported on 1.5% of returns)
Here:
$16,259
California:
$17,688
(% of AGI for various income ranges: 0.1% for AGIs $25k-50k, 0.1% for AGIs $50k-75k, 0.5% for AGIs $75k-100k, 1.3% for AGIs over 100k)
Total itemized deductions: $17,621 (23% of AGI, reported on 34.3% of returns)
Here:
$17,621
State:
$28,113
Here:
22.9% of AGI
State:
25.3% of AGI
(% of AGI for various income ranges: 15.4% for AGIs below $10k, 11.0% for AGIs $10k-25k, 12.6% for AGIs $25k-50k, 15.6% for AGIs $50k-75k, 16.5% for AGIs $75k-100k, 13.0% for AGIs over 100k)
Charity contributions deductions: $2,295 (3% of AGI, reported on 29.4% of returns)
Here:
$2,295
State:
$3,923
Here:
2.8% of AGI
State:
3.3% of AGI
(% of AGI for various income ranges: 0.5% for AGIs below $10k, 0.8% for AGIs $10k-25k, 1.2% for AGIs $25k-50k, 1.6% for AGIs $50k-75k, 1.8% for AGIs $75k-100k, 1.9% for AGIs over 100k)
Total tax: $6,387 (reported on 77.1% of returns)
95503:
$6,387
State:
$10,761
(% of AGI for various income ranges: 3.0% for AGIs below $10k, 4.4% for AGIs $10k-25k, 7.1% for AGIs $25k-50k, 9.0% for AGIs $50k-75k, 11.1% for AGIs $75k-100k, 18.3% for AGIs over 100k)
Earned income credit: $1,508 (reported on 14.7% of returns)
Here:
$1,508
State:
$1,763
Percentage of individuals using paid preparers for their 2004 taxes: 60.4%
Here:
60%
State:
66%
(% for various income ranges: 47.3% for AGIs below $10k, 55.0% for AGIs $10k-25k, 62.7% for AGIs $25k-50k, 68.2% for AGIs $50k-75k, 67.9% for AGIs $75k-100k, 81.3% for AGIs over 100k)
Likely homosexual households (counted as self-reported same-sex unmarried-partner households)
Lesbian couples: 0.7% of all households
Gay men: 0.0% of all households
Household received Food Stamps/SNAP in the past 12 months: 1,707 Household did not receive Food Stamps/SNAP in the past 12 months: 8,430
Women who had a birth in the past 12 months: 204 (76 now married, 129 unmarried) Women who did not have a birth in the past 12 months: 4,807 (2,026 now married, 2,775 unmarried)
Housing units in zip code 95503 with a mortgage: 3,804 (498 second mortgage, 6 home equity loan, 320 both second mortgage and home equity loan) Houses without a mortgage: 76
Median monthly owner costs for units with a mortgage: $1,938 Median monthly owner costs for units without a mortgage: $585
Residents with income below the poverty level in 2022:
This zip code:
17.2%
Whole state:
12.2%
Residents with income below 50% of the poverty level in 2022:
This zip code:
8.3%
Whole state:
6.2%
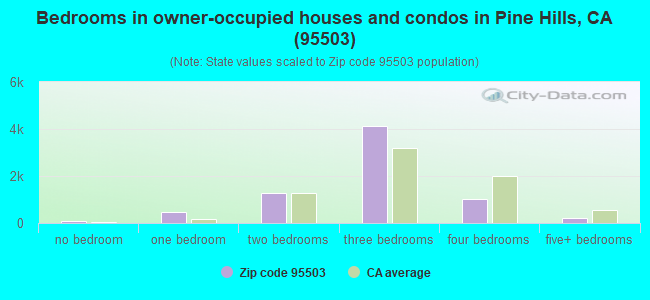
Median number of rooms in houses and condos:
Here:
5.9
State:
6.0
Median number of rooms in apartments:
Here:
4.4
State:
3.9
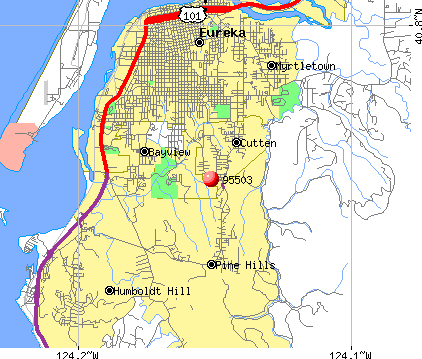
Notable locations in this zip code not listed on our city pages
Notable locations in zip code 95503: Eureka Municipal Golf Course (A), City of Eureka Water Treatment Plant (B), Eureka Wastewater Treatment Plant (C), Redwood Acres Fairground (D), Bertas Ranch (E), Zanes Ranch (F), Falk (G), Elk River Scout Camp (H), Elk River Corners (I), Humboldt 1 Fire Protection District Station 2 (J). Display/hide their locations on the map
Churches in zip code 95503 include: Temple Beth El (A), Sequoia Bible Church (B), First Congregational Church (C), First Church of God (D), Calvary Baptist Church (E). Display/hide their locations on the map
Streams, rivers, and creeks: Bridge Creek (A), Doe Creek (B), Freshwater Slough (C), Lake Creek (D), Martin Slough (E), McWhinney Creek (F), King Salmon Slough (G), Swain Slough (H), Freshwater Creek (I). Display/hide their locations on the map
Parks in zip code 95503 include: Sequoia Park (1), Highland Park (2), Fort Humboldt State Historic Park (3), Freshwater Park (4). Display/hide their locations on the map
2,466 married couples with children.
1,299 single-parent households (586 men, 713 women).
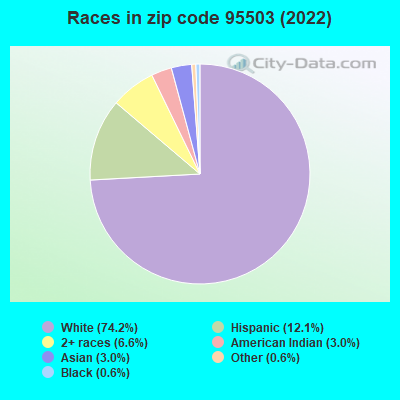
90.3% of residents of 95503 zip code speak English at home.
6.2% of residents speak Spanish at home (65% very well, 8% well, 3% not well, 25% not at all).
0.8% of residents speak other Indo-European language at home (68% very well, 10% well, 21% not well).
2.1% of residents speak Asian or Pacific Island language at home (52% very well, 28% well, 19% not well, 1% not at all).
0.5% of residents speak other language at home (100% very well).
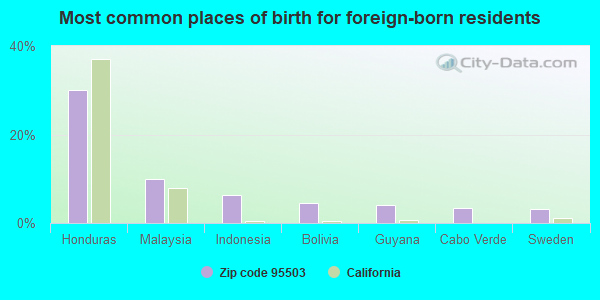
Foreign born population: 1,782 (7.5%) (48.1% of them are naturalized citizens)
This zip code:
7.5%
Whole state:
26.7%
30%Honduras
10%Malaysia
6%Indonesia
4%Bolivia
4%Guyana
3%Cabo Verde
3%Sweden
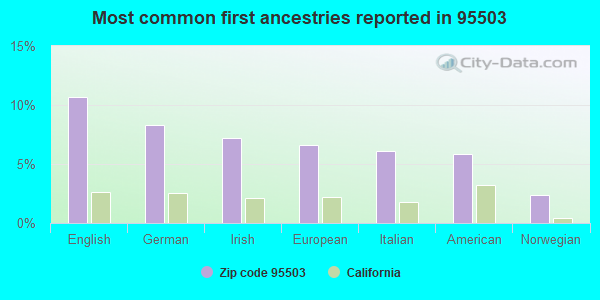
11%English
8%German
7%Irish
7%European
6%Italian
6%American
2%Norwegian
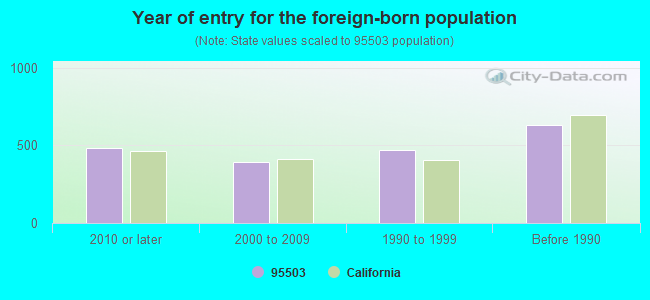
Year of entry for the foreign-born population
4822010 or later
3952000 to 2009
4711990 to 1999
630Before 1990
Facilities with environmental interests located in this zip code:
HUMBOLDT BAY POWER PLANT (1000 KING SALMON AVENUE in EUREKA, CA)
AIR MAJOR (AIRS/AFS) AIR PROGRAM (Clean Air Markets Division Business System) STATE MASTER (California - Hazardous Waste Tracking) - HAZARDOU WASTE PROGRAM ENFORCEMENT/COMPLIANCE ACTIVITY (Integrated Compliance Information System) CRITERIA AND HAZARDOUS AIR POLLUTANT INVENTORY (Inventory of air pollution sources) National Pollutant Discharge Elimination System MAJOR (Tracking pollutant discharge elimination systems) - permit HAZARDOUS WASTE BIENNIAL REPORTER (Resource Conservation and Recovery Act (tracking hazardous waste)) Large Quantity Generators, more that 1000 kg of hazardous waste/month (Resource Conservation and Recovery Act (tracking hazardous waste)) - notification TSD (Resource Conservation and Recovery Act (tracking hazardous waste)) - notification TRI REPORTER (Tracking of toxic chemicals releasing facilities) Business SIC classification: ELECTRIC SERVICES Business NAICS classification: FOSSIL FUEL ELECTRIC POWER GENERATION.; NUCLEAR ELECTRIC POWER GENERATION. Organizations: PACIFIC GAS AND ELECTRIC COMPANY (CONTACT/OPERATOR)
, PACIFIC GAS & ELECTRIC COMPANY (CONTACT/OWNER)
Alternative names: P G & E-HUMBOLDT BAY PLANT, P G AND E HUMBOLDT BAY POWER PLANT, PACIFIC GAS & ELECTRIC CO, PG&E- HUMBOLDT BAY, PG & E HUMBOLDT BAY POWER PLANT, PG&E HUMBOLT BAY POWER PLANT
ALICE BIRNEY ELEMENTARY SCHOOL (717 SOUTH AVE in EUREKA, CA)
(Geographic Names Information System) (National Center for Education Statistics) - STATE ID-6007751 Organizations: EUREKA CITY UNIFIED (SCHOOL DISTRICT)
Alternative names: BIRNEY (ALICE) ELEMENTARY
HUMBOLDT ORTHOPAEDIC ACCOCIATES INC (2826 HARRIS ST in EUREKA, CA) . Federal Facility
STATE MASTER (California - Hazardous Waste Tracking) - HAZARDOU WASTE PROGRAM Small Quantity Generators, between 100 kg and 1000 kg of hazardous waste/month (Resource Conservation and Recovery Act (tracking hazardous waste)) - notification Organizations: EDWARD EMMONS M D (CONTACT/OWNER)
Alternative names: EUREKA ORTHOPAEDIC MEDICAL GRP
EUREKA SECONDARY COMMUNITY DAY (674 ALLARD AVE in EUREKA, CA)
(National Center for Education Statistics) - STATE ID-1230127 Organizations: EUREKA CITY UNIFIED (SCHOOL DISTRICT)
FRESHWATER CHARTER MIDDLE (75 GREENWOOD HEIGHTS DR. in EUREKA, CA)
(National Center for Education Statistics) - STATE ID-6116289 Organizations: FRESHWATER ELEMENTARY (SCHOOL DISTRICT)
FRESHWATER ELEMENTARY (75 GREENWOOD HEIGHTS DR. in EUREKA, CA)
(National Center for Education Statistics) - STATE ID-6007884
GRANT ELEMENTARY (OAK AND H STS. in EUREKA, CA)
(National Center for Education Statistics) - STATE ID-6007777 Organizations: EUREKA CITY UNIFIED (SCHOOL DISTRICT)
LINCOLN ELEMENTARY (216 W HARRIS ST in EUREKA, CA)
(National Center for Education Statistics) - STATE ID-6007801 Organizations: EUREKA CITY UNIFIED (SCHOOL DISTRICT)
FLYING J GASOLINE, INC (3505 BROADWAY STREET in EUREKA, CA)
National Pollutant Discharge Elimination System NON-MAJOR (Tracking pollutant discharge elimination systems) - permit
KURE SHIPPING SA (M/V KURE/HUMBOLDT BAY OIL SPILL in EUREKA, CA)
National Pollutant Discharge Elimination System NON-MAJOR (Tracking pollutant discharge elimination systems) - permit
GREG PARTSAFAS TRANSPORTATION (5064 VANCE ST in EUREKA, CA)
TRANSPORTER (Resource Conservation and Recovery Act (tracking hazardous waste))
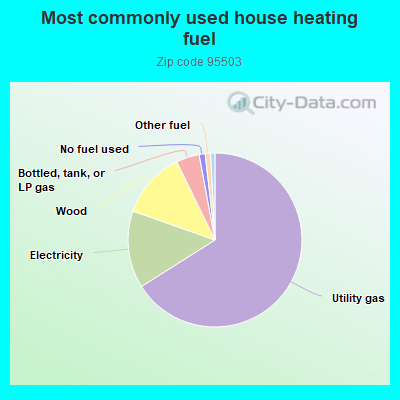
Housing units lacking complete plumbing facilities: 0.8% Housing units lacking complete kitchen facilities: 2.0%
65.7%Utility gas
14.3%Electricity
12.3%Wood
4.3%Bottled, tank, or LP gas
1.1%No fuel used
1.0%Other fuel
0.8%Solar energy
Place of birth for U.S.-born residents:
This state: 16,130
Northeast: 842
Midwest: 1,509
South: 1,302
West: 1,990
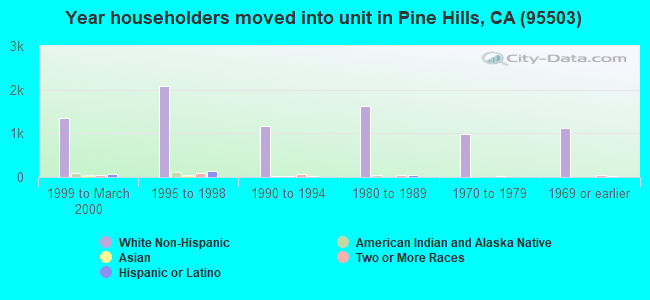
58% of the 95503 zip code residents lived in the same house 5 years ago. Out of people who lived in different houses, 68% lived in this county. Out of people who lived in different counties, 50% lived in California.
87% of the 95503 zip code residents lived in the same house 1 year ago. Out of people who lived in different houses, 53% moved from this county. Out of people who lived in different houses, 38% moved from different county within same state. Out of people who lived in different houses, 8% moved from different state.
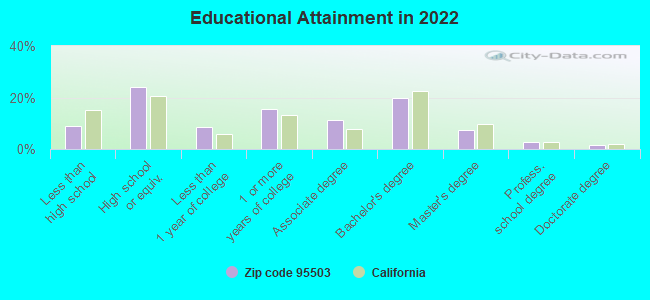
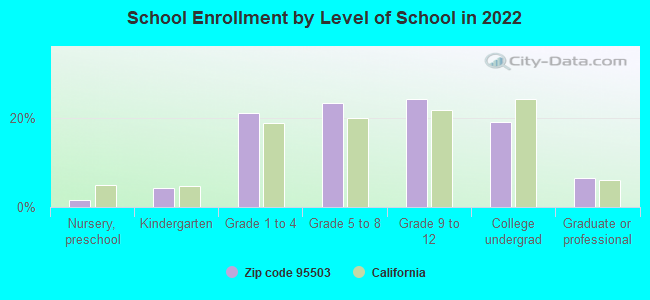
Private vs. public school enrollment:
Students in private schools in grades 1 to 8 (elementary and middle school): 112
Here:
5.8%
California:
10.5%
Students in private schools in grades 9 to 12 (high school): 301
Here:
28.8%
California:
8.5%
Students in private undergraduate colleges: 63
Here:
7.8%
California:
15.9%
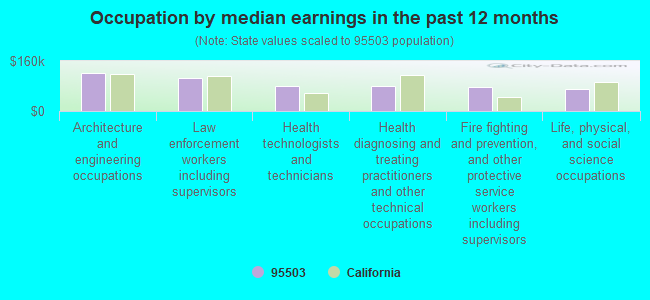
Occupation by median earnings in the past 12 months ($)
121,237Architecture and engineering occupations
105,208Law enforcement workers including supervisors
81,393Health technologists and technicians
81,045Health diagnosing and treating practitioners and other technical occupations
77,423Fire fighting and prevention, and other protective service workers including supervisors
71,040Life, physical, and social science occupations
Top industries in this zip code by the number of employees in 2005:
Health Care and Social Assistance: Offices of Physicians (except Mental Health Specialists) (50-99 employees: 1 establishment, 20-49 employees: 4 establishments, 10-19 employees: 3 establishments, 5-9 employees: 3 establishments, 1-4 employees: 2 establishments)
Construction: New Single-Family Housing Construction (except Operative Builders) (20-49: 2, 10-19: 1, 5-9: 4, 1-4: 19)
Health Care and Social Assistance: Services for the Elderly and Persons with Disabilities (50-99: 1, 20-49: 1, 10-19: 1)
Health Care and Social Assistance: Offices of Dentists (10-19: 1, 5-9: 8, 1-4: 7)
Information: Television Broadcasting (20-49: 2)
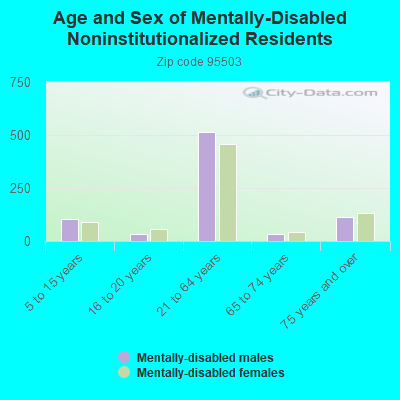
People in group quarters in 2010:
138 people in college/university student housing
130 people in nursing facilities/skilled-nursing facilities
100 people in group homes intended for adults
35 people in emergency and transitional shelters (with sleeping facilities) for people experiencing homelessness
32 people in workers' group living quarters and job corps centers
13 people in other noninstitutional facilities
5 people in group homes for juveniles (non-correctional)
5 people in residential treatment centers for juveniles (non-correctional)
People in group quarters in 2000:
143 people in other noninstitutional group quarters
137 people in college dormitories (includes college quarters off campus)
111 people in nursing homes
33 people in homes for the mentally retarded
17 people in homes for the mentally ill
6 people in schools, hospitals, or wards for the intellectually disabled
Fatal accident statistics in 2014:
Fatal accident count: 1
Vehicles involved in fatal accidents: 1
Fatal accidents caused by drunken drivers: 0
Fatalities: 1
Persons involved in fatal accidents: 1
Pedestrians involved in fatal accidents: 1
Fatal accident statistics in 2012:
Fatal accident count: 3
Vehicles involved in fatal accidents: 4
Fatal accidents caused by drunken drivers: 2
Fatalities: 3
Persons involved in fatal accidents: 7
Pedestrians involved in fatal accidents: 1
2002 - 2017 National Fire Incident Reporting System (NFIRS) incidents
Based on the data from the years 2002 - 2017 the average number of fires per year is 26. The highest number of reported fire incidents - 137 took place in 2005, and the least - 0 in 2003. The data has a decreasing trend.
When looking into fire subcategories, the most incidents belonged to: Structure Fires (51.2%), and Outside Fires (30.5%).
Fire incident types reported to NFIRS in Zip Code 95503
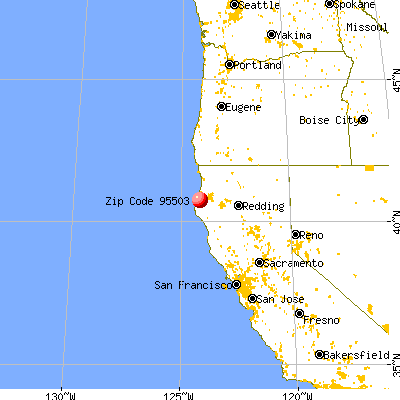


 Nearest zip codes: 95501, 95524, 95537, 95564, 95521, 95551.


 Based on the data from the years 2002 - 2017 the average number of fires per year is 26. The highest number of reported fire incidents - 137 took place in 2005, and the least - 0 in 2003. The data has a decreasing trend.
 When looking into fire subcategories, the most incidents belonged to: Structure Fires (51.2%), and Outside Fires (30.5%).