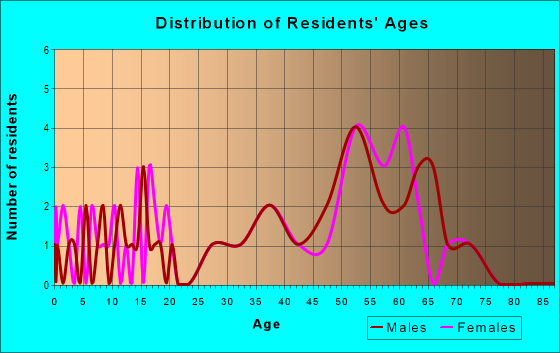
Estimated zip code population in 2022: 116 Zip code population in 2010: 267 Zip code population in 2000: 458
Houses and condos: 434 Renter-occupied apartments: 5
% of renters here:
10%
State:
37%
March 2022 cost of living index in zip code 97342: 90.1 (less than average, U.S. average is 100)
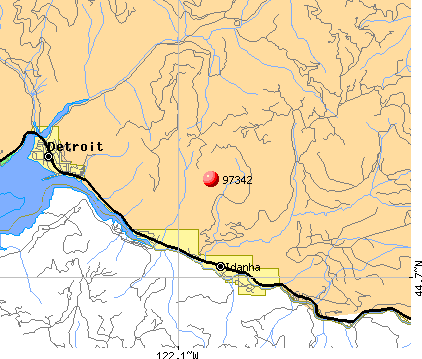
Land area: 56.1 sq. mi. Water area: 0.6 sq. mi.
Population density: 2 people per square mile
(very low).
OSM Map
General Map
Google Map
MSN Map
OSM Map
General Map
Google Map
MSN Map
OSM Map
General Map
Google Map
MSN Map
OSM Map
General Map
Google Map
MSN Map
Please wait while loading the map...
Real estate property taxes paid for housing units in 2022:
This zip code:
0.6% ($1,399)
Oregon:
0.8% ($3,646)
Median real estate property taxes paid for housing units with mortgages in 2022: $1,509 (0.4%) Median real estate property taxes paid for housing units with no mortgage in 2022: $1,291 (0.4%)
Business Search- 14 Million verified businesses
Males: 70
(60.4%)
Females: 46
(39.6%)
For population 25 years and over in 97342:
High school or higher: 93.7%
Bachelor's degree or higher: 25.7%
Graduate or professional degree: 2.2%
Mean travel time to work (commute): 37.2 minutes
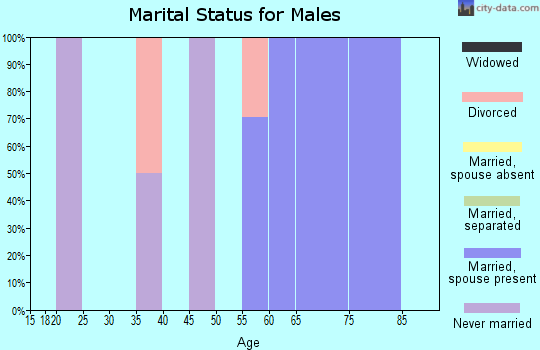
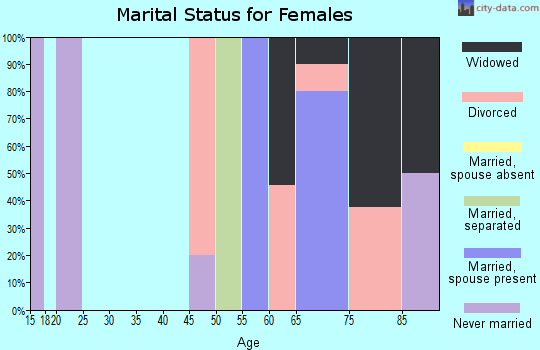
For population 15 years and over in 97342:
Never married: 8.2%
Now married: 59.7%
Separated: 3.2%
Widowed: 4.1%
Divorced: 24.8%
Zip code 97342 compared to state average:
Median house value below state average.
Unemployed percentage significantly below state average.
Black race population percentage significantly below state average.
Median age significantly above state average.
Foreign-born population percentage significantly below state average.
Renting percentage significantly below state average.
Length of stay since moving in significantly below state average.
Estimated median house/condo value in 2022: $247,299
97342:
$247,299
Oregon:
$475,600
Median resident age:
This zip code:
59.0 years
Oregon median age:
40.5 years
Average household size:
This zip code:
1.9 people
Oregon:
2.4 people
Averages for the 2004 tax year for zip code 97342, filed in 2005:
Average Adjusted Gross Income (AGI) in 2004: $28,783 (Individual Income Tax Returns)
Here:
$28,783
State:
$46,788
Salary/wage: $23,044 (reported on 86.0% of returns)
Here:
$23,044
State:
$39,788
(% of AGI for various income ranges: 92.8% for AGIs below $10k, 64.9% for AGIs $10k-25k, 71.8% for AGIs $25k-50k, 83.9% for AGIs $50k-75k, 53.2% for AGIs $75k-100k)
Taxable interest for individuals: $310 (reported on 26.8% of returns)
This zip code:
$310
Oregon:
$2,126
Taxable dividends: $588 (reported on 10.8% of returns)
Here:
$588
State:
$3,427
Profit/loss from business: +$1,385 (reported on 8.3% of returns)
Here:
+$1,385
State:
+$11,682
Total itemized deductions: $15,152 (27% of AGI, reported on 29.3% of returns)
Here:
$15,152
State:
$20,209
Here:
26.6% of AGI
State:
24.7% of AGI
(% of AGI for various income ranges: 20.3% for AGIs $10k-25k, 12.4% for AGIs $25k-50k, 14.6% for AGIs $50k-75k, 18.6% for AGIs $75k-100k)
Charity contributions deductions: $667 (1% of AGI, reported on 22.9% of returns)
Here:
$667
State:
$3,145
Here:
1.2% of AGI
State:
3.6% of AGI
Total tax: $3,218 (reported on 70.1% of returns)
97342:
$3,218
State:
$7,148
(% of AGI for various income ranges: 0.8% for AGIs below $10k, 3.8% for AGIs $10k-25k, 7.8% for AGIs $25k-50k, 10.2% for AGIs $50k-75k, 10.0% for AGIs $75k-100k)
Earned income credit: $1,314 (reported on 22.3% of returns)
Here:
$1,314
State:
$1,605
Percentage of individuals using paid preparers for their 2004 taxes: 45.9%
Here:
46%
State:
53%
(% for various income ranges: 32.5% for AGIs below $10k, 40.0% for AGIs $10k-25k, 79.4% for AGIs $25k-50k, 76.9% for AGIs $75k-100k)
Household received Food Stamps/SNAP in the past 12 months: 7 Household did not receive Food Stamps/SNAP in the past 12 months: 46
Women who did not have a birth in the past 12 months: 2 (0 now married, 2 unmarried)
Housing units in zip code 97342 with a mortgage: 26 Median monthly owner costs for units with a mortgage: $1,471 Median monthly owner costs for units without a mortgage: $439
Residents with income below the poverty level in 2022:
This zip code:
21.3%
Whole state:
12.1%
Residents with income below 50% of the poverty level in 2022:
This zip code:
8.4%
Whole state:
6.2%
Median number of rooms in houses and condos:
Here:
5.2
State:
6.2
Notable locations in this zip code not listed on our city pages
Lakes: Sprague Lake (A), Whitewater Lake (B), Swindle Lake (C), Slideout Lake (D), Scout Lake (E), Russell Lake (F), Rock Lake (G), Pyramid Lake (H). Display/hide their locations on the map
Rivers and creeks: Lake Creek (A), Jeff Creek (B), Mill Creek (C), Devils Creek (D), North Fork Breitenbush River (E), Cascade Creek (F), Crag Creek (G), Roaring Creek (H), Russell Creek (I). Display/hide their locations on the map
In group quarters: 14 (-1 institutionalized population)
Size of family households: 21 2-persons, 2 3-persons, 3 6-persons
Size of nonfamily households: 27 1-person
17 married couples with children.
0 single-parent households ().
88.8% of residents of 97342 zip code speak English at home.
12.1% of residents speak Spanish at home (100% very well).
Foreign born population: 0 (0.0%)
:
0.0%
Whole state:
9.9%
30%English
18%Irish
11%German
5%Swedish
2%European
Facilities with environmental interests located in this zip code:
DETROIT LAKES CHARTER SCHOOL (345 SANTIAM AVE in DETROIT, OR)
(National Center for Education Statistics) - STATE ID-3246 Organizations: SANTIAM CANYON SCH DIST 129J (SCHOOL DISTRICT)
BIG CLIFF DAM (N SANTIAM RIVER in DETROIT, OR)
COMPLIANCE ACTIVITY (Tracking inspections of insecticide, fungicide, and rodenticide, and toxic substances)
DETROIT DAM (N SANTIAM RIVER STREAM MILE 60.8 in DETROIT, OR)
COMPLIANCE ACTIVITY (Tracking inspections of insecticide, fungicide, and rodenticide, and toxic substances)
Housing units lacking complete plumbing facilities: 11.6% Housing units lacking complete kitchen facilities: 12.8%
64.0%Electricity
17.4%Wood
13.6%Bottled, tank, or LP gas
7.8%Utility gas
Population in 1990: 589.
Place of birth for U.S.-born residents:
This state: 53
Northeast: 1
Midwest: 33
South: 3
West: 23
46% of the 97342 zip code residents lived in the same house 5 years ago. Out of people who lived in different houses, 52% lived in this county. Out of people who lived in different counties, 50% lived in Oregon.
68% of the 97342 zip code residents lived in the same house 1 year ago. Out of people who lived in different houses, 32% moved from this county. Out of people who lived in different houses, 55% moved from different county within same state. Out of people who lived in different houses, 6% moved from different state.
Private vs. public school enrollment:
Students in private schools in grades 1 to 8 (elementary and middle school):
Here:
0.0%
Oregon:
13.7%
Students in private schools in grades 9 to 12 (high school):
Here:
0.0%
Oregon:
8.8%
Students in private undergraduate colleges:
Here:
0.0%
Oregon:
17.7%
Top industries in this zip code by the number of employees in 2005:
Accommodation and Food Services: Recreational and Vacation Camps (except Campgrounds) (50-99 employees: 1 establishment)
Accommodation and Food Services: Full-Service Restaurants (5-9: 2)
Arts, Entertainment, and Recreation: Marinas (1-4: 2)
Construction: Site Preparation Contractors (1-4: 1)
Real Estate and Rental and Leasing: Residential Property Managers (1-4: 1)
Other Services (except Public Administration): Religious Organizations (1-4: 1)
People in group quarters in 2000:
44 people in other group homes
Home Mortgage Disclosure Act Aggregated Statistics For Year 2009 (Based on 2 partial tracts)
A) FHA, FSA/RHS & VA Home Purchase Loans
B) Conventional Home Purchase Loans
C) Refinancings
D) Home Improvement Loans
F) Non-occupant Loans on < 5 Family Dwellings (A B C & D)
G) Loans On Manufactured Home Dwelling (A B C & D)
Number
Average Value
Number
Average Value
Number
Average Value
Number
Average Value
Number
Average Value
Number
Average Value
LOANS ORIGINATED
1
$279,220
3
$186,373
16
$191,436
1
$33,930
5
$199,540
3
$146,120
APPLICATIONS APPROVED, NOT ACCEPTED
0
$0
1
$157,580
1
$174,100
0
$0
1
$164,940
0
$0
APPLICATIONS DENIED
1
$173,870
2
$180,680
7
$176,360
1
$86,820
2
$167,735
2
$86,825
APPLICATIONS WITHDRAWN
0
$0
1
$210,480
5
$170,838
0
$0
1
$181,240
2
$132,025
FILES CLOSED FOR INCOMPLETENESS
0
$0
0
$0
1
$223,420
0
$0
0
$0
0
$0
Aggregated Statistics For Year 2008 (Based on 2 partial tracts)
A) FHA, FSA/RHS & VA Home Purchase Loans
B) Conventional Home Purchase Loans
C) Refinancings
D) Home Improvement Loans
F) Non-occupant Loans on < 5 Family Dwellings (A B C & D)
G) Loans On Manufactured Home Dwelling (A B C & D)
Number
Average Value
Number
Average Value
Number
Average Value
Number
Average Value
Number
Average Value
Number
Average Value
LOANS ORIGINATED
2
$144,185
3
$183,173
13
$192,467
1
$181,910
5
$186,238
3
$198,350
APPLICATIONS APPROVED, NOT ACCEPTED
0
$0
2
$95,420
3
$194,110
0
$0
2
$83,700
1
$150,880
APPLICATIONS DENIED
1
$170,520
2
$76,445
9
$162,019
2
$149,545
2
$134,145
2
$231,010
APPLICATIONS WITHDRAWN
0
$0
0
$0
4
$214,272
0
$0
1
$143,290
2
$193,740
FILES CLOSED FOR INCOMPLETENESS
0
$0
0
$0
1
$139,720
1
$73,210
0
$0
0
$0
Aggregated Statistics For Year 2007 (Based on 2 partial tracts)
A) FHA, FSA/RHS & VA Home Purchase Loans
B) Conventional Home Purchase Loans
C) Refinancings
D) Home Improvement Loans
F) Non-occupant Loans on < 5 Family Dwellings (A B C & D)
G) Loans On Manufactured Home Dwelling (A B C & D)
Number
Average Value
Number
Average Value
Number
Average Value
Number
Average Value
Number
Average Value
Number
Average Value
LOANS ORIGINATED
1
$146,200
8
$191,339
13
$159,022
3
$93,073
5
$166,060
4
$138,662
APPLICATIONS APPROVED, NOT ACCEPTED
0
$0
2
$115,840
2
$125,325
0
$0
1
$145,970
0
$0
APPLICATIONS DENIED
0
$0
2
$229,340
8
$173,091
3
$93,893
1
$207,800
4
$108,195
APPLICATIONS WITHDRAWN
0
$0
1
$164,050
4
$143,295
1
$99,550
1
$165,390
1
$95,310
FILES CLOSED FOR INCOMPLETENESS
0
$0
0
$0
1
$173,870
0
$0
0
$0
0
$0
Aggregated Statistics For Year 2006 (Based on 2 partial tracts)
A) FHA, FSA/RHS & VA Home Purchase Loans
B) Conventional Home Purchase Loans
C) Refinancings
D) Home Improvement Loans
F) Non-occupant Loans on < 5 Family Dwellings (A B C & D)
G) Loans On Manufactured Home Dwelling (A B C & D)
Number
Average Value
Number
Average Value
Number
Average Value
Number
Average Value
Number
Average Value
Number
Average Value
LOANS ORIGINATED
1
$75,660
12
$144,522
12
$158,602
2
$42,965
5
$146,688
2
$130,795
APPLICATIONS APPROVED, NOT ACCEPTED
0
$0
1
$177,670
4
$137,158
0
$0
0
$0
1
$87,720
APPLICATIONS DENIED
1
$97,320
6
$120,565
12
$136,040
4
$73,042
1
$175,660
3
$126,777
APPLICATIONS WITHDRAWN
0
$0
2
$143,630
4
$155,235
1
$77,230
2
$98,095
1
$111,380
FILES CLOSED FOR INCOMPLETENESS
0
$0
0
$0
2
$141,955
0
$0
0
$0
0
$0
Aggregated Statistics For Year 2005 (Based on 2 partial tracts)
A) FHA, FSA/RHS & VA Home Purchase Loans
B) Conventional Home Purchase Loans
C) Refinancings
D) Home Improvement Loans
F) Non-occupant Loans on < 5 Family Dwellings (A B C & D)
G) Loans On Manufactured Home Dwelling (A B C & D)
Number
Average Value
Number
Average Value
Number
Average Value
Number
Average Value
Number
Average Value
Number
Average Value
LOANS ORIGINATED
1
$168,960
13
$102,071
13
$113,557
2
$74,885
7
$104,681
3
$128,563
APPLICATIONS APPROVED, NOT ACCEPTED
1
$168,290
2
$115,060
1
$136,600
0
$0
1
$151,330
1
$127,670
APPLICATIONS DENIED
2
$109,035
3
$120,827
15
$131,658
2
$26,340
2
$130,570
3
$124,993
APPLICATIONS WITHDRAWN
0
$0
3
$137,343
7
$148,269
1
$110,480
1
$76,110
1
$183,920
FILES CLOSED FOR INCOMPLETENESS
0
$0
0
$0
2
$106,690
0
$0
1
$81,020
0
$0
Aggregated Statistics For Year 2004 (Based on 2 partial tracts)
A) FHA, FSA/RHS & VA Home Purchase Loans
B) Conventional Home Purchase Loans
C) Refinancings
D) Home Improvement Loans
F) Non-occupant Loans on < 5 Family Dwellings (A B C & D)
G) Loans On Manufactured Home Dwelling (A B C & D)
Number
Average Value
Number
Average Value
Number
Average Value
Number
Average Value
Number
Average Value
Number
Average Value
LOANS ORIGINATED
1
$122,980
8
$131,520
11
$128,116
0
$0
3
$115,247
3
$103,563
APPLICATIONS APPROVED, NOT ACCEPTED
0
$0
1
$158,700
3
$141,360
0
$0
0
$0
1
$168,290
APPLICATIONS DENIED
0
$0
2
$121,200
14
$121,325
2
$38,615
3
$84,740
4
$105,295
APPLICATIONS WITHDRAWN
0
$0
2
$105,240
7
$132,166
0
$0
0
$0
1
$217,620
FILES CLOSED FOR INCOMPLETENESS
0
$0
0
$0
2
$175,545
0
$0
0
$0
0
$0
Aggregated Statistics For Year 2003 (Based on 2 partial tracts)
A) FHA, FSA/RHS & VA Home Purchase Loans
B) Conventional Home Purchase Loans
C) Refinancings
D) Home Improvement Loans
F) Non-occupant Loans on < 5 Family Dwellings (A B C & D)
Number
Average Value
Number
Average Value
Number
Average Value
Number
Average Value
Number
Average Value
LOANS ORIGINATED
1
$142,400
8
$133,139
29
$113,963
1
$18,080
6
$122,947
APPLICATIONS APPROVED, NOT ACCEPTED
0
$0
1
$110,710
4
$123,932
0
$0
0
$0
APPLICATIONS DENIED
0
$0
2
$122,425
17
$107,766
1
$65,840
2
$157,690
APPLICATIONS WITHDRAWN
0
$0
1
$103,120
7
$124,259
0
$0
1
$25,000
FILES CLOSED FOR INCOMPLETENESS
0
$0
0
$0
2
$84,480
0
$0
0
$0
Aggregated Statistics For Year 2002 (Based on 2 partial tracts)
A) FHA, FSA/RHS & VA Home Purchase Loans
B) Conventional Home Purchase Loans
C) Refinancings
D) Home Improvement Loans
F) Non-occupant Loans on < 5 Family Dwellings (A B C & D)
Number
Average Value
Number
Average Value
Number
Average Value
Number
Average Value
Number
Average Value
LOANS ORIGINATED
1
$169,630
6
$112,790
23
$121,246
1
$17,860
4
$127,112
APPLICATIONS APPROVED, NOT ACCEPTED
0
$0
4
$94,915
3
$104,310
0
$0
2
$59,820
APPLICATIONS DENIED
0
$0
2
$87,720
7
$106,753
2
$10,380
0
$0
APPLICATIONS WITHDRAWN
0
$0
1
$182,350
3
$139,573
0
$0
0
$0
FILES CLOSED FOR INCOMPLETENESS
0
$0
0
$0
1
$58,920
0
$0
0
$0
Aggregated Statistics For Year 2001 (Based on 2 partial tracts)
A) FHA, FSA/RHS & VA Home Purchase Loans
B) Conventional Home Purchase Loans
C) Refinancings
D) Home Improvement Loans
F) Non-occupant Loans on < 5 Family Dwellings (A B C & D)
Number
Average Value
Number
Average Value
Number
Average Value
Number
Average Value
Number
Average Value
LOANS ORIGINATED
1
$164,720
7
$107,901
15
$111,243
1
$49,550
3
$93,743
APPLICATIONS APPROVED, NOT ACCEPTED
0
$0
0
$0
2
$99,880
0
$0
0
$0
APPLICATIONS DENIED
0
$0
2
$78,120
5
$101,422
1
$12,950
0
$0
APPLICATIONS WITHDRAWN
0
$0
1
$70,310
6
$91,028
0
$0
1
$34,820
FILES CLOSED FOR INCOMPLETENESS
0
$0
0
$0
1
$78,120
0
$0
0
$0
Aggregated Statistics For Year 2000 (Based on 2 partial tracts)
A) FHA, FSA/RHS & VA Home Purchase Loans
B) Conventional Home Purchase Loans
C) Refinancings
D) Home Improvement Loans
F) Non-occupant Loans on < 5 Family Dwellings (A B C & D)
Number
Average Value
Number
Average Value
Number
Average Value
Number
Average Value
Number
Average Value
LOANS ORIGINATED
2
$86,380
5
$125,394
8
$92,879
2
$20,760
2
$57,475
APPLICATIONS APPROVED, NOT ACCEPTED
0
$0
0
$0
2
$76,670
1
$14,280
0
$0
APPLICATIONS DENIED
1
$61,600
2
$70,530
5
$73,210
1
$28,120
0
$0
APPLICATIONS WITHDRAWN
0
$0
1
$101,560
3
$85,710
0
$0
0
$0
FILES CLOSED FOR INCOMPLETENESS
0
$0
0
$0
2
$50,330
0
$0
0
$0
Aggregated Statistics For Year 1999 (Based on 1 partial tract)
B) Conventional Home Purchase Loans
C) Refinancings
D) Home Improvement Loans
F) Non-occupant Loans on < 5 Family Dwellings (A B C & D)


 Nearest zip codes: 97350, 97759, 97730, 97346, 97358, 97028.