Estimated zip code population in 2022: 324 Zip code population in 2010: 323 Zip code population in 2000: 318
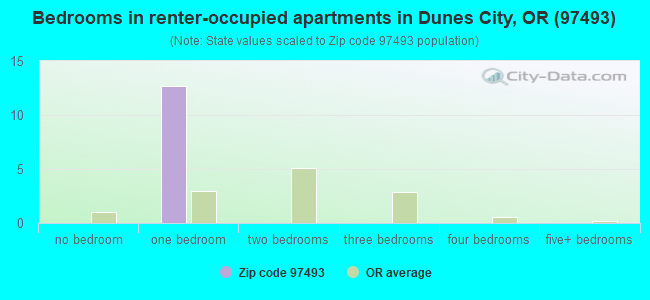
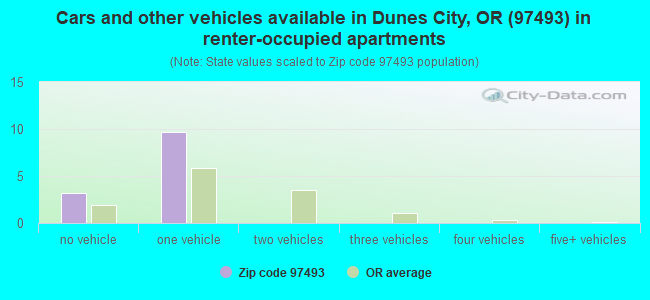
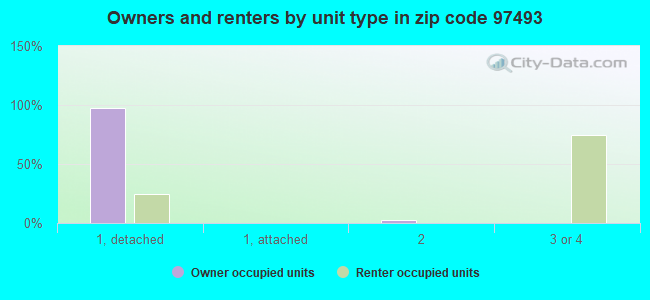
Houses and condos: 199 Renter-occupied apartments: 12
% of renters here:
9%
State:
37%
March 2022 cost of living index in zip code 97493: 89.4 (less than average, U.S. average is 100)
Land area: 54.6 sq. mi. Water area: 4.6 sq. mi.
Population density: 6 people per square mile
(very low).
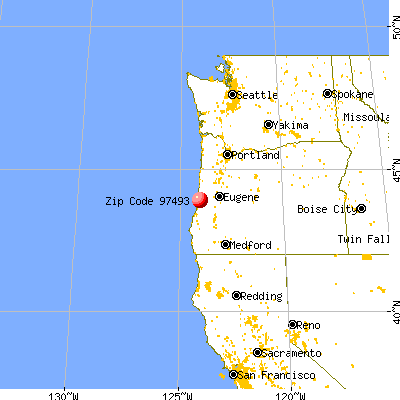
OSM Map
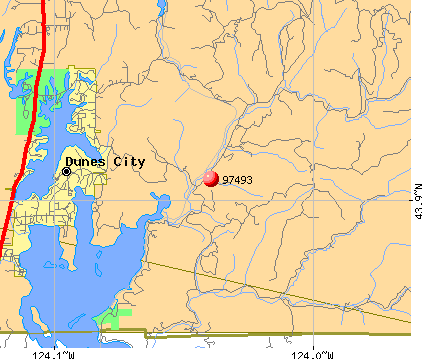
General Map
Google Map
MSN Map
OSM Map
General Map
Google Map
MSN Map
OSM Map
General Map
Google Map
MSN Map
OSM Map
General Map
Google Map
MSN Map
Please wait while loading the map...
Real estate property taxes paid for housing units in 2022:
This zip code:
0.5% ($2,651)
Oregon:
0.8% ($3,646)
Median real estate property taxes paid for housing units with mortgages in 2022: $3,130 (0.5%) Median real estate property taxes paid for housing units with no mortgage in 2022: $2,581 (0.4%)
Averages for the 2020 tax year for zip code 97493, filed in 2021:
Average Adjusted Gross Income (AGI) in 2020: $57,040 (Individual Income Tax Returns)
Here:
$57,040
State:
$76,001
Salary/wage: $42,153 (reported on 60.0% of returns)
Here:
$42,153
State:
$61,959
(% of AGI for various income ranges: 828.0% for AGIs below $25k, 2693.3% for AGIs $25k-50k)
Taxable interest for individuals: $922 (reported on 36.0% of returns)
This zip code:
$922
Oregon:
$1,628
(% of AGI for various income ranges: 60.0% for AGIs below $25k, 11.7% for AGIs $25k-50k)
Ordinary dividends: $2,725 (reported on 16.0% of returns)
Here:
$2,725
State:
$7,165
(% of AGI for various income ranges: 72.0% for AGIs below $25k, 243.3% for AGIs $75k-100k)
Net capital gain/loss in AGI: +$15,825 (reported on 16.0% of returns)
Here:
+$15,825
State:
+$23,403
(% of AGI for various income ranges: 142.0% for AGIs below $25k, 1873.3% for AGIs $75k-100k)
Profit/loss from business: +$10,050 (reported on 16.0% of returns)
Here:
+$10,050
State:
+$16,511
(% of AGI for various income ranges: 670.0% for AGIs $25k-50k)
Taxable individual retirement arrangement distribution: $12,380 (reported on 20.0% of returns)
97493:
$12,380
Oregon:
$20,730
(% of AGI for various income ranges: 544.0% for AGIs below $25k, 1156.7% for AGIs $75k-100k)
Earned income credit: $933 (reported on 12.0% of returns)
Here:
$933
State:
$1,977
(% of AGI for various income ranges: 56.0% for AGIs below $25k)
Percentage of individuals using paid preparers for their 2020 taxes: 96.0%
Here:
96%
State:
93%
(% for various income ranges: 88.9% for AGIs below $25k, 100.0% for AGIs $25k-50k, 100.0% for AGIs $50k-75k, 100.0% for AGIs $75k-100k, 100.0% for AGIs $100k-200k)
Averages for the 2012 tax year for zip code 97493, filed in 2013:
Average Adjusted Gross Income (AGI) in 2012: $48,985 (Individual Income Tax Returns)
Here:
$48,985
State:
$57,845
Salary/wage: $31,662 (reported on 65.0% of returns)
Here:
$31,662
State:
$47,723
(% of AGI for various income ranges: 55.1% for AGIs below $25k, 47.1% for AGIs $25k-50k, 60.7% for AGIs $50k-75k, 31.9% for AGIs $75k-100k)
Taxable interest for individuals: $1,178 (reported on 45.0% of returns)
This zip code:
$1,178
Oregon:
$1,848
(% of AGI for various income ranges: 1.5% for AGIs below $25k, 0.9% for AGIs $25k-50k, 1.4% for AGIs $75k-100k)
Ordinary dividends: $1,180 (reported on 25.0% of returns)
Here:
$1,180
State:
$5,987
Profit/loss from business: +$7,833 (reported on 15.0% of returns)
Here:
+$7,833
State:
+$13,871
Taxable individual retirement arrangement distribution: $6,267 (reported on 15.0% of returns)
97493:
$6,267
Oregon:
$16,036
Total itemized deductions: $17,762 (27% of AGI, reported on 40.0% of returns)
Here:
$17,762
State:
$24,430
Here:
26.5% of AGI
State:
23.2% of AGI
Charity contributions: $1,767 (reported on 30.0% of returns)
Here:
$1,767
State:
$3,648
Taxes paid: $5,975 (reported on 40.0% of returns)
97493:
$5,975
State:
$10,269
Earned income credit: $1,900 (reported on 15.0% of returns)
Here:
$1,900
State:
$2,021
(% of AGI for various income ranges: 5.3% for AGIs below $25k)
Percentage of individuals using paid preparers for their 2012 taxes: 60.0%
Here:
60%
State:
47%
(% for various income ranges: 55.6% for AGIs below $25k, 100.0% for AGIs $25k-50k, 75.0% for AGIs $75k-100k)
Averages for the 2004 tax year for zip code 97493, filed in 2005:
Average Adjusted Gross Income (AGI) in 2004: $38,671 (Individual Income Tax Returns)
Here:
$38,671
State:
$46,788
Salary/wage: $30,901 (reported on 63.5% of returns)
Here:
$30,901
State:
$39,788
(% of AGI for various income ranges: 84.2% for AGIs below $10k, 63.3% for AGIs $10k-25k, 54.2% for AGIs $25k-50k, 34.8% for AGIs $50k-75k)
Taxable interest for individuals: $2,561 (reported on 51.4% of returns)
This zip code:
$2,561
Oregon:
$2,126
(% of AGI for various income ranges: 1.0% for AGIs below $10k, 4.4% for AGIs $10k-25k, 5.1% for AGIs $25k-50k, 2.9% for AGIs $50k-75k)
Taxable dividends: $1,545 (reported on 29.7% of returns)
Here:
$1,545
State:
$3,427
Net capital gain/loss: +$8,509 (reported on 25.7% of returns)
Here:
+$8,509
State:
+$12,447
(% of AGI for various income ranges: 1.0% for AGIs below $10k, 4.3% for AGIs $25k-50k, 0.5% for AGIs $50k-75k)
Profit/loss from business: +$2,611 (reported on 16.2% of returns)
Here:
+$2,611
State:
+$11,682
Total itemized deductions: $16,746 (24% of AGI, reported on 30.2% of returns)
Here:
$16,746
State:
$20,209
Here:
24.3% of AGI
State:
24.7% of AGI
(% of AGI for various income ranges: 13.5% for AGIs $10k-25k, 10.6% for AGIs $25k-50k, 12.0% for AGIs $50k-75k)
Charity contributions deductions: $1,714 (2% of AGI, reported on 22.1% of returns)
Here:
$1,714
State:
$3,145
Here:
2.3% of AGI
State:
3.6% of AGI
Total tax: $4,793 (reported on 73.9% of returns)
97493:
$4,793
State:
$7,148
(% of AGI for various income ranges: 3.5% for AGIs below $10k, 3.3% for AGIs $10k-25k, 6.2% for AGIs $25k-50k, 9.9% for AGIs $50k-75k, 13.8% for AGIs over 100k)
Earned income credit: $1,500 (reported on 16.2% of returns)
Here:
$1,500
State:
$1,605
Percentage of individuals using paid preparers for their 2004 taxes: 62.6%
Here:
63%
State:
53%
(% for various income ranges: 36.7% for AGIs below $10k, 72.9% for AGIs $10k-25k, 64.6% for AGIs $25k-50k, 58.1% for AGIs $50k-75k)
Household received Food Stamps/SNAP in the past 12 months: 9 Household did not receive Food Stamps/SNAP in the past 12 months: 135
Women who did not have a birth in the past 12 months: 6 (0 now married, 6 unmarried)
Housing units in zip code 97493 with a mortgage: 16 Median monthly owner costs for units with a mortgage: $3,924 Median monthly owner costs for units without a mortgage: $473
Residents with income below the poverty level in 2022:
This zip code:
9.1%
Whole state:
12.1%
Residents with income below 50% of the poverty level in 2022:
This zip code:
9.1%
Whole state:
6.2%
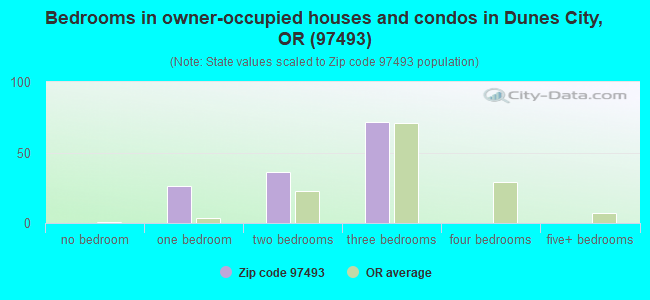
Median number of rooms in houses and condos:
Here:
5.6
State:
6.2
Notable locations in this zip code not listed on our city pages
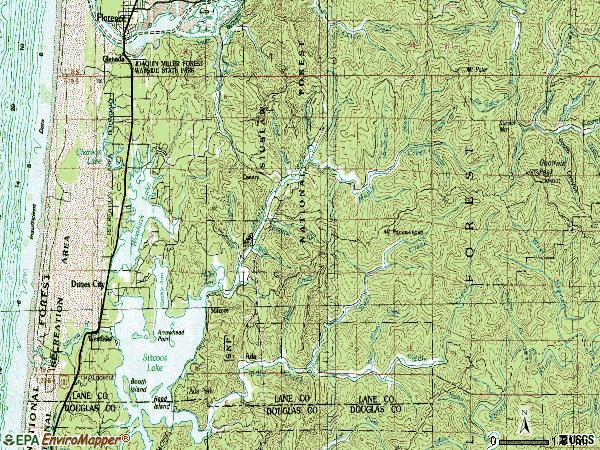
Notable locations in zip code 97493: Carter Lake Recreation Site (A), Oregon Dunes Recreation Site (B), Carter Lake Boat Ramp (C), Lodgepole Recreation Site (D), Crown Zellerback Campground (E), Tyee Recreation Site (F), Siltcoos Recreation Site (G), Siltcoos Lookout (H), Waxmyrtle Recreation Site (I), Siltcoos Lake Resort Boat Ramp (J), Westlake Resort Boat Ramp (K), Tyee Campground Boat Ramp (L), Nightingale's Fish Camp Boat Ramp (M), East Cater Boat Ramp (N), Fishmill Lodges and RV Park Boat Ramp (O), Ada Station (P), Ada County Park Boat Ramp (Q), Siuslaw Valley Fire and Rescue Station 5 Canary Station (R), Siuslaw Valley Fire and Rescue Station 6 Ada Station (S), Westlake - Dunes City City Hall (T). Display/hide their locations on the map
Lakes and reservoirs: Georgia Lake (A), Perkins Lake (B), Lost Lake (C), Crown Z Lake (D), Loon Lake (E), Carter Lake (F), Siltcoos Lake (G), Erhart Lake (H). Display/hide their locations on the map
Rivers and creeks: Deer Creek (A), Jordan Creek (B), Buckwheat Creek (C), Henderson Creek (D), Grant Creek (E), Fiddle Creek (F), North Prong Maple Creek (G), Carter Creek (H), Carle Creek (I). Display/hide their locations on the map
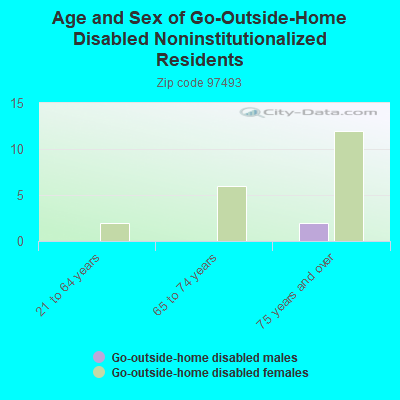
In group quarters: 6 (-1 institutionalized population)
Size of family households: 53 2-persons, 11 3-persons, 3 4-persons, 8 5-persons
Size of nonfamily households: 30 1-person, 42 2-persons
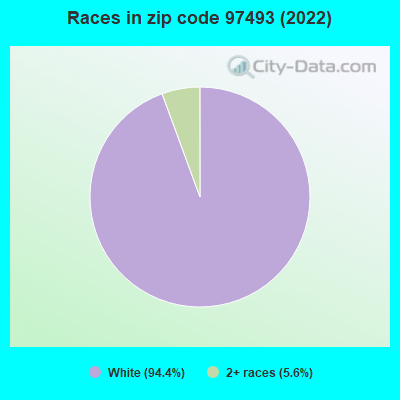
102.5% of residents of 97493 zip code speak English at home.
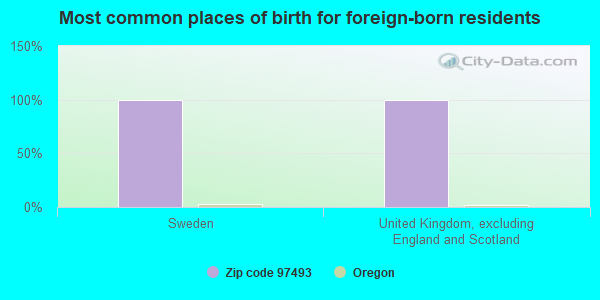
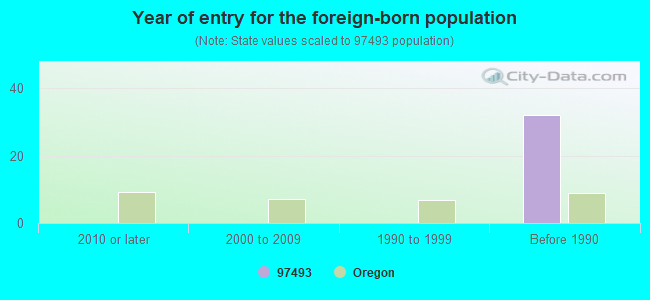
Foreign born population: 7 (2.5%) (100.0% of them are naturalized citizens)
This zip code:
2.5%
Whole state:
9.9%
100%Sweden
100%United Kingdom, excluding England and Scotland
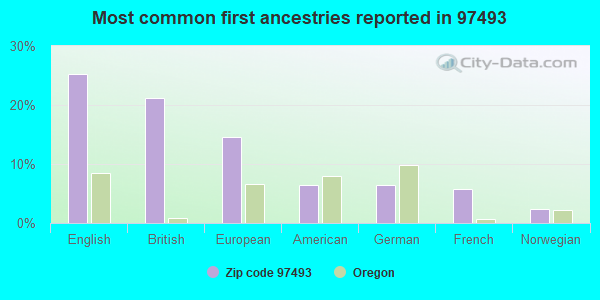
25%English
21%British
15%European
7%American
7%German
6%French
2%Norwegian
Year of entry for the foreign-born population
02010 or later
02000 to 2009
01990 to 1999
32Before 1990
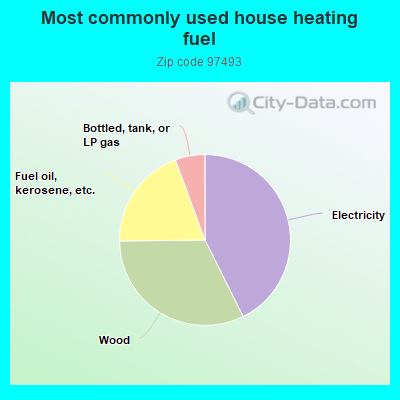
43.2%Electricity
32.6%Wood
19.8%Fuel oil, kerosene, etc.
5.7%Bottled, tank, or LP gas
Population in 1990: 272. Population change in the 1990s: +46 (+16.9%).
Place of birth for U.S.-born residents:
This state: 126
Midwest: 28
South: 33
West: 101
60% of the 97493 zip code residents lived in the same house 5 years ago. Out of people who lived in different houses, 20% lived in this county. Out of people who lived in different counties, 50% lived in Oregon.
92% of the 97493 zip code residents lived in the same house 1 year ago. Out of people who lived in different houses, 35% moved from this county. Out of people who lived in different houses, 22% moved from different county within same state. Out of people who lived in different houses, 43% moved from different state.
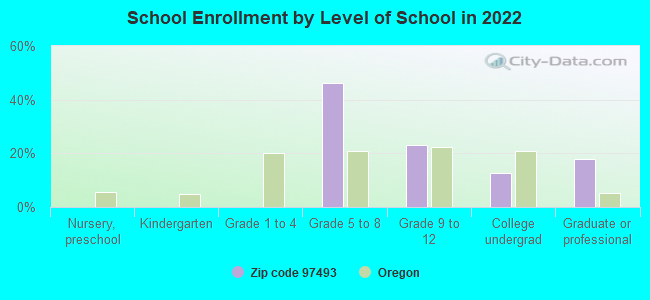
Private vs. public school enrollment:
Students in private schools in grades 1 to 8 (elementary and middle school):
Here:
0.0%
Oregon:
13.7%
Students in private schools in grades 9 to 12 (high school):
Here:
0.0%
Oregon:
8.8%
Students in private undergraduate colleges:
Here:
0.0%
Oregon:
17.7%
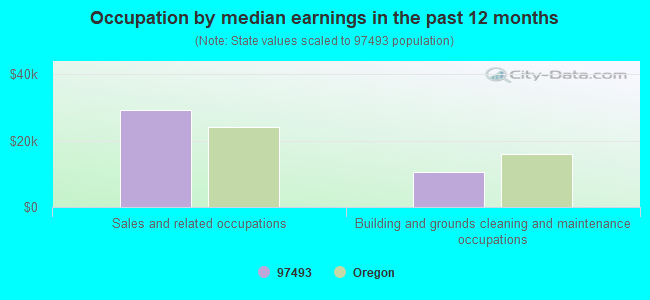
Occupation by median earnings in the past 12 months ($)
29,324Sales and related occupations
10,588Building and grounds cleaning and maintenance occupations
Companies with federal contracts located in this zip code:
EVANOW, JOHN K (05720 CANNARY RD in WESTLAKE, OR; small business) : $31,796 in 3 contractsfrom 2002 to 2004
$21,296 with U.S. Army Corps of Engineers - civil program financing only for Other Natural Resources and Conservation Services. Taking place in WA. Signed on 2002-10-30. Completion date: 2002-11-14.
$5,250 with Army for Seeds and Nursery Stock. Taking place in WA. Signed on 2004-03-04. Completion date: 2004-03-12.
$5,250 with U.S. Army Corps of Engineers - civil program financing only for Seeds and Nursery Stock. Taking place in WA. Signed on 2004-03-04. Completion date: 2004-03-12.
Top industries in this zip code by the number of employees in 2005:
Construction: New Single-Family Housing Construction (except Operative Builders) (1-4 employees: 3 establishments)
Professional, Scientific, and Technical Services: Research and Development in the Physical, Engineering, and Life Sciences (1-4: 1)
Construction: Roofing Contractors (1-4: 1)
Construction: Electrical Contractors (1-4: 1)
People in group quarters in 2010:
3 people in group homes intended for adults
Fatal accident statistics in 2013:
Fatal accident count: 1
Vehicles involved in fatal accidents: 2
Fatal accidents caused by drunken drivers: 0
Fatalities: 1
Persons involved in fatal accidents: 6
Pedestrians involved in fatal accidents: 0
Fatal accident statistics in 2010:
Fatal accident count: 1
Vehicles involved in fatal accidents: 1
Fatal accidents caused by drunken drivers: 1
Fatalities: 2
Persons involved in fatal accidents: 3
Pedestrians involved in fatal accidents: 0
Home Mortgage Disclosure Act Aggregated Statistics For Year 2009 (Based on 8 partial tracts)
A) FHA, FSA/RHS & VA Home Purchase Loans
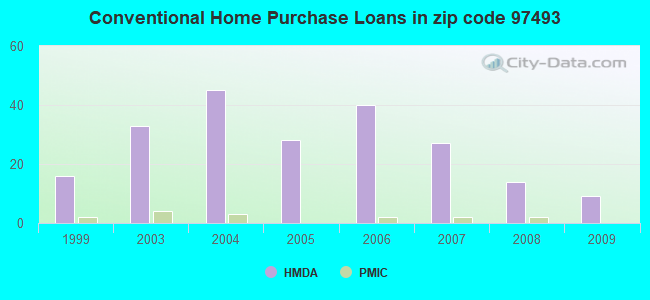
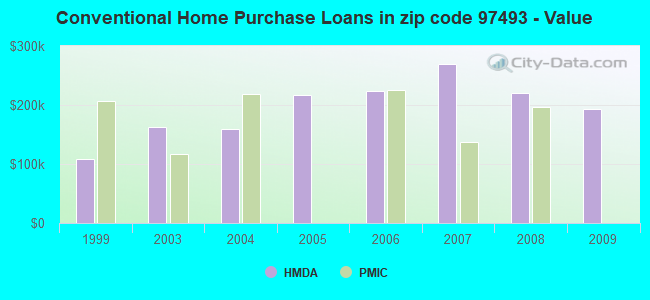
B) Conventional Home Purchase Loans
C) Refinancings
D) Home Improvement Loans
F) Non-occupant Loans on < 5 Family Dwellings (A B C & D)
G) Loans On Manufactured Home Dwelling (A B C & D)
Number
Average Value
Number
Average Value
Number
Average Value
Number
Average Value
Number
Average Value
Number
Average Value
LOANS ORIGINATED
2
$194,515
9
$193,751
63
$217,064
1
$198,440
10
$256,013
13
$146,226
APPLICATIONS APPROVED, NOT ACCEPTED
0
$0
0
$0
4
$250,758
1
$26,520
0
$0
0
$0
APPLICATIONS DENIED
0
$0
3
$320,917
44
$228,028
4
$116,170
5
$241,080
11
$172,455
APPLICATIONS WITHDRAWN
1
$159,150
1
$235,780
16
$237,004
0
$0
2
$130,170
4
$219,812
FILES CLOSED FOR INCOMPLETENESS
0
$0
0
$0
2
$347,280
1
$98,240
0
$0
0
$0
Aggregated Statistics For Year 2008 (Based on 8 partial tracts)
A) FHA, FSA/RHS & VA Home Purchase Loans
B) Conventional Home Purchase Loans
C) Refinancings
D) Home Improvement Loans
F) Non-occupant Loans on < 5 Family Dwellings (A B C & D)
G) Loans On Manufactured Home Dwelling (A B C & D)
Number
Average Value
Number
Average Value
Number
Average Value
Number
Average Value
Number
Average Value
Number
Average Value
LOANS ORIGINATED
1
$288,830
14
$220,900
31
$208,491
4
$100,695
15
$204,929
10
$147,753
APPLICATIONS APPROVED, NOT ACCEPTED
0
$0
4
$344,822
10
$247,172
2
$75,155
2
$257,880
2
$101,185
APPLICATIONS DENIED
1
$292,760
3
$196,480
30
$218,846
8
$201,884
8
$208,146
5
$121,424
APPLICATIONS WITHDRAWN
0
$0
0
$0
14
$325,034
2
$223,495
3
$371,347
1
$149,320
FILES CLOSED FOR INCOMPLETENESS
0
$0
0
$0
2
$217,600
1
$49,120
0
$0
1
$175,850
Aggregated Statistics For Year 2007 (Based on 8 partial tracts)
A) FHA, FSA/RHS & VA Home Purchase Loans
B) Conventional Home Purchase Loans
C) Refinancings
D) Home Improvement Loans
F) Non-occupant Loans on < 5 Family Dwellings (A B C & D)
G) Loans On Manufactured Home Dwelling (A B C & D)
Number
Average Value
Number
Average Value
Number
Average Value
Number
Average Value
Number
Average Value
Number
Average Value
LOANS ORIGINATED
0
$0
27
$269,469
51
$232,366
8
$101,555
13
$253,912
17
$184,518
APPLICATIONS APPROVED, NOT ACCEPTED
0
$0
5
$200,606
9
$243,853
2
$127,710
2
$117,395
7
$213,321
APPLICATIONS DENIED
3
$235,777
12
$223,087
36
$241,288
3
$145,397
6
$305,035
12
$227,753
APPLICATIONS WITHDRAWN
1
$151,290
5
$296,882
17
$249,067
1
$54,030
1
$77,610
3
$178,143
FILES CLOSED FOR INCOMPLETENESS
0
$0
0
$0
4
$223,005
0
$0
0
$0
0
$0
Aggregated Statistics For Year 2006 (Based on 8 partial tracts)
B) Conventional Home Purchase Loans
C) Refinancings
D) Home Improvement Loans
F) Non-occupant Loans on < 5 Family Dwellings (A B C & D)
G) Loans On Manufactured Home Dwelling (A B C & D)
Number
Average Value
Number
Average Value
Number
Average Value
Number
Average Value
Number
Average Value
LOANS ORIGINATED
40
$224,380
48
$252,436
14
$39,506
28
$198,725
16
$140,974
APPLICATIONS APPROVED, NOT ACCEPTED
14
$152,763
11
$202,106
3
$134,260
7
$207,427
4
$202,375
APPLICATIONS DENIED
12
$245,109
25
$253,341
10
$65,231
10
$213,574
14
$193,111
APPLICATIONS WITHDRAWN
8
$181,621
21
$182,492
0
$0
4
$143,430
1
$229,880
FILES CLOSED FOR INCOMPLETENESS
0
$0
4
$184,200
1
$29,470
0
$0
0
$0
Aggregated Statistics For Year 2005 (Based on 8 partial tracts)
A) FHA, FSA/RHS & VA Home Purchase Loans
B) Conventional Home Purchase Loans
C) Refinancings
D) Home Improvement Loans
F) Non-occupant Loans on < 5 Family Dwellings (A B C & D)
G) Loans On Manufactured Home Dwelling (A B C & D)
Number
Average Value
Number
Average Value
Number
Average Value
Number
Average Value
Number
Average Value
Number
Average Value
LOANS ORIGINATED
0
$0
28
$217,005
71
$197,421
6
$99,877
19
$235,517
22
$144,011
APPLICATIONS APPROVED, NOT ACCEPTED
0
$0
4
$209,742
12
$170,528
1
$155,220
2
$360,050
3
$160,787
APPLICATIONS DENIED
0
$0
3
$248,873
40
$184,961
9
$35,476
4
$362,998
4
$181,990
APPLICATIONS WITHDRAWN
1
$196,480
6
$144,740
34
$183,535
3
$264,593
6
$339,747
4
$109,292
FILES CLOSED FOR INCOMPLETENESS
0
$0
1
$111,010
11
$204,161
0
$0
0
$0
3
$98,567
Aggregated Statistics For Year 2004 (Based on 8 partial tracts)
A) FHA, FSA/RHS & VA Home Purchase Loans
B) Conventional Home Purchase Loans
C) Refinancings
D) Home Improvement Loans
F) Non-occupant Loans on < 5 Family Dwellings (A B C & D)
G) Loans On Manufactured Home Dwelling (A B C & D)
Number
Average Value
Number
Average Value
Number
Average Value
Number
Average Value
Number
Average Value
Number
Average Value
LOANS ORIGINATED
2
$110,030
45
$159,913
62
$157,739
2
$32,420
17
$184,171
17
$101,245
APPLICATIONS APPROVED, NOT ACCEPTED
0
$0
3
$180,760
10
$140,581
2
$68,770
4
$131,888
1
$172,900
APPLICATIONS DENIED
1
$68,770
12
$118,625
28
$132,975
2
$37,820
7
$167,990
7
$55,716
APPLICATIONS WITHDRAWN
0
$0
2
$136,555
24
$168,768
1
$312,400
1
$96,280
1
$96,280
FILES CLOSED FOR INCOMPLETENESS
0
$0
4
$149,815
8
$160,009
0
$0
0
$0
3
$135,570
Aggregated Statistics For Year 2003 (Based on 8 partial tracts)
A) FHA, FSA/RHS & VA Home Purchase Loans
B) Conventional Home Purchase Loans
C) Refinancings
D) Home Improvement Loans
F) Non-occupant Loans on < 5 Family Dwellings (A B C & D)
Number
Average Value
Number
Average Value
Number
Average Value
Number
Average Value
Number
Average Value
LOANS ORIGINATED
2
$117,890
33
$162,007
127
$137,915
5
$32,420
26
$142,486
APPLICATIONS APPROVED, NOT ACCEPTED
1
$78,590
6
$163,078
18
$113,413
2
$19,650
2
$75,155
APPLICATIONS DENIED
0
$0
5
$255,032
28
$115,081
2
$34,385
2
$98,240
APPLICATIONS WITHDRAWN
1
$192,550
5
$146,574
29
$135,571
0
$0
5
$151,880
FILES CLOSED FOR INCOMPLETENESS
0
$0
1
$392,960
4
$136,800
0
$0
0
$0
Aggregated Statistics For Year 1999 (Based on 4 partial tracts)
B) Conventional Home Purchase Loans
C) Refinancings
D) Home Improvement Loans
F) Non-occupant Loans on < 5 Family Dwellings (A B C & D)


 Nearest zip codes: 97441, 97453, 97439, 97467, 97473, 97480.
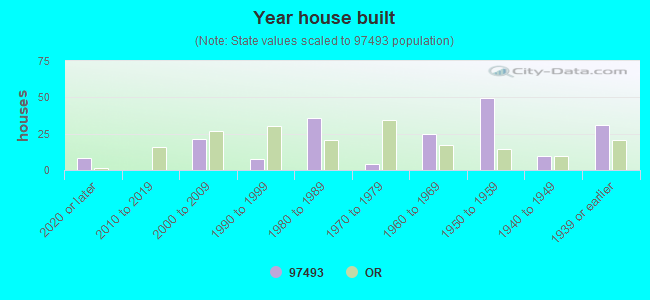


 : $31,796 in 3 contracts from 2002 to 2004