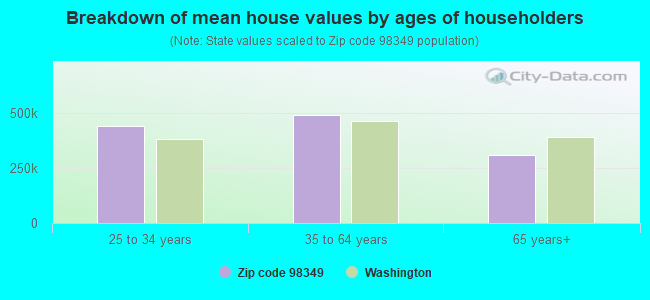
Estimated zip code population in 2022: 5,113 Zip code population in 2010: 4,614 Zip code population in 2000: 3,875
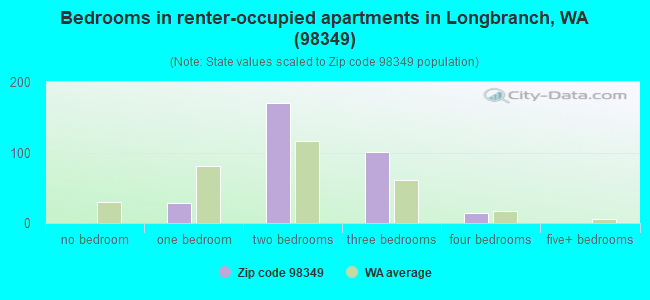
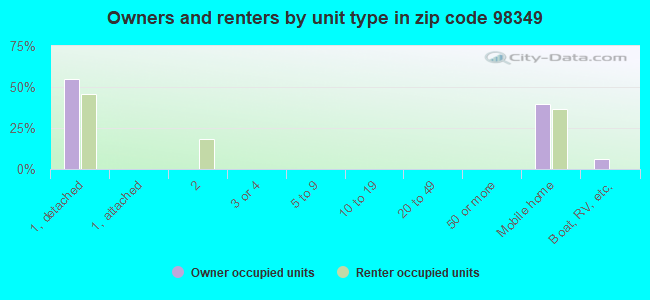
Houses and condos: 3,077 Renter-occupied apartments: 317
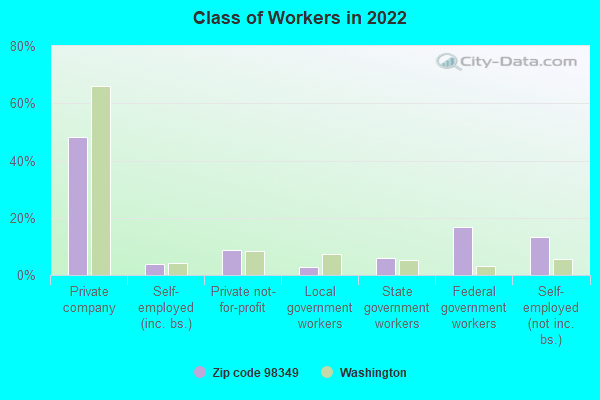
% of renters here:
14%
State:
36%
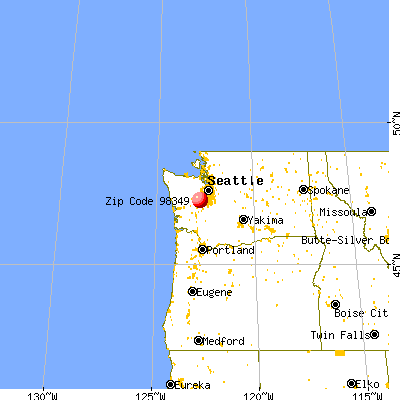
March 2022 cost of living index in zip code 98349: 96.1 (near average, U.S. average is 100)
Land area: 21.3 sq. mi. Water area: 20.9 sq. mi.
Population density: 240 people per square mile
(very low).
OSM Map
General Map
Google Map
MSN Map
OSM Map
General Map
Google Map
MSN Map
OSM Map
General Map
Google Map
MSN Map
OSM Map
General Map
Google Map
MSN Map
Please wait while loading the map...
Real estate property taxes paid for housing units in 2022:
This zip code:
0.6% ($2,328)
Washington:
0.8% ($4,283)
Median real estate property taxes paid for housing units with mortgages in 2022: $2,748 (0.6%) Median real estate property taxes paid for housing units with no mortgage in 2022: $1,836 (0.7%)
Business Search- 14 Million verified businesses
Males: 2,639
(51.6%)
Females: 2,474
(48.4%)
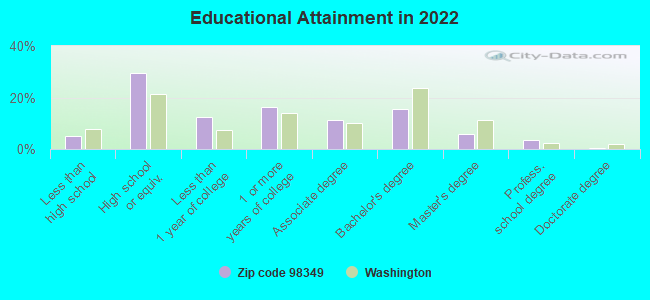
For population 25 years and over in 98349:
High school or higher: 93.7%
Bachelor's degree or higher: 24.9%
Graduate or professional degree: 9.7%
Unemployed: 2.1%
Mean travel time to work (commute): 46.5 minutes
For population 15 years and over in 98349:
Never married: 25.8%
Now married: 57.6%
Separated: 0.4%
Widowed: 6.1%
Divorced: 10.1%
Zip code 98349 compared to state average:
Unemployed percentage below state average.
Black race population percentage significantly below state average.
Median age above state average.
Renting percentage significantly below state average.
Length of stay since moving in below state average.
Averages for the 2020 tax year for zip code 98349, filed in 2021:
Average Adjusted Gross Income (AGI) in 2020: $72,876 (Individual Income Tax Returns)
Here:
$72,876
State:
$99,264
Salary/wage: $61,682 (reported on 74.1% of returns)
Here:
$61,682
State:
$80,347
(% of AGI for various income ranges: 1083.2% for AGIs below $25k, 2946.1% for AGIs $25k-50k, 5585.0% for AGIs $50k-75k, 7993.7% for AGIs $75k-100k, 16390.8% for AGIs $100k-200k, 56286.7% for AGIs over 200k)
Taxable interest for individuals: $1,217 (reported on 29.7% of returns)
This zip code:
$1,217
Washington:
$2,077
(% of AGI for various income ranges: 21.7% for AGIs below $25k, 13.4% for AGIs $25k-50k, 33.2% for AGIs $50k-75k, 98.4% for AGIs $75k-100k, 72.0% for AGIs $100k-200k, 773.3% for AGIs over 200k)
Ordinary dividends: $5,798 (reported on 17.7% of returns)
Here:
$5,798
State:
$10,013
(% of AGI for various income ranges: 17.8% for AGIs below $25k, 34.8% for AGIs $25k-50k, 60.7% for AGIs $50k-75k, 115.8% for AGIs $75k-100k, 299.6% for AGIs $100k-200k, 3373.3% for AGIs over 200k)
Net capital gain/loss in AGI: +$25,315 (reported on 17.7% of returns)
Here:
+$25,315
State:
+$40,092
(% of AGI for various income ranges: 17.3% for AGIs below $25k, 22.7% for AGIs $25k-50k, 153.6% for AGIs $50k-75k, 151.1% for AGIs $75k-100k, 1121.2% for AGIs $100k-200k, 22293.3% for AGIs over 200k)
Profit/loss from business: +$14,062 (reported on 13.8% of returns)
Here:
+$14,062
State:
+$18,312
(% of AGI for various income ranges: 53.2% for AGIs below $25k, 165.0% for AGIs $25k-50k, 257.9% for AGIs $50k-75k, 518.9% for AGIs $75k-100k, 285.2% for AGIs $100k-200k, 3783.3% for AGIs over 200k)
Taxable individual retirement arrangement distribution: $22,045 (reported on 9.5% of returns)
98349:
$22,045
Washington:
$24,221
(% of AGI for various income ranges: 63.2% for AGIs below $25k, 99.8% for AGIs $25k-50k, 241.1% for AGIs $50k-75k, 367.4% for AGIs $75k-100k, 1111.6% for AGIs $100k-200k)
Total itemized deductions: $31,250 (reported on 8.6% of returns)
Here:
$31,250
State:
$39,068
(% of AGI for various income ranges: 147.3% for AGIs below $25k, 257.5% for AGIs $50k-75k, 704.7% for AGIs $75k-100k, 791.2% for AGIs $100k-200k, 5360.0% for AGIs over 200k)
Charity contributions: $5,844 (reported on 6.9% of returns)
Here:
$5,844
State:
$15,331
(% of AGI for various income ranges: 21.1% for AGIs $25k-50k, 83.7% for AGIs $75k-100k, 130.4% for AGIs $100k-200k, 1190.0% for AGIs over 200k)
Taxes paid: $7,215 (reported on 8.6% of returns)
98349:
$7,215
State:
$7,774
(% of AGI for various income ranges: 32.4% for AGIs below $25k, 67.9% for AGIs $50k-75k, 150.0% for AGIs $75k-100k, 187.6% for AGIs $100k-200k, 1220.0% for AGIs over 200k)
Earned income credit: $2,100 (reported on 11.2% of returns)
Here:
$2,100
State:
$2,020
(% of AGI for various income ranges: 76.8% for AGIs below $25k, 52.5% for AGIs $25k-50k)
Percentage of individuals using paid preparers for their 2020 taxes: 92.2%
Here:
92%
State:
93%
(% for various income ranges: 87.9% for AGIs below $25k, 94.5% for AGIs $25k-50k, 92.1% for AGIs $50k-75k, 92.6% for AGIs $75k-100k, 93.2% for AGIs $100k-200k, 100.0% for AGIs over 200k)
Averages for the 2012 tax year for zip code 98349, filed in 2013:
Average Adjusted Gross Income (AGI) in 2012: $51,440 (Individual Income Tax Returns)
Here:
$51,440
State:
$69,533
Salary/wage: $46,481 (reported on 74.7% of returns)
Here:
$46,481
State:
$57,267
(% of AGI for various income ranges: 63.0% for AGIs below $25k, 66.2% for AGIs $25k-50k, 68.4% for AGIs $50k-75k, 76.7% for AGIs $75k-100k, 71.1% for AGIs $100k-200k, 51.6% for AGIs over 200k)
Taxable interest for individuals: $1,246 (reported on 32.5% of returns)
This zip code:
$1,246
Washington:
$1,816
(% of AGI for various income ranges: 1.3% for AGIs below $25k, 0.8% for AGIs $25k-50k, 0.8% for AGIs $50k-75k, 0.2% for AGIs $75k-100k, 0.4% for AGIs $100k-200k, 1.9% for AGIs over 200k)
Ordinary dividends: $3,664 (reported on 17.0% of returns)
Here:
$3,664
State:
$8,163
(% of AGI for various income ranges: 2.9% for AGIs below $25k, 1.1% for AGIs $25k-50k, 0.9% for AGIs $50k-75k, 1.1% for AGIs $75k-100k, 1.7% for AGIs $100k-200k)
Net capital gain/loss in AGI: +$1,258 (reported on 13.4% of returns)
Here:
+$1,258
State:
+$21,568
(% of AGI for various income ranges: 0.3% for AGIs $50k-75k, 1.6% for AGIs $100k-200k)
Profit/loss from business: +$10,667 (reported on 13.9% of returns)
Here:
+$10,667
State:
+$16,521
(% of AGI for various income ranges: 7.9% for AGIs below $25k, 4.3% for AGIs $25k-50k, 2.6% for AGIs $50k-75k, 1.0% for AGIs $75k-100k, 3.2% for AGIs $100k-200k)
Taxable individual retirement arrangement distribution: $16,304 (reported on 11.9% of returns)
98349:
$16,304
Washington:
$18,648
(% of AGI for various income ranges: 3.6% for AGIs below $25k, 3.8% for AGIs $25k-50k, 5.4% for AGIs $50k-75k, 7.3% for AGIs $100k-200k)
Total itemized deductions: $20,670 (25% of AGI, reported on 37.6% of returns)
Here:
$20,670
State:
$23,872
Here:
25.4% of AGI
State:
18.2% of AGI
(% of AGI for various income ranges: 18.6% for AGIs below $25k, 16.9% for AGIs $25k-50k, 16.2% for AGIs $50k-75k, 13.8% for AGIs $75k-100k, 15.3% for AGIs $100k-200k, 10.1% for AGIs over 200k)
Charity contributions: $2,554 (reported on 27.8% of returns)
Here:
$2,554
State:
$4,465
(% of AGI for various income ranges: 0.7% for AGIs below $25k, 1.0% for AGIs $25k-50k, 2.0% for AGIs $50k-75k, 1.3% for AGIs $75k-100k, 1.6% for AGIs $100k-200k, 1.3% for AGIs over 200k)
Taxes paid: $4,849 (reported on 37.6% of returns)
98349:
$4,849
State:
$6,400
(% of AGI for various income ranges: 3.8% for AGIs below $25k, 3.5% for AGIs $25k-50k, 3.4% for AGIs $50k-75k, 3.1% for AGIs $75k-100k, 4.0% for AGIs $100k-200k, 3.4% for AGIs over 200k)
Earned income credit: $2,025 (reported on 16.5% of returns)
Here:
$2,025
State:
$2,073
(% of AGI for various income ranges: 5.7% for AGIs below $25k, 1.0% for AGIs $25k-50k)
Percentage of individuals using paid preparers for their 2012 taxes: 42.3%
Here:
42%
State:
43%
(% for various income ranges: 35.7% for AGIs below $25k, 39.2% for AGIs $25k-50k, 50.0% for AGIs $50k-75k, 50.0% for AGIs $75k-100k, 50.0% for AGIs $100k-200k, 66.7% for AGIs over 200k)
Averages for the 2004 tax year for zip code 98349, filed in 2005:
Average Adjusted Gross Income (AGI) in 2004: $42,377 (Individual Income Tax Returns)
Here:
$42,377
State:
$54,331
Salary/wage: $39,221 (reported on 77.1% of returns)
Here:
$39,221
State:
$45,761
(% of AGI for various income ranges: 105.8% for AGIs below $10k, 66.6% for AGIs $10k-25k, 72.6% for AGIs $25k-50k, 77.4% for AGIs $50k-75k, 78.2% for AGIs $75k-100k, 58.0% for AGIs over 100k)
Taxable interest for individuals: $1,152 (reported on 41.5% of returns)
This zip code:
$1,152
Washington:
$2,110
(% of AGI for various income ranges: 6.0% for AGIs below $10k, 1.7% for AGIs $10k-25k, 1.2% for AGIs $25k-50k, 0.8% for AGIs $50k-75k, 1.1% for AGIs $75k-100k, 1.0% for AGIs over 100k)
Taxable dividends: $2,917 (reported on 20.7% of returns)
Here:
$2,917
State:
$5,879
(% of AGI for various income ranges: 5.4% for AGIs below $10k, 1.6% for AGIs $10k-25k, 1.2% for AGIs $25k-50k, 1.0% for AGIs $50k-75k, 0.8% for AGIs $75k-100k, 2.3% for AGIs over 100k)
Net capital gain/loss: +$6,886 (reported on 20.2% of returns)
Here:
+$6,886
State:
+$15,835
(% of AGI for various income ranges: -1.8% for AGIs below $10k, -0.4% for AGIs $10k-25k, 1.4% for AGIs $25k-50k, 1.4% for AGIs $50k-75k, 1.7% for AGIs $75k-100k, 10.2% for AGIs over 100k)
Profit/loss from business: +$9,442 (reported on 16.7% of returns)
Here:
+$9,442
State:
+$13,994
(% of AGI for various income ranges: 0.1% for AGIs below $10k, 8.1% for AGIs $10k-25k, 4.3% for AGIs $25k-50k, 2.9% for AGIs $50k-75k, -1.2% for AGIs $75k-100k, 6.1% for AGIs over 100k)
IRA payment deduction: $3,094 (reported on 1.9% of returns)
98349:
$3,094
Washington:
$3,001
Total itemized deductions: $17,498 (27% of AGI, reported on 38.5% of returns)
Here:
$17,498
State:
$19,669
Here:
27.4% of AGI
State:
20.7% of AGI
(% of AGI for various income ranges: 39.4% for AGIs below $10k, 16.1% for AGIs $10k-25k, 17.1% for AGIs $25k-50k, 14.6% for AGIs $50k-75k, 16.2% for AGIs $75k-100k, 14.5% for AGIs over 100k)
Charity contributions deductions: $2,052 (3% of AGI, reported on 30.6% of returns)
Here:
$2,052
State:
$3,569
Here:
3.0% of AGI
State:
3.5% of AGI
(% of AGI for various income ranges: 1.6% for AGIs below $10k, 0.9% for AGIs $10k-25k, 1.5% for AGIs $25k-50k, 1.3% for AGIs $50k-75k, 1.4% for AGIs $75k-100k, 1.9% for AGIs over 100k)
Total tax: $5,347 (reported on 77.2% of returns)
98349:
$5,347
State:
$9,065
(% of AGI for various income ranges: 3.9% for AGIs below $10k, 4.3% for AGIs $10k-25k, 6.3% for AGIs $25k-50k, 8.5% for AGIs $50k-75k, 10.2% for AGIs $75k-100k, 16.8% for AGIs over 100k)
Earned income credit: $1,620 (reported on 12.6% of returns)
Here:
$1,620
State:
$1,607
Percentage of individuals using paid preparers for their 2004 taxes: 51.5%
Here:
52%
State:
49%
(% for various income ranges: 47.3% for AGIs below $10k, 46.8% for AGIs $10k-25k, 53.5% for AGIs $25k-50k, 49.8% for AGIs $50k-75k, 58.1% for AGIs $75k-100k, 67.6% for AGIs over 100k)
Household received Food Stamps/SNAP in the past 12 months: 258 Household did not receive Food Stamps/SNAP in the past 12 months: 1,962
Women who did not have a birth in the past 12 months: 1,056 (470 now married, 586 unmarried)
Housing units in zip code 98349 with a mortgage: 1,309 (46 second mortgage, 47 both second mortgage and home equity loan) Median monthly owner costs for units with a mortgage: $1,854 Median monthly owner costs for units without a mortgage: $312
Residents with income below the poverty level in 2022:
This zip code:
4.3%
Whole state:
10.0%
Residents with income below 50% of the poverty level in 2022:
This zip code:
1.6%
Whole state:
4.6%
Median number of rooms in houses and condos:
Here:
5.9
State:
6.5
Median number of rooms in apartments:
Here:
4.2
State:
3.9
Notable locations in this zip code not listed on our city pages
Notable locations in zip code 98349: Delano Beach (A), Lakebay Marina (B), Pierce County Fire Protection District 16 Station 6 (C), Pierce County Fire Protection District 16 Station 3 (D), Pierce County Fire Protection District 16 Station 2 (E), Key Center Library (F). Display/hide their locations on the map
Lakes and reservoirs: Little Palmer Lake (A), Bay Lake (B), Palmer Lake (C), Herron Lake (D), Jackson Lake (E), Haleys Lagoon (F). Display/hide their locations on the map
In group quarters: 6 (-1 institutionalized population)
Size of family households: 791 2-persons, 253 3-persons, 168 4-persons, 50 5-persons, 86 6-persons, 23 7-or-more-persons
Size of nonfamily households: 586 1-person, 262 2-persons, 7 4-persons
630 married couples with children.
0 single-parent households ().
91.6% of residents of 98349 zip code speak English at home.
4.6% of residents speak Spanish at home (100% very well).
1.2% of residents speak other Indo-European language at home (56% very well, 44% well).
2.4% of residents speak Asian or Pacific Island language at home (100% very well).
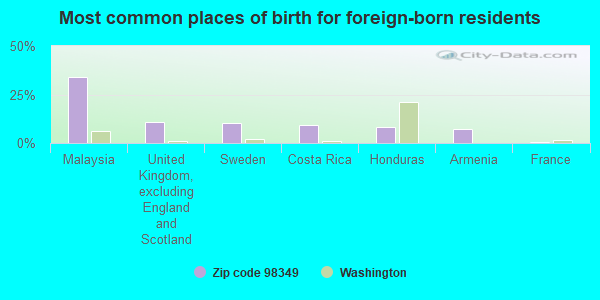
Foreign born population: 517 (10.1%) (64.5% of them are naturalized citizens)
This zip code:
10.1%
Whole state:
15.3%
34%Malaysia
11%United Kingdom, excluding England and Scotland
10%Sweden
9%Costa Rica
8%Honduras
7%Armenia
1%France
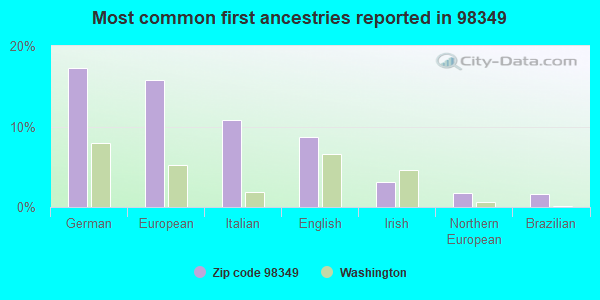
17%German
16%European
11%Italian
9%English
3%Irish
2%Northern European
2%Brazilian
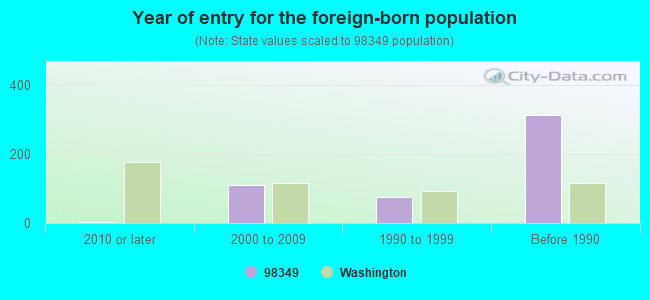
Year of entry for the foreign-born population
22010 or later
1102000 to 2009
761990 to 1999
313Before 1990
Housing units lacking complete plumbing facilities: 1.8% Housing units lacking complete kitchen facilities: 1.1%
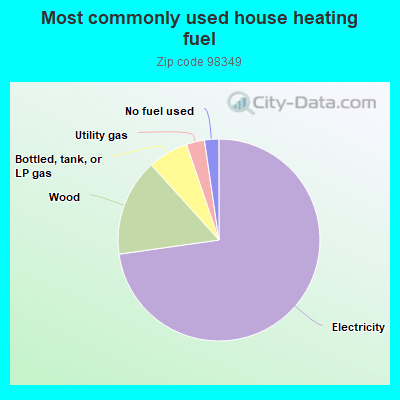
72.9%Electricity
15.6%Wood
6.5%Bottled, tank, or LP gas
2.9%Utility gas
2.3%No fuel used
Population in 1990: 3,373. Population change in the 1990s: +502 (+14.9%).
Place of birth for U.S.-born residents:
This state: 2,425
Northeast: 38
Midwest: 302
South: 766
West: 1,015
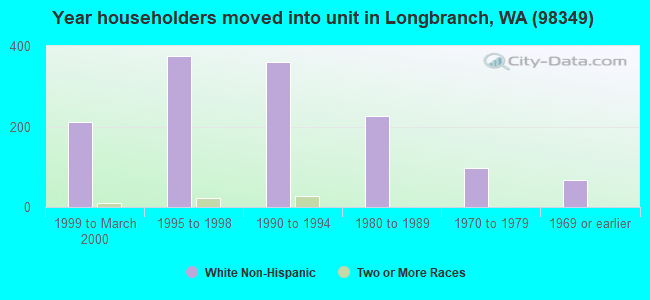
58% of the 98349 zip code residents lived in the same house 5 years ago. Out of people who lived in different houses, 55% lived in this county. Out of people who lived in different counties, 50% lived in Washington.
75% of the 98349 zip code residents lived in the same house 1 year ago. Out of people who lived in different houses, 33% moved from this county. Out of people who lived in different houses, 53% moved from different county within same state. Out of people who lived in different houses, 5% moved from different state. Out of people who lived in different houses, 6% moved from abroad.
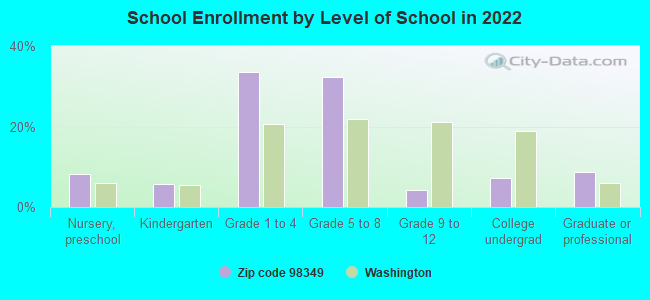
Private vs. public school enrollment:
Students in private schools in grades 1 to 8 (elementary and middle school): 115
Here:
17.9%
Washington:
12.4%
Students in private schools in grades 9 to 12 (high school): 1
Here:
3.0%
Washington:
9.2%
Students in private undergraduate colleges:
Here:
0.0%
Washington:
16.5%
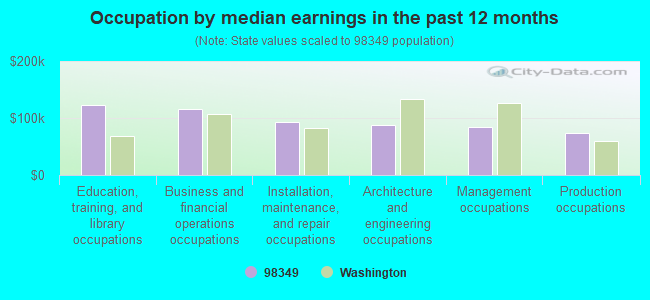
Occupation by median earnings in the past 12 months ($)
123,955Education, training, and library occupations
116,671Business and financial operations occupations
92,702Installation, maintenance, and repair occupations
87,890Architecture and engineering occupations
85,423Management occupations
73,316Production occupations
Top industries in this zip code by the number of employees in 2005:
Construction: Site Preparation Contractors (5-9: 2, 1-4: 2)
Other Services (except Public Administration): Other Similar Organizations (except Business, Professional, Labor, and Political Organizations) (10-19: 1, 1-4: 1)
Health Care and Social Assistance: Offices of Dentists (10-19: 1)
Professional, Scientific, and Technical Services: Engineering Services (10-19: 1)
Health Care and Social Assistance: Offices of Physicians (except Mental Health Specialists) (10-19: 1)
Construction: New Single-Family Housing Construction (except Operative Builders) (5-9: 1, 1-4: 2)
Construction: Electrical Contractors (5-9: 1)
People in group quarters in 2000:
13 people in other workers' dormitories
Fatal accident statistics in 2013:
Fatal accident count: 1
Vehicles involved in fatal accidents: 1
Fatal accidents caused by drunken drivers: 1
Fatalities: 1
Persons involved in fatal accidents: 2
Pedestrians involved in fatal accidents: 0
Fatal accident statistics in 2011:
Fatal accident count: 1
Vehicles involved in fatal accidents: 1
Fatal accidents caused by drunken drivers: 1
Fatalities: 1
Persons involved in fatal accidents: 1
Pedestrians involved in fatal accidents: 0
Home Mortgage Disclosure Act Aggregated Statistics For Year 2009 (Based on 6 partial tracts)
A) FHA, FSA/RHS & VA Home Purchase Loans
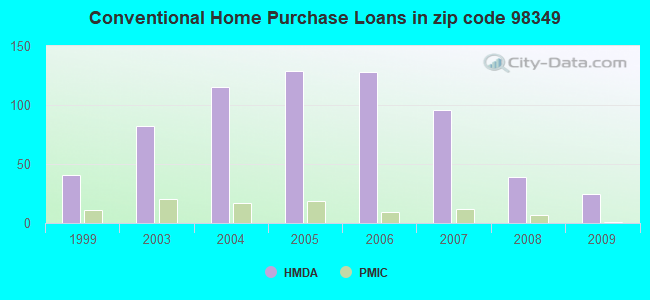
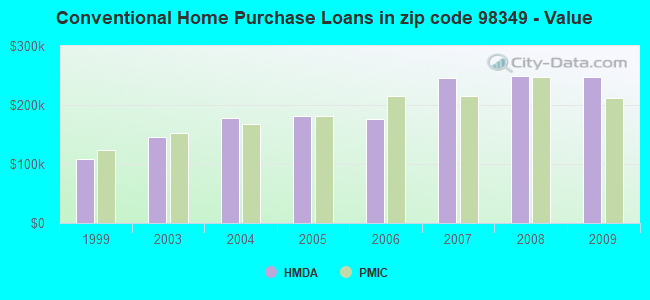
B) Conventional Home Purchase Loans
C) Refinancings
D) Home Improvement Loans
F) Non-occupant Loans on < 5 Family Dwellings (A B C & D)
G) Loans On Manufactured Home Dwelling (A B C & D)
Number
Average Value
Number
Average Value
Number
Average Value
Number
Average Value
Number
Average Value
Number
Average Value
LOANS ORIGINATED
28
$225,668
25
$247,327
168
$226,542
6
$131,917
32
$237,265
25
$162,520
APPLICATIONS APPROVED, NOT ACCEPTED
0
$0
5
$178,072
16
$216,728
1
$84,240
6
$159,598
3
$152,780
APPLICATIONS DENIED
1
$129,520
9
$232,250
74
$243,223
7
$79,394
9
$253,420
15
$171,370
APPLICATIONS WITHDRAWN
0
$0
4
$241,980
45
$261,684
2
$539,475
8
$244,315
4
$195,492
FILES CLOSED FOR INCOMPLETENESS
0
$0
0
$0
12
$247,268
1
$9,740
1
$308,920
0
$0
Aggregated Statistics For Year 2008 (Based on 6 partial tracts)
A) FHA, FSA/RHS & VA Home Purchase Loans
B) Conventional Home Purchase Loans
C) Refinancings
D) Home Improvement Loans
F) Non-occupant Loans on < 5 Family Dwellings (A B C & D)
G) Loans On Manufactured Home Dwelling (A B C & D)
Number
Average Value
Number
Average Value
Number
Average Value
Number
Average Value
Number
Average Value
Number
Average Value
LOANS ORIGINATED
21
$230,372
39
$249,969
135
$235,429
16
$140,016
27
$245,247
31
$179,559
APPLICATIONS APPROVED, NOT ACCEPTED
2
$183,090
7
$292,797
26
$254,979
2
$176,560
6
$268,868
4
$181,695
APPLICATIONS DENIED
7
$259,447
13
$236,753
85
$257,016
20
$138,410
10
$215,427
17
$174,565
APPLICATIONS WITHDRAWN
3
$295,443
5
$283,922
37
$232,438
2
$115,200
5
$221,048
9
$159,154
FILES CLOSED FOR INCOMPLETENESS
0
$0
2
$262,665
11
$261,191
2
$323,845
1
$354,940
3
$188,980
Aggregated Statistics For Year 2007 (Based on 6 partial tracts)
A) FHA, FSA/RHS & VA Home Purchase Loans
B) Conventional Home Purchase Loans
C) Refinancings
D) Home Improvement Loans
F) Non-occupant Loans on < 5 Family Dwellings (A B C & D)
G) Loans On Manufactured Home Dwelling (A B C & D)
Number
Average Value
Number
Average Value
Number
Average Value
Number
Average Value
Number
Average Value
Number
Average Value
LOANS ORIGINATED
14
$202,384
96
$245,932
166
$223,526
21
$126,197
51
$268,998
49
$168,377
APPLICATIONS APPROVED, NOT ACCEPTED
0
$0
18
$251,320
33
$214,914
2
$112,310
7
$279,364
4
$179,472
APPLICATIONS DENIED
6
$203,352
34
$226,512
117
$233,481
28
$108,263
14
$229,571
35
$145,336
APPLICATIONS WITHDRAWN
1
$197,650
13
$253,777
46
$210,383
9
$166,258
5
$232,906
9
$169,561
FILES CLOSED FOR INCOMPLETENESS
0
$0
6
$147,575
20
$281,192
0
$0
2
$111,960
2
$52,675
Aggregated Statistics For Year 2006 (Based on 6 partial tracts)
A) FHA, FSA/RHS & VA Home Purchase Loans
B) Conventional Home Purchase Loans
C) Refinancings
D) Home Improvement Loans
F) Non-occupant Loans on < 5 Family Dwellings (A B C & D)
G) Loans On Manufactured Home Dwelling (A B C & D)
Number
Average Value
Number
Average Value
Number
Average Value
Number
Average Value
Number
Average Value
Number
Average Value
LOANS ORIGINATED
15
$207,037
128
$175,681
166
$202,357
27
$101,932
57
$185,241
42
$144,192
APPLICATIONS APPROVED, NOT ACCEPTED
3
$123,050
19
$183,058
31
$241,714
4
$37,902
8
$190,820
10
$129,331
APPLICATIONS DENIED
4
$220,808
31
$176,151
112
$189,672
24
$99,463
10
$173,509
29
$129,933
APPLICATIONS WITHDRAWN
3
$162,123
13
$142,603
71
$225,454
7
$160,724
7
$165,531
8
$132,620
FILES CLOSED FOR INCOMPLETENESS
1
$158,210
5
$171,702
13
$204,941
0
$0
3
$175,030
2
$133,400
Aggregated Statistics For Year 2005 (Based on 6 partial tracts)
A) FHA, FSA/RHS & VA Home Purchase Loans
B) Conventional Home Purchase Loans
C) Refinancings
D) Home Improvement Loans
F) Non-occupant Loans on < 5 Family Dwellings (A B C & D)
G) Loans On Manufactured Home Dwelling (A B C & D)
Number
Average Value
Number
Average Value
Number
Average Value
Number
Average Value
Number
Average Value
Number
Average Value
LOANS ORIGINATED
21
$166,185
129
$181,357
203
$183,643
24
$91,339
53
$178,156
55
$130,148
APPLICATIONS APPROVED, NOT ACCEPTED
4
$141,960
23
$189,440
24
$150,058
5
$114,152
9
$210,629
10
$125,596
APPLICATIONS DENIED
3
$154,983
33
$146,605
102
$184,228
19
$74,967
10
$170,102
27
$120,965
APPLICATIONS WITHDRAWN
2
$170,865
23
$152,856
77
$168,232
9
$112,748
10
$201,189
13
$124,818
FILES CLOSED FOR INCOMPLETENESS
1
$92,840
9
$137,630
18
$166,214
1
$72,110
2
$160,965
4
$155,528
Aggregated Statistics For Year 2004 (Based on 6 partial tracts)
A) FHA, FSA/RHS & VA Home Purchase Loans
B) Conventional Home Purchase Loans
C) Refinancings
D) Home Improvement Loans
F) Non-occupant Loans on < 5 Family Dwellings (A B C & D)
G) Loans On Manufactured Home Dwelling (A B C & D)
Number
Average Value
Number
Average Value
Number
Average Value
Number
Average Value
Number
Average Value
Number
Average Value
LOANS ORIGINATED
20
$140,826
115
$178,121
169
$163,520
13
$83,256
46
$160,185
46
$115,142
APPLICATIONS APPROVED, NOT ACCEPTED
3
$141,370
14
$138,437
45
$156,698
4
$94,500
7
$108,409
14
$117,104
APPLICATIONS DENIED
2
$122,720
34
$162,701
115
$152,692
21
$67,379
15
$145,356
31
$112,211
APPLICATIONS WITHDRAWN
1
$164,630
16
$168,399
76
$148,062
4
$65,150
6
$148,652
14
$117,317
FILES CLOSED FOR INCOMPLETENESS
0
$0
4
$141,765
23
$148,863
2
$28,315
2
$93,255
3
$109,340
Aggregated Statistics For Year 2003 (Based on 6 partial tracts)
A) FHA, FSA/RHS & VA Home Purchase Loans
B) Conventional Home Purchase Loans
C) Refinancings
D) Home Improvement Loans
E) Loans on Dwellings For 5+ Families
F) Non-occupant Loans on < 5 Family Dwellings (A B C & D)
Number
Average Value
Number
Average Value
Number
Average Value
Number
Average Value
Number
Average Value
Number
Average Value
LOANS ORIGINATED
17
$124,685
82
$145,293
302
$153,831
11
$54,730
1
$1,640,570
55
$136,745
APPLICATIONS APPROVED, NOT ACCEPTED
3
$115,390
14
$172,995
35
$149,680
1
$40,010
0
$0
4
$95,090
APPLICATIONS DENIED
1
$127,490
23
$151,654
85
$150,656
9
$65,773
0
$0
8
$135,670
APPLICATIONS WITHDRAWN
0
$0
10
$160,693
77
$146,004
6
$41,273
0
$0
6
$119,810
FILES CLOSED FOR INCOMPLETENESS
0
$0
6
$122,585
11
$136,770
0
$0
0
$0
1
$109,500
Aggregated Statistics For Year 1999 (Based on 2 partial tracts)
A) FHA, FSA/RHS & VA Home Purchase Loans
B) Conventional Home Purchase Loans
C) Refinancings
D) Home Improvement Loans
F) Non-occupant Loans on < 5 Family Dwellings (A B C & D)
Detailed PMIC statistics for the following Tracts:0726.02
, 0726.03
2002 - 2018 National Fire Incident Reporting System (NFIRS) incidents
According to the data from the years 2002 - 2018 the average number of fires per year is 18. The highest number of fire incidents - 44 took place in 2006, and the least - 0 in 2013. The data has a growing trend.
When looking into fire subcategories, the most incidents belonged to: Structure Fires (48.9%), and Outside Fires (39.2%).
Fire incident types reported to NFIRS in Zip Code 98349


 Nearest zip codes: 98394, 98351, 98388, 98329, 98333, 98524.


 According to the data from the years 2002 - 2018 the average number of fires per year is 18. The highest number of fire incidents - 44 took place in 2006, and the least - 0 in 2013. The data has a growing trend.
 When looking into fire subcategories, the most incidents belonged to: Structure Fires (48.9%), and Outside Fires (39.2%).