Estimated zip code population in 2022: 1,769 Zip code population in 2010: 1,289 Zip code population in 2000: 1,341
Houses and condos: 699 Renter-occupied apartments: 152
% of renters here:
23%
State:
36%
March 2022 cost of living index in zip code 99029: 87.1 (less than average, U.S. average is 100)
Land area: 118.5 sq. mi. Water area: 0.3 sq. mi.
Population density: 15 people per square mile
(very low).
OSM Map
General Map
Google Map
MSN Map
OSM Map
General Map
Google Map
MSN Map
OSM Map
General Map
Google Map
MSN Map
OSM Map
General Map
Google Map
MSN Map
Please wait while loading the map...
Real estate property taxes paid for housing units in 2022:
This zip code:
0.6% ($2,312)
Washington:
0.8% ($4,283)
Median real estate property taxes paid for housing units with mortgages in 2022: $2,486 (0.5%) Median real estate property taxes paid for housing units with no mortgage in 2022: $1,778 (0.6%)
Business Search- 14 Million verified businesses
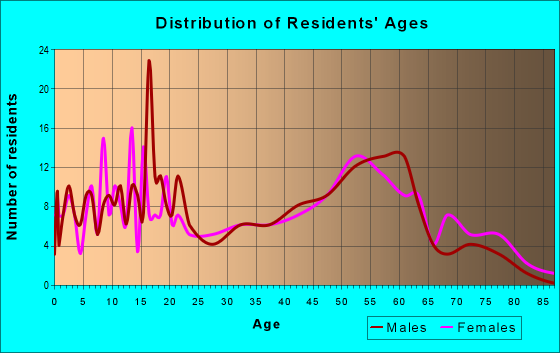
Males: 888
(50.2%)
Females: 880
(49.8%)
For population 25 years and over in 99029:
High school or higher: 87.4%
Bachelor's degree or higher: 24.0%
Graduate or professional degree: 4.7%
Unemployed: 6.7%
Mean travel time to work (commute): 24.5 minutes
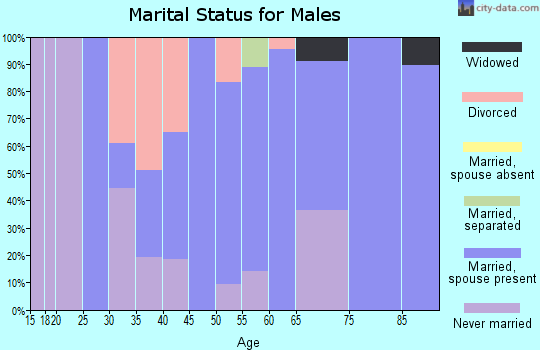
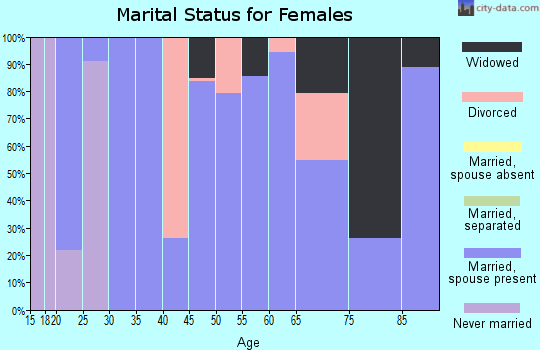
For population 15 years and over in 99029:
Never married: 16.4%
Now married: 74.9%
Separated: 0.0%
Widowed: 1.5%
Divorced: 7.1%
Zip code 99029 compared to state average:
Median house value below state average.
Black race population percentage significantly below state average.
Hispanic race population percentage significantly below state average.
Foreign-born population percentage significantly below state average.
Renting percentage below state average.
Percentage of population with a bachelor's degree or higher below state average.
Averages for the 2020 tax year for zip code 99029, filed in 2021:
Average Adjusted Gross Income (AGI) in 2020: $58,326 (Individual Income Tax Returns)
Here:
$58,326
State:
$99,264
Salary/wage: $53,729 (reported on 67.4% of returns)
Here:
$53,729
State:
$80,347
(% of AGI for various income ranges: 562.3% for AGIs below $25k, 3252.0% for AGIs $25k-50k, 5947.0% for AGIs $50k-75k, 9922.0% for AGIs $75k-100k, 23191.7% for AGIs $100k-200k)
Taxable interest for individuals: $1,048 (reported on 29.1% of returns)
This zip code:
$1,048
Washington:
$2,077
(% of AGI for various income ranges: 5.8% for AGIs below $25k, 18.7% for AGIs $25k-50k, 25.0% for AGIs $50k-75k, 82.0% for AGIs $75k-100k, 255.0% for AGIs $100k-200k)
Ordinary dividends: $6,858 (reported on 30.2% of returns)
Here:
$6,858
State:
$10,013
(% of AGI for various income ranges: 554.2% for AGIs below $25k, 47.0% for AGIs $50k-75k, 104.0% for AGIs $75k-100k, 405.0% for AGIs $100k-200k)
Net capital gain/loss in AGI: +$16,127 (reported on 12.8% of returns)
Here:
+$16,127
State:
+$40,092
(% of AGI for various income ranges: 10.8% for AGIs below $25k, 169.0% for AGIs $50k-75k, 2628.3% for AGIs $100k-200k)
Profit/loss from business: +$8,533 (reported on 10.5% of returns)
Here:
+$8,533
State:
+$18,312
(% of AGI for various income ranges: 264.0% for AGIs $25k-50k, 238.0% for AGIs $50k-75k, 223.3% for AGIs $100k-200k)
Taxable individual retirement arrangement distribution: $13,983 (reported on 7.0% of returns)
99029:
$13,983
Washington:
$24,221
(% of AGI for various income ranges: 316.0% for AGIs $25k-50k, 730.0% for AGIs $75k-100k)
Total itemized deductions: $24,550 (reported on 2.3% of returns)
Here:
$24,550
State:
$39,068
(% of AGI for various income ranges: 327.3% for AGIs $25k-50k)
Taxes paid: $5,500 (reported on 2.3% of returns)
99029:
$5,500
State:
$7,774
(% of AGI for various income ranges: 110.0% for AGIs $50k-75k)
Earned income credit: $2,162 (reported on 9.3% of returns)
Here:
$2,162
State:
$2,020
(% of AGI for various income ranges: 40.0% for AGIs below $25k, 46.0% for AGIs $25k-50k)
Percentage of individuals using paid preparers for their 2020 taxes: 95.3%
Here:
95%
State:
93%
(% for various income ranges: 96.8% for AGIs below $25k, 94.7% for AGIs $25k-50k, 92.9% for AGIs $50k-75k, 100.0% for AGIs $75k-100k, 92.9% for AGIs $100k-200k)
Averages for the 2012 tax year for zip code 99029, filed in 2013:
Average Adjusted Gross Income (AGI) in 2012: $45,847 (Individual Income Tax Returns)
Here:
$45,847
State:
$69,533
Salary/wage: $44,527 (reported on 68.4% of returns)
Here:
$44,527
State:
$57,267
(% of AGI for various income ranges: 53.9% for AGIs below $25k, 79.6% for AGIs $25k-50k, 66.0% for AGIs $50k-75k, 78.3% for AGIs $75k-100k, 57.5% for AGIs $100k-200k)
Taxable interest for individuals: $905 (reported on 28.9% of returns)
This zip code:
$905
Washington:
$1,816
(% of AGI for various income ranges: 0.8% for AGIs below $25k, 0.2% for AGIs $25k-50k, 1.6% for AGIs $50k-75k, 0.4% for AGIs $75k-100k, 0.3% for AGIs $100k-200k)
Ordinary dividends: $5,010 (reported on 27.6% of returns)
Here:
$5,010
State:
$8,163
(% of AGI for various income ranges: 18.5% for AGIs below $25k, 2.6% for AGIs $50k-75k, 2.0% for AGIs $100k-200k)
Net capital gain/loss in AGI: +$2,778 (reported on 11.8% of returns)
Here:
+$2,778
State:
+$21,568
(% of AGI for various income ranges: 1.1% for AGIs $50k-75k, 1.6% for AGIs $100k-200k)
Profit/loss from business: +$4,300 (reported on 10.5% of returns)
Here:
+$4,300
State:
+$16,521
(% of AGI for various income ranges: 3.6% for AGIs below $25k, 2.7% for AGIs $25k-50k, 0.8% for AGIs $75k-100k)
Taxable individual retirement arrangement distribution: $8,940 (reported on 6.6% of returns)
99029:
$8,940
Washington:
$18,648
Total itemized deductions: $18,847 (22% of AGI, reported on 19.7% of returns)
Here:
$18,847
State:
$23,872
Here:
22.2% of AGI
State:
18.2% of AGI
(% of AGI for various income ranges: 11.8% for AGIs $25k-50k, 11.2% for AGIs $50k-75k, 8.0% for AGIs $75k-100k, 7.4% for AGIs $100k-200k)
Charity contributions: $3,390 (reported on 13.2% of returns)
Here:
$3,390
State:
$4,465
(% of AGI for various income ranges: 1.7% for AGIs $50k-75k, 0.9% for AGIs $75k-100k, 1.5% for AGIs $100k-200k)
Taxes paid: $3,607 (reported on 19.7% of returns)
99029:
$3,607
State:
$6,400
(% of AGI for various income ranges: 1.1% for AGIs below $25k, 1.2% for AGIs $25k-50k, 2.1% for AGIs $50k-75k, 1.6% for AGIs $75k-100k, 1.6% for AGIs $100k-200k)
Earned income credit: $2,230 (reported on 13.2% of returns)
Here:
$2,230
State:
$2,073
(% of AGI for various income ranges: 3.3% for AGIs below $25k, 1.7% for AGIs $25k-50k)
Percentage of individuals using paid preparers for their 2012 taxes: 53.9%
Here:
54%
State:
43%
(% for various income ranges: 60.6% for AGIs below $25k, 47.1% for AGIs $25k-50k, 44.4% for AGIs $50k-75k, 50.0% for AGIs $75k-100k, 55.6% for AGIs $100k-200k)
Averages for the 2004 tax year for zip code 99029, filed in 2005:
Average Adjusted Gross Income (AGI) in 2004: $37,590 (Individual Income Tax Returns)
Here:
$37,590
State:
$54,331
Salary/wage: $35,266 (reported on 82.8% of returns)
Here:
$35,266
State:
$45,761
(% of AGI for various income ranges: 164.2% for AGIs below $10k, 82.4% for AGIs $10k-25k, 77.9% for AGIs $25k-50k, 80.1% for AGIs $50k-75k, 76.7% for AGIs $75k-100k, 59.3% for AGIs over 100k)
Taxable interest for individuals: $1,223 (reported on 44.0% of returns)
This zip code:
$1,223
Washington:
$2,110
(% of AGI for various income ranges: 15.5% for AGIs below $10k, 0.6% for AGIs $10k-25k, 1.4% for AGIs $25k-50k, 1.9% for AGIs $50k-75k, 0.5% for AGIs $75k-100k, 0.7% for AGIs over 100k)
Taxable dividends: $1,641 (reported on 21.4% of returns)
Here:
$1,641
State:
$5,879
(% of AGI for various income ranges: 4.5% for AGIs below $10k, 0.8% for AGIs $10k-25k, 0.7% for AGIs $25k-50k, 1.4% for AGIs $50k-75k, 1.0% for AGIs $75k-100k)
Net capital gain/loss: +$1,735 (reported on 22.2% of returns)
Here:
+$1,735
State:
+$15,835
(% of AGI for various income ranges: -10.3% for AGIs below $10k, -0.6% for AGIs $10k-25k, 0.6% for AGIs $25k-50k, 0.1% for AGIs $50k-75k, 5.1% for AGIs $75k-100k)
Profit/loss from business: +$2,169 (reported on 12.6% of returns)
Here:
+$2,169
State:
+$13,994
(% of AGI for various income ranges: 8.2% for AGIs below $10k, 2.5% for AGIs $10k-25k, 0.7% for AGIs $25k-50k, 0.6% for AGIs $50k-75k)
Total itemized deductions: $15,060 (26% of AGI, reported on 21.9% of returns)
Here:
$15,060
State:
$19,669
Here:
26.3% of AGI
State:
20.7% of AGI
(% of AGI for various income ranges: 11.7% for AGIs $10k-25k, 8.3% for AGIs $25k-50k, 9.6% for AGIs $50k-75k, 13.1% for AGIs $75k-100k)
Charity contributions deductions: $2,552 (4% of AGI, reported on 17.2% of returns)
Here:
$2,552
State:
$3,569
Here:
4.3% of AGI
State:
3.5% of AGI
(% of AGI for various income ranges: 0.7% for AGIs $10k-25k, 1.1% for AGIs $25k-50k, 1.2% for AGIs $50k-75k, 2.3% for AGIs $75k-100k)
Total tax: $4,327 (reported on 72.1% of returns)
99029:
$4,327
State:
$9,065
(% of AGI for various income ranges: 2.6% for AGIs below $10k, 3.8% for AGIs $10k-25k, 6.0% for AGIs $25k-50k, 7.9% for AGIs $50k-75k, 10.2% for AGIs $75k-100k, 14.4% for AGIs over 100k)
Earned income credit: $1,798 (reported on 14.5% of returns)
Here:
$1,798
State:
$1,607
Percentage of individuals using paid preparers for their 2004 taxes: 50.5%
Here:
50%
State:
49%
(% for various income ranges: 48.9% for AGIs below $10k, 48.5% for AGIs $10k-25k, 52.3% for AGIs $25k-50k, 51.8% for AGIs $50k-75k, 43.9% for AGIs $75k-100k, 69.6% for AGIs over 100k)
Household received Food Stamps/SNAP in the past 12 months: 95 Household did not receive Food Stamps/SNAP in the past 12 months: 560
Women who had a birth in the past 12 months: 29 (0 now married, 26 unmarried) Women who did not have a birth in the past 12 months: 286 (239 now married, 44 unmarried)
Housing units in zip code 99029 with a mortgage: 301 (21 second mortgage, 21 both second mortgage and home equity loan) Houses without a mortgage: 2
Median monthly owner costs for units with a mortgage: $1,732 Median monthly owner costs for units without a mortgage: $479
Residents with income below the poverty level in 2022:
This zip code:
15.0%
Whole state:
10.0%
Residents with income below 50% of the poverty level in 2022:
This zip code:
11.8%
Whole state:
4.6%
Median number of rooms in houses and condos:
Here:
7.1
State:
6.5
Median number of rooms in apartments:
Here:
5.3
State:
3.9
Notable locations in this zip code not listed on our city pages
In group quarters: 66 (-1 institutionalized population)
Size of family households: 306 2-persons, 57 3-persons, 111 4-persons, 43 5-persons, 10 6-persons
Size of nonfamily households: 112 1-person, 7 2-persons
343 married couples with children.
77 single-parent households (77 women).
91.3% of residents of 99029 zip code speak English at home.
3.8% of residents speak Spanish at home (100% very well).
1.9% of residents speak other Indo-European language at home (100% very well).
1.9% of residents speak Asian or Pacific Island language at home (100% well).
Foreign born population: 60 (3.4%) (12.1% of them are naturalized citizens)
This zip code:
3.4%
Whole state:
15.3%
21%Bolivia
10%Sweden
10%United Kingdom, excluding England and Scotland
10%Iran
49%American
27%German
6%Irish
3%European
3%Dutch
3%English
2%Scandinavian
Year of entry for the foreign-born population
222010 or later
132000 to 2009
71990 to 1999
19Before 1990
Facilities with environmental interests located in this zip code:
CHEVRON USA INC REARDAN BULK P (HWY 2 in REARDAN, WA)
(Resource Conservation and Recovery Act (tracking hazardous waste)) Organizations: CHEVRON PRODUCTS CO (CONTACT/OWNER)
Housing units lacking complete plumbing facilities: 8.0% Housing units lacking complete kitchen facilities: 5.3%
46.7%Electricity
26.7%Utility gas
10.0%Wood
9.4%Other fuel
3.7%Bottled, tank, or LP gas
3.2%Fuel oil, kerosene, etc.
0.8%Solar energy
Population in 1990: 1,072. Population change in the 1990s: +269 (+25.1%).
Place of birth for U.S.-born residents:
This state: 1,274
Northeast: 6
Midwest: 37
South: 74
West: 304
53% of the 99029 zip code residents lived in the same house 5 years ago. Out of people who lived in different houses, 30% lived in this county. Out of people who lived in different counties, 50% lived in Washington.
95% of the 99029 zip code residents lived in the same house 1 year ago. Out of people who lived in different houses, 23% moved from this county. Out of people who lived in different houses, 79% moved from different county within same state. Out of people who lived in different houses, 12% moved from different state.
Private vs. public school enrollment:
Students in private schools in grades 1 to 8 (elementary and middle school):
Here:
0.0%
Washington:
12.4%
Students in private schools in grades 9 to 12 (high school):
Here:
0.0%
Washington:
9.2%
Students in private undergraduate colleges: 58
Here:
77.6%
Washington:
16.5%
Occupation by median earnings in the past 12 months ($)
90,983Computer and mathematical occupations
51,122Construction and extraction occupations
50,194Sales and related occupations
40,738Community and social service occupations
34,739Management occupations
33,552Office and administrative support occupations
Companies with federal contracts located in this zip code:
REARDAN GRAIN GROWERS INC (N125 ASPEN ST HIGHWAY 2 in REARDAN, WA) 10 employees, $0 revenue: $248,000 in 4 contractsin 2000
$66,000 with Agricultural Stabilization and Conservation Service (disused code) for Miscellaneous Crude Agricultural and Forestry Products. Signed on 2000-03-15. Completion date: 2000-09-15.
$66,000, same as above.Signed on 2000-03-15. Completion date: 2000-09-15.
$66,000, same as above.Signed on 2000-03-15. Completion date: 2000-09-15.
$50,000, same as above.Signed on 2000-03-15. Completion date: 2000-09-15.
EVERGREEN METAL SALES INC (4110 COULEE-HITE RD in REARDAN, WA; small business) : $135,290 in 5 contractsfrom 2004 to 2006
Contracts for Hardware, Commercial, Vehicular Cab, Body, and Frame Structural Components, Plate, Sheet, Strip, Foil; and Leaf, Hose, Pipe, Tube, Lubrication, and Railing Fittings, and moreby Navy, Defense Logistics Agency Signed by year:2000: $0; 2001: $0; 2002: $0; 2003: $0; 2004: $31,062; 2005: $2,888; 2006: $101,340.
Biggest contracts:
$99,750 with Navy for Hardware, Commercial. Signed on 2006-03-22. Completion date: 2006-06-21.
$30,078 with Defense Logistics Agency for Vehicular Cab, Body, and Frame Structural Components. Signed on 2004-06-04. Completion date: 2004-08-03.
$2,888 with Navy for Plate, Sheet, Strip, Foil; and Leaf. Signed on 2005-05-14. Completion date: 2005-06-03.
$1,590 with Navy for Hose, Pipe, Tube, Lubrication, and Railing Fittings. Signed on 2006-02-15. Completion date: 2006-03-15.
MARSHALLEE COMPANY (4110 N COULEE-HITE RD in REARDAN, WA; small business)
$3,067 with Defense Logistics Agency for Miscellaneous Power Transmission Equipment. Signed on 2006-04-28. Completion date: 2006-07-26.
Top industries in this zip code by the number of employees in 2005:
Wholesale Trade: Grain and Field Bean Merchant Wholesalers (1-4 employees: 5 establishments)
Other Services (except Public Administration): Religious Organizations (5-9: 1, 1-4: 1)
Professional, Scientific, and Technical Services: Veterinary Services (5-9: 1)
Accommodation and Food Services: Limited-Service Restaurants (5-9: 1)
Finance and Insurance: Insurance Agencies and Brokerages (1-4: 1)
Construction: Residential Remodelers (1-4: 1)
Construction: Poured Concrete Foundation and Structure Contractors (1-4: 1)
Home Mortgage Disclosure Act Aggregated Statistics For Year 2009 (Based on 2 partial tracts)
A) FHA, FSA/RHS & VA Home Purchase Loans
B) Conventional Home Purchase Loans
C) Refinancings
D) Home Improvement Loans
E) Loans on Dwellings For 5+ Families
F) Non-occupant Loans on < 5 Family Dwellings (A B C & D)
G) Loans On Manufactured Home Dwelling (A B C & D)
Number
Average Value
Number
Average Value
Number
Average Value
Number
Average Value
Number
Average Value
Number
Average Value
Number
Average Value
LOANS ORIGINATED
18
$232,731
12
$227,559
164
$198,404
12
$99,172
1
$148,080
3
$302,867
41
$146,497
APPLICATIONS APPROVED, NOT ACCEPTED
1
$325,010
2
$121,130
19
$196,586
2
$35,660
0
$0
0
$0
3
$114,323
APPLICATIONS DENIED
5
$268,062
4
$197,210
38
$218,290
4
$84,655
0
$0
0
$0
15
$171,921
APPLICATIONS WITHDRAWN
1
$120,860
4
$219,392
39
$192,550
3
$153,520
0
$0
0
$0
7
$128,090
FILES CLOSED FOR INCOMPLETENESS
0
$0
1
$76,220
5
$245,416
1
$36,470
0
$0
0
$0
1
$36,470
Aggregated Statistics For Year 2008 (Based on 2 partial tracts)
A) FHA, FSA/RHS & VA Home Purchase Loans
B) Conventional Home Purchase Loans
C) Refinancings
D) Home Improvement Loans
F) Non-occupant Loans on < 5 Family Dwellings (A B C & D)
G) Loans On Manufactured Home Dwelling (A B C & D)
Number
Average Value
Number
Average Value
Number
Average Value
Number
Average Value
Number
Average Value
Number
Average Value
LOANS ORIGINATED
10
$219,448
26
$239,117
105
$196,114
20
$107,084
3
$217,033
36
$154,716
APPLICATIONS APPROVED, NOT ACCEPTED
1
$196,530
2
$286,355
16
$215,991
1
$16,880
1
$227,010
2
$101,260
APPLICATIONS DENIED
2
$121,400
4
$282,408
47
$216,799
6
$93,908
2
$234,910
16
$122,082
APPLICATIONS WITHDRAWN
2
$341,340
4
$195,302
22
$204,793
1
$198,160
2
$89,555
7
$122,334
FILES CLOSED FOR INCOMPLETENESS
0
$0
1
$22,860
6
$245,343
1
$108,880
1
$35,930
2
$179,925
Aggregated Statistics For Year 2007 (Based on 2 partial tracts)
A) FHA, FSA/RHS & VA Home Purchase Loans
B) Conventional Home Purchase Loans
C) Refinancings
D) Home Improvement Loans
F) Non-occupant Loans on < 5 Family Dwellings (A B C & D)
G) Loans On Manufactured Home Dwelling (A B C & D)
Number
Average Value
Number
Average Value
Number
Average Value
Number
Average Value
Number
Average Value
Number
Average Value
LOANS ORIGINATED
11
$184,007
55
$213,741
93
$191,237
25
$81,377
9
$240,322
43
$148,583
APPLICATIONS APPROVED, NOT ACCEPTED
0
$0
11
$221,571
14
$199,367
3
$157,693
3
$225,020
4
$167,812
APPLICATIONS DENIED
1
$139,910
15
$206,327
56
$174,762
7
$96,203
6
$157,877
23
$126,609
APPLICATIONS WITHDRAWN
3
$179,107
4
$209,595
33
$184,568
2
$166,585
2
$214,220
11
$123,875
FILES CLOSED FOR INCOMPLETENESS
0
$0
2
$161,140
7
$190,151
1
$20,690
0
$0
1
$110,510
Aggregated Statistics For Year 2006 (Based on 2 partial tracts)
A) FHA, FSA/RHS & VA Home Purchase Loans
B) Conventional Home Purchase Loans
C) Refinancings
D) Home Improvement Loans
F) Non-occupant Loans on < 5 Family Dwellings (A B C & D)
G) Loans On Manufactured Home Dwelling (A B C & D)
Number
Average Value
Number
Average Value
Number
Average Value
Number
Average Value
Number
Average Value
Number
Average Value
LOANS ORIGINATED
8
$181,761
70
$181,293
88
$168,950
19
$92,949
8
$165,634
38
$126,029
APPLICATIONS APPROVED, NOT ACCEPTED
2
$145,625
8
$152,772
14
$164,292
4
$97,855
0
$0
8
$111,330
APPLICATIONS DENIED
0
$0
14
$151,654
55
$145,107
12
$73,630
3
$132,290
29
$107,228
APPLICATIONS WITHDRAWN
1
$126,850
7
$187,896
35
$156,181
3
$97,447
0
$0
5
$117,918
FILES CLOSED FOR INCOMPLETENESS
0
$0
1
$15,790
13
$153,353
0
$0
1
$113,780
2
$97,720
Aggregated Statistics For Year 2005 (Based on 2 partial tracts)
A) FHA, FSA/RHS & VA Home Purchase Loans
B) Conventional Home Purchase Loans
C) Refinancings
D) Home Improvement Loans
F) Non-occupant Loans on < 5 Family Dwellings (A B C & D)
G) Loans On Manufactured Home Dwelling (A B C & D)
Number
Average Value
Number
Average Value
Number
Average Value
Number
Average Value
Number
Average Value
Number
Average Value
LOANS ORIGINATED
11
$190,936
66
$154,964
85
$136,901
17
$91,043
10
$146,770
39
$120,257
APPLICATIONS APPROVED, NOT ACCEPTED
1
$75,670
10
$103,926
15
$164,735
3
$136,463
3
$82,567
6
$113,780
APPLICATIONS DENIED
3
$139,003
18
$131,593
49
$131,545
10
$69,248
5
$117,700
28
$95,620
APPLICATIONS WITHDRAWN
2
$117,865
7
$112,924
37
$157,288
5
$102,238
4
$167,268
15
$101,005
FILES CLOSED FOR INCOMPLETENESS
0
$0
0
$0
13
$135,221
0
$0
1
$71,860
2
$118,135
Aggregated Statistics For Year 2004 (Based on 2 partial tracts)
A) FHA, FSA/RHS & VA Home Purchase Loans
B) Conventional Home Purchase Loans
C) Refinancings
D) Home Improvement Loans
F) Non-occupant Loans on < 5 Family Dwellings (A B C & D)
G) Loans On Manufactured Home Dwelling (A B C & D)
Number
Average Value
Number
Average Value
Number
Average Value
Number
Average Value
Number
Average Value
Number
Average Value
LOANS ORIGINATED
15
$128,479
57
$137,294
91
$135,998
15
$52,045
7
$124,511
34
$104,973
APPLICATIONS APPROVED, NOT ACCEPTED
2
$146,715
6
$132,470
11
$131,151
1
$20,690
1
$79,480
7
$102,659
APPLICATIONS DENIED
3
$125,757
16
$118,475
64
$127,288
10
$28,744
7
$88,581
25
$95,510
APPLICATIONS WITHDRAWN
0
$0
5
$172,358
22
$137,783
2
$47,635
1
$242,260
5
$117,154
FILES CLOSED FOR INCOMPLETENESS
0
$0
0
$0
11
$130,953
1
$96,900
1
$173,120
2
$62,605
Aggregated Statistics For Year 2003 (Based on 2 partial tracts)
A) FHA, FSA/RHS & VA Home Purchase Loans
B) Conventional Home Purchase Loans
C) Refinancings
D) Home Improvement Loans
E) Loans on Dwellings For 5+ Families
F) Non-occupant Loans on < 5 Family Dwellings (A B C & D)
Number
Average Value
Number
Average Value
Number
Average Value
Number
Average Value
Number
Average Value
Number
Average Value
LOANS ORIGINATED
9
$150,920
42
$135,841
269
$125,971
8
$24,906
1
$60,430
7
$102,347
APPLICATIONS APPROVED, NOT ACCEPTED
0
$0
8
$134,059
36
$127,269
3
$14,517
0
$0
2
$62,605
APPLICATIONS DENIED
2
$68,320
14
$102,814
68
$118,287
2
$28,580
0
$0
4
$91,460
APPLICATIONS WITHDRAWN
1
$235,730
5
$98,972
43
$131,542
2
$58,795
0
$0
1
$85,470
FILES CLOSED FOR INCOMPLETENESS
0
$0
0
$0
8
$128,002
0
$0
0
$0
0
$0
Aggregated Statistics For Year 2002 (Based on 2 partial tracts)
A) FHA, FSA/RHS & VA Home Purchase Loans
B) Conventional Home Purchase Loans
C) Refinancings
D) Home Improvement Loans
F) Non-occupant Loans on < 5 Family Dwellings (A B C & D)
Number
Average Value
Number
Average Value
Number
Average Value
Number
Average Value
Number
Average Value
LOANS ORIGINATED
12
$135,510
41
$123,645
186
$126,711
11
$29,942
6
$91,097
APPLICATIONS APPROVED, NOT ACCEPTED
1
$43,010
11
$117,492
24
$140,024
3
$35,387
1
$14,150
APPLICATIONS DENIED
1
$151,890
11
$80,374
54
$114,687
4
$26,130
2
$115,415
APPLICATIONS WITHDRAWN
0
$0
4
$190,132
33
$125,295
0
$0
2
$104,525
FILES CLOSED FOR INCOMPLETENESS
0
$0
2
$61,790
7
$117,280
0
$0
0
$0
Aggregated Statistics For Year 2001 (Based on 2 partial tracts)
A) FHA, FSA/RHS & VA Home Purchase Loans
B) Conventional Home Purchase Loans
C) Refinancings
D) Home Improvement Loans
F) Non-occupant Loans on < 5 Family Dwellings (A B C & D)
Number
Average Value
Number
Average Value
Number
Average Value
Number
Average Value
Number
Average Value
LOANS ORIGINATED
11
$115,907
48
$119,371
140
$117,015
9
$43,129
5
$82,096
APPLICATIONS APPROVED, NOT ACCEPTED
0
$0
7
$76,839
21
$127,779
2
$31,030
2
$105,885
APPLICATIONS DENIED
1
$33,750
19
$61,889
38
$115,943
5
$25,586
3
$84,563
APPLICATIONS WITHDRAWN
1
$64,780
7
$104,214
21
$104,499
2
$17,150
2
$74,585
FILES CLOSED FOR INCOMPLETENESS
0
$0
2
$103,710
4
$125,485
1
$9,800
0
$0
Aggregated Statistics For Year 2000 (Based on 2 partial tracts)
A) FHA, FSA/RHS & VA Home Purchase Loans
B) Conventional Home Purchase Loans
C) Refinancings
D) Home Improvement Loans
F) Non-occupant Loans on < 5 Family Dwellings (A B C & D)
Number
Average Value
Number
Average Value
Number
Average Value
Number
Average Value
Number
Average Value
LOANS ORIGINATED
16
$119,462
45
$110,683
45
$106,436
16
$16,740
3
$51,717
APPLICATIONS APPROVED, NOT ACCEPTED
1
$117,050
8
$132,561
11
$121,154
4
$20,822
1
$63,150
APPLICATIONS DENIED
1
$60,430
17
$94,213
53
$98,968
13
$25,462
2
$51,990
APPLICATIONS WITHDRAWN
2
$90,645
9
$122,248
13
$98,285
2
$71,590
1
$42,460
FILES CLOSED FOR INCOMPLETENESS
0
$0
1
$128,480
5
$103,436
0
$0
0
$0
Aggregated Statistics For Year 1999 (Based on 1 partial tract)
A) FHA, FSA/RHS & VA Home Purchase Loans
B) Conventional Home Purchase Loans
C) Refinancings
D) Home Improvement Loans
F) Non-occupant Loans on < 5 Family Dwellings (A B C & D)
Detailed PMIC statistics for the following Tracts:0104.02
2002 - 2018 National Fire Incident Reporting System (NFIRS) incidents
According to the data from the years 2002 - 2018 the average number of fires per year is 17. The highest number of fires - 38 took place in 2004, and the least - 3 in 2016. The data has an increasing trend.
When looking into fire subcategories, the most reports belonged to: Outside Fires (68.1%), and Structure Fires (18.4%).
Fire incident types reported to NFIRS in Zip Code 99029


 Nearest zip codes: 99022, 99034, 99011, 99013, 99008, 99026.


 According to the data from the years 2002 - 2018 the average number of fires per year is 17. The highest number of fires - 38 took place in 2004, and the least - 3 in 2016. The data has an increasing trend.
 When looking into fire subcategories, the most reports belonged to: Outside Fires (68.1%), and Structure Fires (18.4%).