Estimated zip code population in 2022: 9,125 Zip code population in 2010: 8,820 Zip code population in 2000: 7,304
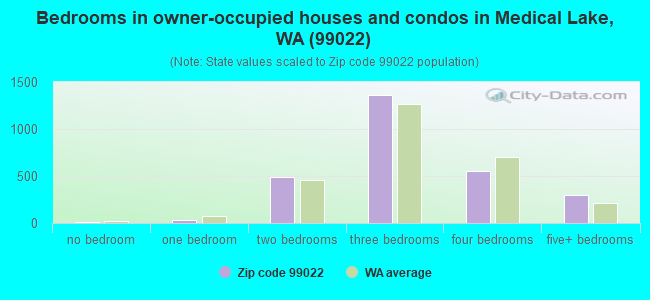
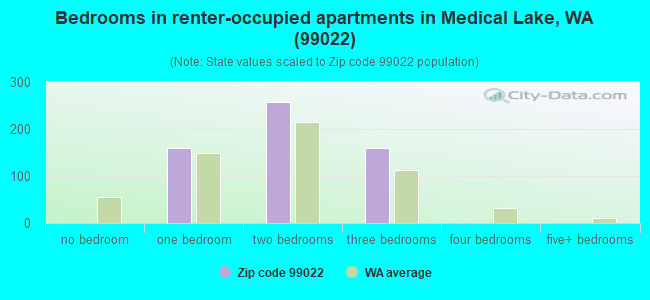
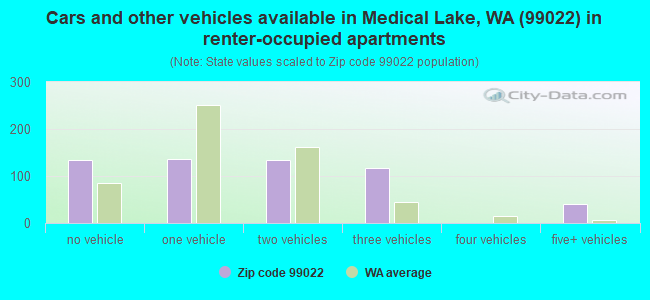
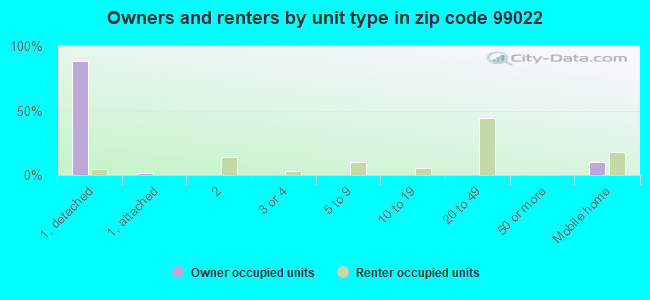
Houses and condos: 3,413 Renter-occupied apartments: 578
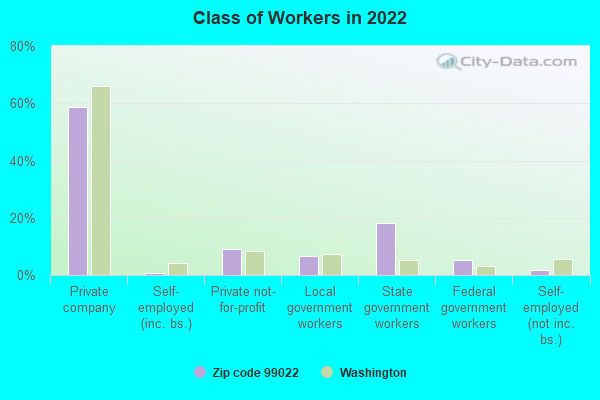
% of renters here:
17%
State:
36%
March 2022 cost of living index in zip code 99022: 92.7 (less than average, U.S. average is 100)
Land area: 69.0 sq. mi. Water area: 1.8 sq. mi.
Population density: 132 people per square mile
(very low).
OSM Map
General Map
Google Map
MSN Map
OSM Map
General Map
Google Map
MSN Map
OSM Map
General Map
Google Map
MSN Map
OSM Map
General Map
Google Map
MSN Map
Please wait while loading the map...
Real estate property taxes paid for housing units in 2022:
This zip code:
0.8% ($2,795)
Washington:
0.8% ($4,283)
Median real estate property taxes paid for housing units with mortgages in 2022: $2,835 (0.7%) Median real estate property taxes paid for housing units with no mortgage in 2022: $2,661 (0.9%)
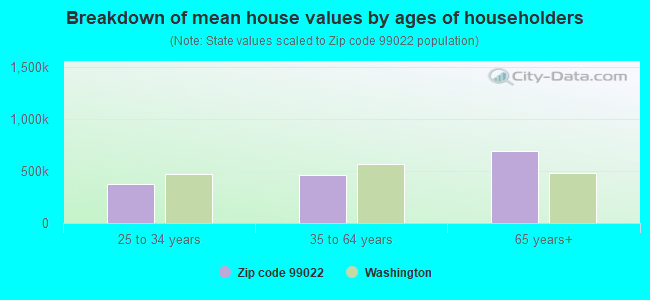
Estimated median house/condo value in 2022: $361,501
99022:
$361,501
Washington:
$569,500
According to our research of Washington and other state lists, there were 3 registered sex offenders living in 99022 zip code as of April 27, 2024. The ratio of all residents to sex offenders in zip code 99022 is 3,006 to 1. The ratio of registered sex offenders to all residents in this zip code is much lower than the state average.
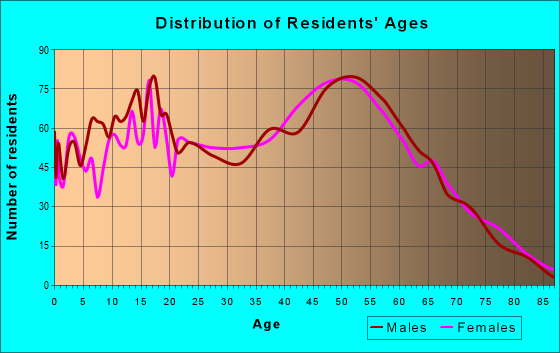
Median resident age:
This zip code:
41.0 years
Washington median age:
38.4 years
Average household size:
This zip code:
2.6 people
Washington:
2.5 people
Averages for the 2020 tax year for zip code 99022, filed in 2021:
Average Adjusted Gross Income (AGI) in 2020: $64,430 (Individual Income Tax Returns)
Here:
$64,430
State:
$99,264
Salary/wage: $54,921 (reported on 80.4% of returns)
Here:
$54,921
State:
$80,347
(% of AGI for various income ranges: 1133.5% for AGIs below $25k, 3340.1% for AGIs $25k-50k, 5699.1% for AGIs $50k-75k, 8430.5% for AGIs $75k-100k, 15750.0% for AGIs $100k-200k, 46765.0% for AGIs over 200k)
Taxable interest for individuals: $977 (reported on 35.6% of returns)
This zip code:
$977
Washington:
$2,077
(% of AGI for various income ranges: 24.5% for AGIs below $25k, 28.0% for AGIs $25k-50k, 35.5% for AGIs $50k-75k, 45.1% for AGIs $75k-100k, 132.1% for AGIs $100k-200k, 245.0% for AGIs over 200k)
Ordinary dividends: $3,253 (reported on 14.6% of returns)
Here:
$3,253
State:
$10,013
(% of AGI for various income ranges: 19.9% for AGIs below $25k, 22.7% for AGIs $25k-50k, 42.1% for AGIs $50k-75k, 43.8% for AGIs $75k-100k, 205.0% for AGIs $100k-200k, 980.0% for AGIs over 200k)
Net capital gain/loss in AGI: +$12,590 (reported on 13.7% of returns)
Here:
+$12,590
State:
+$40,092
(% of AGI for various income ranges: 11.1% for AGIs below $25k, 23.4% for AGIs $25k-50k, 110.8% for AGIs $50k-75k, 71.6% for AGIs $75k-100k, 501.4% for AGIs $100k-200k, 10077.5% for AGIs over 200k)
Profit/loss from business: +$7,630 (reported on 9.4% of returns)
Here:
+$7,630
State:
+$18,312
(% of AGI for various income ranges: 21.5% for AGIs below $25k, 59.2% for AGIs $25k-50k, 78.5% for AGIs $50k-75k, 148.6% for AGIs $75k-100k, 321.0% for AGIs $100k-200k)
Taxable individual retirement arrangement distribution: $15,044 (reported on 8.5% of returns)
99022:
$15,044
Washington:
$24,221
(% of AGI for various income ranges: 62.2% for AGIs below $25k, 66.8% for AGIs $25k-50k, 149.2% for AGIs $50k-75k, 201.6% for AGIs $75k-100k, 651.0% for AGIs $100k-200k)
Total itemized deductions: $31,455 (reported on 5.2% of returns)
Here:
$31,455
State:
$39,068
(% of AGI for various income ranges: 119.9% for AGIs $25k-50k, 170.8% for AGIs $50k-75k, 275.4% for AGIs $75k-100k, 514.8% for AGIs $100k-200k, 4237.5% for AGIs over 200k)
Charity contributions: $10,071 (reported on 4.0% of returns)
Here:
$10,071
State:
$15,331
(% of AGI for various income ranges: 14.3% for AGIs below $25k, 40.6% for AGIs $50k-75k, 66.2% for AGIs $75k-100k, 119.3% for AGIs $100k-200k, 1585.0% for AGIs over 200k)
Taxes paid: $5,895 (reported on 5.0% of returns)
99022:
$5,895
State:
$7,774
(% of AGI for various income ranges: 14.7% for AGIs $25k-50k, 29.6% for AGIs $50k-75k, 44.1% for AGIs $75k-100k, 115.7% for AGIs $100k-200k, 730.0% for AGIs over 200k)
Earned income credit: $2,243 (reported on 11.6% of returns)
Here:
$2,243
State:
$2,020
(% of AGI for various income ranges: 67.6% for AGIs below $25k, 57.4% for AGIs $25k-50k)
Percentage of individuals using paid preparers for their 2020 taxes: 92.9%
Here:
93%
State:
93%
(% for various income ranges: 93.4% for AGIs below $25k, 93.0% for AGIs $25k-50k, 93.0% for AGIs $50k-75k, 92.3% for AGIs $75k-100k, 92.6% for AGIs $100k-200k, 91.7% for AGIs over 200k)
Averages for the 2012 tax year for zip code 99022, filed in 2013:
Average Adjusted Gross Income (AGI) in 2012: $51,672 (Individual Income Tax Returns)
Here:
$51,672
State:
$69,533
Salary/wage: $44,725 (reported on 83.0% of returns)
Here:
$44,725
State:
$57,267
(% of AGI for various income ranges: 74.1% for AGIs below $25k, 75.9% for AGIs $25k-50k, 72.5% for AGIs $50k-75k, 72.2% for AGIs $75k-100k, 75.5% for AGIs $100k-200k, 35.5% for AGIs over 200k)
Taxable interest for individuals: $1,300 (reported on 35.5% of returns)
This zip code:
$1,300
Washington:
$1,816
(% of AGI for various income ranges: 1.2% for AGIs below $25k, 0.6% for AGIs $25k-50k, 0.7% for AGIs $50k-75k, 0.8% for AGIs $75k-100k, 1.3% for AGIs $100k-200k, 0.8% for AGIs over 200k)
Ordinary dividends: $2,661 (reported on 15.6% of returns)
Here:
$2,661
State:
$8,163
(% of AGI for various income ranges: 1.3% for AGIs below $25k, 0.8% for AGIs $25k-50k, 0.5% for AGIs $50k-75k, 1.0% for AGIs $75k-100k, 0.9% for AGIs $100k-200k)
Net capital gain/loss in AGI: +$3,839 (reported on 13.0% of returns)
Here:
+$3,839
State:
+$21,568
(% of AGI for various income ranges: 0.5% for AGIs $50k-75k, 0.8% for AGIs $75k-100k, 2.7% for AGIs $100k-200k)
Profit/loss from business: +$4,822 (reported on 10.9% of returns)
Here:
+$4,822
State:
+$16,521
(% of AGI for various income ranges: 2.1% for AGIs below $25k, 1.1% for AGIs $25k-50k, 1.0% for AGIs $50k-75k, 0.4% for AGIs $75k-100k, 1.4% for AGIs $100k-200k)
Taxable individual retirement arrangement distribution: $11,891 (reported on 8.5% of returns)
99022:
$11,891
Washington:
$18,648
(% of AGI for various income ranges: 1.9% for AGIs below $25k, 1.5% for AGIs $25k-50k, 1.7% for AGIs $50k-75k, 1.6% for AGIs $75k-100k, 3.1% for AGIs $100k-200k)
Total itemized deductions: $18,627 (23% of AGI, reported on 28.6% of returns)
Here:
$18,627
State:
$23,872
Here:
23.0% of AGI
State:
18.2% of AGI
(% of AGI for various income ranges: 8.6% for AGIs below $25k, 9.6% for AGIs $25k-50k, 9.1% for AGIs $50k-75k, 10.4% for AGIs $75k-100k, 11.8% for AGIs $100k-200k, 12.0% for AGIs over 200k)
Charity contributions: $3,394 (reported on 21.0% of returns)
Here:
$3,394
State:
$4,465
(% of AGI for various income ranges: 0.8% for AGIs below $25k, 0.9% for AGIs $25k-50k, 1.2% for AGIs $50k-75k, 1.5% for AGIs $75k-100k, 1.7% for AGIs $100k-200k, 2.3% for AGIs over 200k)
Taxes paid: $4,296 (reported on 28.4% of returns)
99022:
$4,296
State:
$6,400
(% of AGI for various income ranges: 1.7% for AGIs below $25k, 1.8% for AGIs $25k-50k, 2.1% for AGIs $50k-75k, 2.5% for AGIs $75k-100k, 3.1% for AGIs $100k-200k, 2.2% for AGIs over 200k)
Earned income credit: $2,037 (reported on 15.1% of returns)
Here:
$2,037
State:
$2,073
(% of AGI for various income ranges: 5.0% for AGIs below $25k, 1.0% for AGIs $25k-50k)
Percentage of individuals using paid preparers for their 2012 taxes: 35.5%
Here:
36%
State:
43%
(% for various income ranges: 31.4% for AGIs below $25k, 33.3% for AGIs $25k-50k, 37.7% for AGIs $50k-75k, 40.4% for AGIs $75k-100k, 40.5% for AGIs $100k-200k, 75.0% for AGIs over 200k)
Averages for the 2004 tax year for zip code 99022, filed in 2005:
Average Adjusted Gross Income (AGI) in 2004: $40,468 (Individual Income Tax Returns)
Here:
$40,468
State:
$54,331
Salary/wage: $36,658 (reported on 87.2% of returns)
Here:
$36,658
State:
$45,761
(% of AGI for various income ranges: 173.5% for AGIs below $10k, 75.9% for AGIs $10k-25k, 80.3% for AGIs $25k-50k, 78.7% for AGIs $50k-75k, 79.8% for AGIs $75k-100k, 72.6% for AGIs over 100k)
Taxable interest for individuals: $911 (reported on 44.9% of returns)
This zip code:
$911
Washington:
$2,110
(% of AGI for various income ranges: 6.4% for AGIs below $10k, 1.9% for AGIs $10k-25k, 0.9% for AGIs $25k-50k, 0.7% for AGIs $50k-75k, 0.8% for AGIs $75k-100k, 1.0% for AGIs over 100k)
Taxable dividends: $1,505 (reported on 17.8% of returns)
Here:
$1,505
State:
$5,879
(% of AGI for various income ranges: 1.2% for AGIs below $10k, 0.8% for AGIs $10k-25k, 0.5% for AGIs $25k-50k, 0.7% for AGIs $50k-75k, 0.4% for AGIs $75k-100k, 1.1% for AGIs over 100k)
Net capital gain/loss: +$5,527 (reported on 15.4% of returns)
Here:
+$5,527
State:
+$15,835
(% of AGI for various income ranges: -1.4% for AGIs below $10k, -0.1% for AGIs $10k-25k, 0.3% for AGIs $25k-50k, 0.9% for AGIs $50k-75k, 1.5% for AGIs $75k-100k, 8.3% for AGIs over 100k)
Profit/loss from business: +$6,764 (reported on 10.8% of returns)
Here:
+$6,764
State:
+$13,994
(% of AGI for various income ranges: 5.1% for AGIs below $10k, 2.7% for AGIs $10k-25k, 2.5% for AGIs $25k-50k, 1.1% for AGIs $50k-75k, -0.2% for AGIs $75k-100k, 3.1% for AGIs over 100k)
IRA payment deduction: $3,125 (reported on 2.3% of returns)
99022:
$3,125
Washington:
$3,001
Total itemized deductions: $14,786 (22% of AGI, reported on 30.0% of returns)
Here:
$14,786
State:
$19,669
Here:
22.4% of AGI
State:
20.7% of AGI
(% of AGI for various income ranges: 11.4% for AGIs below $10k, 8.2% for AGIs $10k-25k, 12.0% for AGIs $25k-50k, 11.0% for AGIs $50k-75k, 11.7% for AGIs $75k-100k, 10.3% for AGIs over 100k)
Charity contributions deductions: $2,358 (3% of AGI, reported on 24.8% of returns)
Here:
$2,358
State:
$3,569
Here:
3.4% of AGI
State:
3.5% of AGI
(% of AGI for various income ranges: 0.9% for AGIs $10k-25k, 1.5% for AGIs $25k-50k, 1.5% for AGIs $50k-75k, 1.6% for AGIs $75k-100k, 1.6% for AGIs over 100k)
Total tax: $4,853 (reported on 76.4% of returns)
99022:
$4,853
State:
$9,065
(% of AGI for various income ranges: 2.6% for AGIs below $10k, 4.1% for AGIs $10k-25k, 6.3% for AGIs $25k-50k, 8.1% for AGIs $50k-75k, 10.0% for AGIs $75k-100k, 17.0% for AGIs over 100k)
Earned income credit: $1,638 (reported on 14.0% of returns)
Here:
$1,638
State:
$1,607
Percentage of individuals using paid preparers for their 2004 taxes: 40.4%
Here:
40%
State:
49%
(% for various income ranges: 26.8% for AGIs below $10k, 40.4% for AGIs $10k-25k, 43.0% for AGIs $25k-50k, 44.5% for AGIs $50k-75k, 42.7% for AGIs $75k-100k, 53.5% for AGIs over 100k)
Household received Food Stamps/SNAP in the past 12 months: 350 Household did not receive Food Stamps/SNAP in the past 12 months: 2,957
Women who had a birth in the past 12 months: 77 (80 now married, 0 unmarried) Women who did not have a birth in the past 12 months: 2,249 (1,086 now married, 1,160 unmarried)
Housing units in zip code 99022 with a mortgage: 1,966 (186 second mortgage, 18 home equity loan, 104 both second mortgage and home equity loan) Houses without a mortgage: 46
Median monthly owner costs for units with a mortgage: $1,679 Median monthly owner costs for units without a mortgage: $555
Residents with income below the poverty level in 2022:
This zip code:
5.8%
Whole state:
10.0%
Residents with income below 50% of the poverty level in 2022:
This zip code:
3.8%
Whole state:
4.6%
Median number of rooms in houses and condos:
Here:
6.6
State:
6.5
Median number of rooms in apartments:
Here:
4.0
State:
3.9
Notable locations in this zip code not listed on our city pages
Notable locations in zip code 99022: Spokane Plains Battlefield (A), Galena (B), Spokane County Fire District 10 Station 4 (C), Medical Lake Fire Department (D). Display/hide their locations on the map
Lakes and swamps: Medical Lake (A), Otter Lake (B), Page Pond (C), Ring Lake (D), Silver Lake (E), Duck Lake (F), Tule Pond (G), West Medical Lake (H). Display/hide their locations on the map
In group quarters: 577 (-1 institutionalized population)
Size of family households: 1,028 2-persons, 555 3-persons, 554 4-persons, 160 5-persons, 48 6-persons, 23 7-or-more-persons
Size of nonfamily households: 731 1-person, 184 2-persons
1,174 married couples with children.
502 single-parent households (262 men, 240 women).
89.6% of residents of 99022 zip code speak English at home.
4.6% of residents speak Spanish at home (89% very well, 9% well, 1% not well).
4.1% of residents speak other Indo-European language at home (52% very well, 47% well, 1% not well).
1.2% of residents speak Asian or Pacific Island language at home (37% very well, 31% well, 31% not well).
0.3% of residents speak other language at home (100% very well).
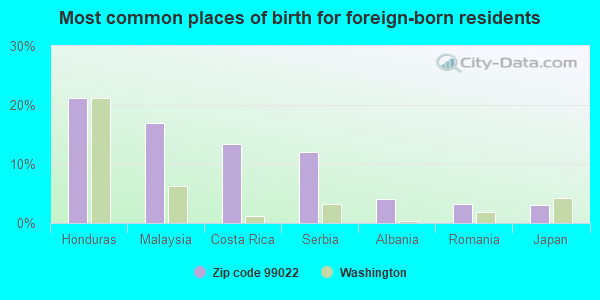
Foreign born population: 586 (6.4%) (79.0% of them are naturalized citizens)
This zip code:
6.4%
Whole state:
15.3%
21%Honduras
17%Malaysia
13%Costa Rica
12%Serbia
4%Albania
3%Romania
3%Japan
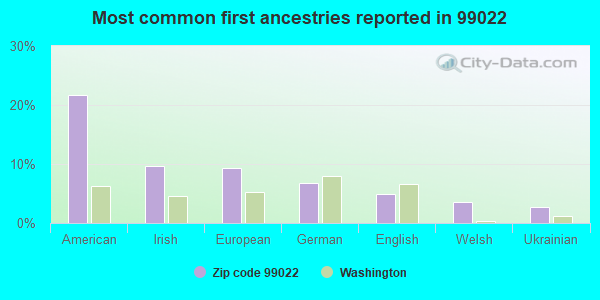
22%American
10%Irish
9%European
7%German
5%English
4%Welsh
3%Ukrainian
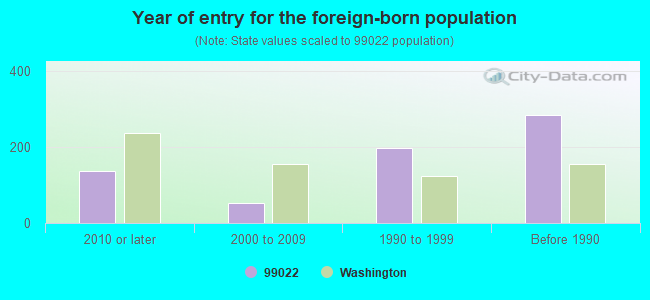
Year of entry for the foreign-born population
1362010 or later
532000 to 2009
1991990 to 1999
285Before 1990
Facilities with environmental interests located in this zip code:
CLEAR LAKE ACCESS ARE (S1 T23N R40E NE1/4 SE1/4 in MEDICAL LAKE, WA)
(Resource Conservation and Recovery Act (tracking hazardous waste)) Organizations: WA ECY (CONTACT/OWNER)
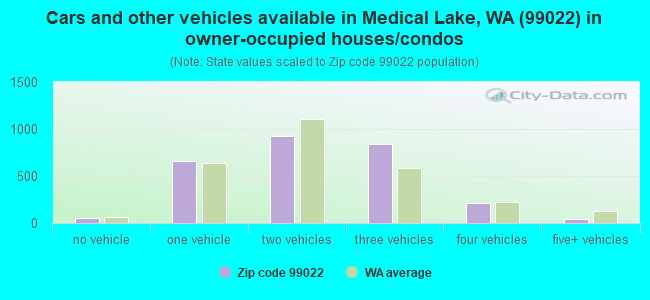
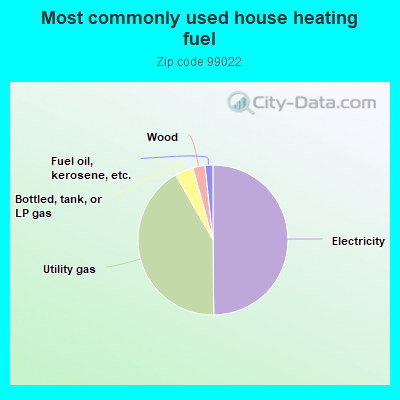
49.9%Electricity
41.9%Utility gas
4.0%Bottled, tank, or LP gas
2.6%Wood
1.7%Fuel oil, kerosene, etc.
Population in 1990: 6,436. Population change in the 1990s: +868 (+13.5%).
Place of birth for U.S.-born residents:
This state: 4,399
Northeast: 419
Midwest: 677
South: 947
West: 1,948
56% of the 99022 zip code residents lived in the same house 5 years ago. Out of people who lived in different houses, 56% lived in this county. Out of people who lived in different counties, 50% lived in Washington.
88% of the 99022 zip code residents lived in the same house 1 year ago. Out of people who lived in different houses, 69% moved from this county. Out of people who lived in different houses, 22% moved from different county within same state. Out of people who lived in different houses, 6% moved from different state.
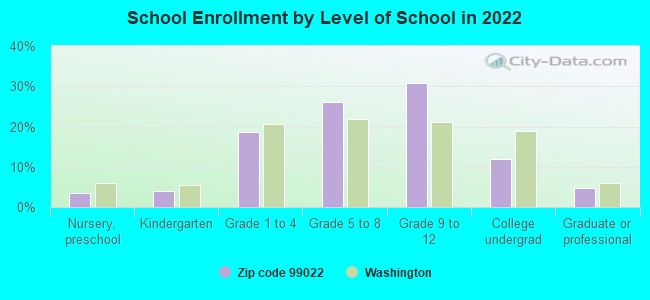
Private vs. public school enrollment:
Students in private schools in grades 1 to 8 (elementary and middle school): 15
Here:
1.9%
Washington:
12.4%
Students in private schools in grades 9 to 12 (high school): 61
Here:
11.1%
Washington:
9.2%
Students in private undergraduate colleges: 57
Here:
26.9%
Washington:
16.5%
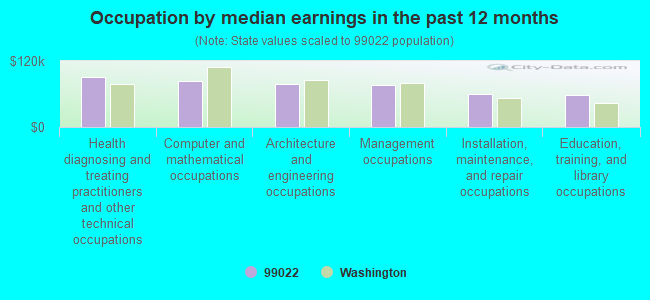
Occupation by median earnings in the past 12 months ($)
90,180Health diagnosing and treating practitioners and other technical occupations
82,795Computer and mathematical occupations
78,948Architecture and engineering occupations
77,245Management occupations
59,572Installation, maintenance, and repair occupations
58,700Education, training, and library occupations
Companies with federal contracts located in this zip code (MEDICAL LAKE, WA):
STILL, MELISSA (1318 N FAIRCHILD DR; small business) : $100,743 in 3 contractsfrom 2003 to 2005
$37,000 with Air Force for Other Administrative Support Services. Signed on 2005-10-01. Completion date: 2006-09-30.
$34,410, same as above.Signed on 2004-10-01. Completion date: 2005-09-30.
$29,333, same as above.Signed on 2003-10-31. Completion date: 2004-09-30.
PAINT CRAFTERS PLUS INC (16010 W JADE LN; small business)
$25,000 with Air Force for Construction of Structures and Facilities -- Other Airfield Structures. Signed on 2004-07-02. Completion date: 2004-07-16.
DIBARTOLO, LAURA L (13807 S FINNEY ST; small business) : $10,200 in 3 contractsfrom 2004 to 2005
$5,400 with Air Force for Other Professional Services. Signed on 2005-10-28. Completion date: 2006-09-30.
$4,800 with Air Force for Miscellaneous Items. Signed on 2004-10-01. Completion date: 2005-09-30.
$0 with Air Force for Other Professional Services. Signed on 2005-10-28. Completion date: 2006-09-30.
TRAYLOR BRENDA (602 E LAKE ST; small business) : $9,520 in 2 contractsfrom 2004 to 2005
$5,040 with Air Force for Other Professional Services. Signed on 2005-10-01. Completion date: 2006-09-30.
$4,480 with Air Force for Miscellaneous Items. Signed on 2004-10-01. Completion date: 2005-09-30.
HENDERSON LAHNIE (611 E LADD; small business) : $5,840 in 3 contractsfrom 2004 to 2006
$4,640 with Air Force for Chaplain Services. Signed on 2005-10-01. Completion date: 2006-09-30.
$4,560 with Air Force for Miscellaneous Items. Signed on 2004-10-01. Completion date: 2005-09-30.
-$3,360 with Air Force for Chaplain Services. Signed on 2006-01-18. Completion date: 2006-01-15.
MEDICAL LAKE SCHOOL DIST 326 (116 W 3RD ST)
$3,600 with Air Force for Lease or Rental of Facilities -- Schools. Signed on 2005-12-14. Completion date: 2006-05-31.
Top industries in this zip code by the number of employees in 2005:
Health Care and Social Assistance: General Medical and Surgical Hospitals (500-999 employees: 1 establishment)
Health Care and Social Assistance: Residential Mental Retardation Facilities (100-249: 1)
Health Care and Social Assistance: Child Day Care Services (20-49: 1, 10-19: 1)
Health Care and Social Assistance: Offices of Dentists (20-49: 1, 1-4: 1)
Construction: New Single-Family Housing Construction (except Operative Builders) (5-9: 2, 1-4: 3)
Accommodation and Food Services: Limited-Service Restaurants (5-9: 2, 1-4: 2)
Accommodation and Food Services: Snack and Nonalcoholic Beverage Bars (10-19: 1, 1-4: 1)
Professional, Scientific, and Technical Services: Veterinary Services (10-19: 1)
People in group quarters in 2010:
286 people in mental (psychiatric) hospitals and psychiatric units in other hospitals
226 people in nursing facilities/skilled-nursing facilities
146 people in state prisons
38 people in college/university student housing
19 people in correctional facilities intended for juveniles
2 people in group homes intended for adults
People in group quarters in 2000:
338 people in other types of correctional institutions
302 people in mental (psychiatric) hospitals or wards
56 people in short-term care, detention or diagnostic centers for delinquent children
27 people in homes for the mentally retarded
12 people in other noninstitutional group quarters
3 people in homes or halfway houses for drug/alcohol abuse
2 people in other nonhousehold living situations
Fatal accident statistics in 2014:
Fatal accident count: 1
Vehicles involved in fatal accidents: 3
Fatal accidents caused by drunken drivers: 0
Fatalities: 1
Persons involved in fatal accidents: 4
Pedestrians involved in fatal accidents: 0
Fatal accident statistics in 2010:
Fatal accident count: 1
Vehicles involved in fatal accidents: 1
Fatal accidents caused by drunken drivers: 1
Fatalities: 1
Persons involved in fatal accidents: 2
Pedestrians involved in fatal accidents: 0
Home Mortgage Disclosure Act Aggregated Statistics For Year 2009 (Based on 1 full and 8 partial tracts)
A) FHA, FSA/RHS & VA Home Purchase Loans
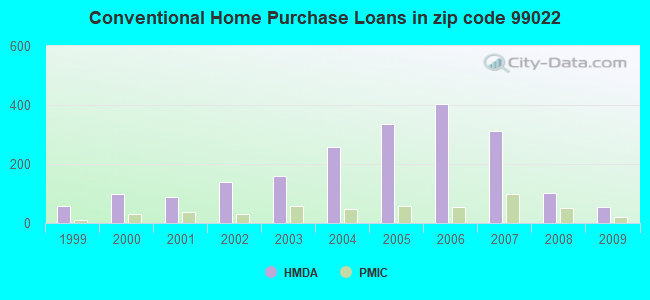
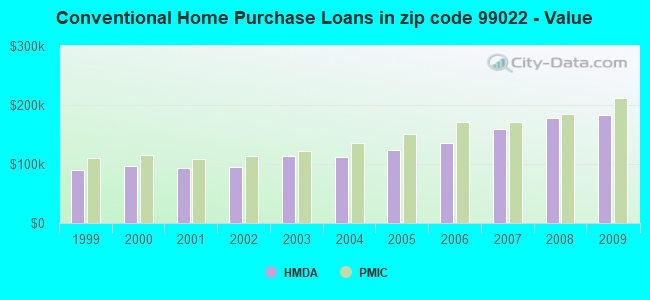
B) Conventional Home Purchase Loans
C) Refinancings
D) Home Improvement Loans
E) Loans on Dwellings For 5+ Families
F) Non-occupant Loans on < 5 Family Dwellings (A B C & D)
G) Loans On Manufactured Home Dwelling (A B C & D)
Number
Average Value
Number
Average Value
Number
Average Value
Number
Average Value
Number
Average Value
Number
Average Value
Number
Average Value
LOANS ORIGINATED
144
$184,567
55
$183,153
544
$170,420
25
$117,286
2
$2,723,245
29
$134,524
64
$136,773
APPLICATIONS APPROVED, NOT ACCEPTED
6
$186,708
5
$126,236
44
$182,238
4
$47,058
0
$0
4
$121,390
6
$123,872
APPLICATIONS DENIED
18
$166,127
13
$142,998
159
$177,086
17
$58,155
0
$0
6
$167,017
23
$126,055
APPLICATIONS WITHDRAWN
20
$190,542
14
$232,045
147
$175,726
2
$155,245
0
$0
4
$94,132
13
$146,656
FILES CLOSED FOR INCOMPLETENESS
1
$231,980
2
$272,515
29
$194,303
1
$225,720
0
$0
0
$0
3
$95,793
Aggregated Statistics For Year 2008 (Based on 1 full and 8 partial tracts)
A) FHA, FSA/RHS & VA Home Purchase Loans
B) Conventional Home Purchase Loans
C) Refinancings
D) Home Improvement Loans
E) Loans on Dwellings For 5+ Families
F) Non-occupant Loans on < 5 Family Dwellings (A B C & D)
G) Loans On Manufactured Home Dwelling (A B C & D)
Number
Average Value
Number
Average Value
Number
Average Value
Number
Average Value
Number
Average Value
Number
Average Value
Number
Average Value
LOANS ORIGINATED
128
$181,969
103
$177,355
335
$164,120
59
$62,078
3
$26,981,567
35
$137,785
54
$132,196
APPLICATIONS APPROVED, NOT ACCEPTED
12
$183,457
18
$187,765
42
$176,080
4
$181,808
0
$0
7
$158,966
8
$114,360
APPLICATIONS DENIED
13
$167,487
24
$171,670
160
$150,673
25
$53,520
2
$266,910
9
$135,263
28
$102,002
APPLICATIONS WITHDRAWN
12
$180,740
23
$192,750
99
$157,624
9
$129,261
1
$2,176,000
12
$153,708
20
$137,131
FILES CLOSED FOR INCOMPLETENESS
1
$130,390
7
$207,094
13
$162,311
2
$65,750
0
$0
1
$140,540
4
$131,325
Aggregated Statistics For Year 2007 (Based on 1 full and 8 partial tracts)
A) FHA, FSA/RHS & VA Home Purchase Loans
B) Conventional Home Purchase Loans
C) Refinancings
D) Home Improvement Loans
E) Loans on Dwellings For 5+ Families
F) Non-occupant Loans on < 5 Family Dwellings (A B C & D)
G) Loans On Manufactured Home Dwelling (A B C & D)
Number
Average Value
Number
Average Value
Number
Average Value
Number
Average Value
Number
Average Value
Number
Average Value
Number
Average Value
LOANS ORIGINATED
77
$188,167
312
$159,111
350
$156,576
72
$70,016
2
$550,595
81
$142,910
75
$143,232
APPLICATIONS APPROVED, NOT ACCEPTED
3
$143,447
48
$156,074
60
$143,013
9
$62,354
0
$0
15
$130,941
14
$148,724
APPLICATIONS DENIED
8
$149,714
70
$135,652
207
$142,010
40
$51,523
0
$0
35
$134,498
51
$125,880
APPLICATIONS WITHDRAWN
13
$164,665
34
$266,422
104
$161,688
8
$101,185
0
$0
4
$148,802
14
$138,559
FILES CLOSED FOR INCOMPLETENESS
1
$129,920
6
$142,300
25
$178,525
0
$0
0
$0
2
$105,405
2
$92,995
Aggregated Statistics For Year 2006 (Based on 1 full and 8 partial tracts)
A) FHA, FSA/RHS & VA Home Purchase Loans
B) Conventional Home Purchase Loans
C) Refinancings
D) Home Improvement Loans
E) Loans on Dwellings For 5+ Families
F) Non-occupant Loans on < 5 Family Dwellings (A B C & D)
G) Loans On Manufactured Home Dwelling (A B C & D)
Number
Average Value
Number
Average Value
Number
Average Value
Number
Average Value
Number
Average Value
Number
Average Value
Number
Average Value
LOANS ORIGINATED
88
$182,070
404
$136,198
298
$129,677
48
$61,984
3
$325,377
114
$139,673
58
$123,085
APPLICATIONS APPROVED, NOT ACCEPTED
6
$172,063
52
$130,581
42
$138,549
11
$38,909
0
$0
14
$171,241
14
$86,523
APPLICATIONS DENIED
11
$143,445
98
$126,213
160
$130,035
41
$55,600
1
$101,080
32
$138,044
39
$122,019
APPLICATIONS WITHDRAWN
18
$178,422
55
$136,995
134
$126,252
9
$66,006
0
$0
19
$138,118
9
$106,902
FILES CLOSED FOR INCOMPLETENESS
2
$139,555
7
$119,754
19
$132,611
0
$0
0
$0
1
$57,730
2
$86,700
Aggregated Statistics For Year 2005 (Based on 1 full and 8 partial tracts)
A) FHA, FSA/RHS & VA Home Purchase Loans
B) Conventional Home Purchase Loans
C) Refinancings
D) Home Improvement Loans
E) Loans on Dwellings For 5+ Families
F) Non-occupant Loans on < 5 Family Dwellings (A B C & D)
G) Loans On Manufactured Home Dwelling (A B C & D)
Number
Average Value
Number
Average Value
Number
Average Value
Number
Average Value
Number
Average Value
Number
Average Value
Number
Average Value
LOANS ORIGINATED
111
$156,800
337
$124,279
300
$120,086
53
$46,538
1
$83,390
101
$120,966
63
$101,863
APPLICATIONS APPROVED, NOT ACCEPTED
7
$146,101
38
$126,487
50
$130,512
9
$63,481
1
$74,800
11
$116,829
6
$105,907
APPLICATIONS DENIED
11
$135,538
62
$90,420
200
$104,987
37
$41,989
0
$0
25
$89,760
50
$74,922
APPLICATIONS WITHDRAWN
10
$149,016
37
$121,391
123
$140,822
14
$81,649
1
$51,200
6
$123,795
17
$107,911
FILES CLOSED FOR INCOMPLETENESS
1
$116,240
5
$120,152
48
$127,029
2
$14,940
0
$0
3
$102,173
2
$102,895
Aggregated Statistics For Year 2004 (Based on 1 full and 8 partial tracts)
A) FHA, FSA/RHS & VA Home Purchase Loans
B) Conventional Home Purchase Loans
C) Refinancings
D) Home Improvement Loans
E) Loans on Dwellings For 5+ Families
F) Non-occupant Loans on < 5 Family Dwellings (A B C & D)
G) Loans On Manufactured Home Dwelling (A B C & D)
Number
Average Value
Number
Average Value
Number
Average Value
Number
Average Value
Number
Average Value
Number
Average Value
Number
Average Value
LOANS ORIGINATED
90
$135,933
259
$112,636
290
$107,938
51
$42,636
2
$118,965
84
$89,309
56
$99,970
APPLICATIONS APPROVED, NOT ACCEPTED
2
$96,515
20
$115,894
51
$101,211
6
$42,303
0
$0
4
$104,500
7
$102,007
APPLICATIONS DENIED
12
$124,020
49
$101,780
201
$112,281
44
$30,934
0
$0
29
$89,136
31
$82,824
APPLICATIONS WITHDRAWN
9
$110,724
24
$104,589
93
$117,654
9
$104,910
0
$0
9
$80,313
11
$100,115
FILES CLOSED FOR INCOMPLETENESS
1
$71,260
10
$115,961
35
$141,031
1
$57,250
0
$0
3
$94,817
2
$68,265
Aggregated Statistics For Year 2003 (Based on 1 full and 8 partial tracts)
A) FHA, FSA/RHS & VA Home Purchase Loans
B) Conventional Home Purchase Loans
C) Refinancings
D) Home Improvement Loans
F) Non-occupant Loans on < 5 Family Dwellings (A B C & D)
Number
Average Value
Number
Average Value
Number
Average Value
Number
Average Value
Number
Average Value
LOANS ORIGINATED
92
$135,015
161
$112,833
712
$112,841
28
$30,445
50
$95,401
APPLICATIONS APPROVED, NOT ACCEPTED
1
$63,170
32
$95,674
89
$112,997
5
$11,962
4
$86,080
APPLICATIONS DENIED
10
$95,721
41
$89,397
173
$100,298
15
$16,065
7
$79,420
APPLICATIONS WITHDRAWN
12
$128,738
25
$107,406
106
$108,572
2
$36,870
5
$77,958
FILES CLOSED FOR INCOMPLETENESS
2
$62,160
4
$135,255
28
$98,187
0
$0
2
$86,935
Aggregated Statistics For Year 2002 (Based on 1 full and 8 partial tracts)
A) FHA, FSA/RHS & VA Home Purchase Loans
B) Conventional Home Purchase Loans
C) Refinancings
D) Home Improvement Loans
E) Loans on Dwellings For 5+ Families
F) Non-occupant Loans on < 5 Family Dwellings (A B C & D)
Number
Average Value
Number
Average Value
Number
Average Value
Number
Average Value
Number
Average Value
Number
Average Value
LOANS ORIGINATED
70
$118,191
139
$95,650
396
$105,898
29
$18,553
1
$1,456,000
42
$71,708
APPLICATIONS APPROVED, NOT ACCEPTED
2
$99,100
32
$73,385
41
$110,593
1
$53,860
0
$0
4
$80,042
APPLICATIONS DENIED
5
$156,186
19
$83,833
119
$89,836
10
$22,874
0
$0
4
$104,898
APPLICATIONS WITHDRAWN
4
$136,752
19
$82,309
78
$108,410
5
$18,404
0
$0
13
$81,172
FILES CLOSED FOR INCOMPLETENESS
2
$97,670
9
$99,656
11
$111,667
2
$5,340
0
$0
0
$0
Aggregated Statistics For Year 2001 (Based on 1 full and 8 partial tracts)
A) FHA, FSA/RHS & VA Home Purchase Loans
B) Conventional Home Purchase Loans
C) Refinancings
D) Home Improvement Loans
F) Non-occupant Loans on < 5 Family Dwellings (A B C & D)
Number
Average Value
Number
Average Value
Number
Average Value
Number
Average Value
Number
Average Value
LOANS ORIGINATED
65
$109,086
87
$93,909
294
$104,823
23
$27,618
13
$72,492
APPLICATIONS APPROVED, NOT ACCEPTED
5
$106,630
17
$81,001
41
$100,166
7
$15,926
5
$74,084
APPLICATIONS DENIED
12
$96,188
39
$64,900
116
$90,979
22
$19,543
9
$82,243
APPLICATIONS WITHDRAWN
7
$115,257
12
$110,837
83
$93,819
7
$29,253
2
$53,090
FILES CLOSED FOR INCOMPLETENESS
1
$65,200
1
$155,770
8
$111,039
2
$4,265
0
$0
Aggregated Statistics For Year 2000 (Based on 1 full and 8 partial tracts)
A) FHA, FSA/RHS & VA Home Purchase Loans
B) Conventional Home Purchase Loans
C) Refinancings
D) Home Improvement Loans
E) Loans on Dwellings For 5+ Families
F) Non-occupant Loans on < 5 Family Dwellings (A B C & D)
Number
Average Value
Number
Average Value
Number
Average Value
Number
Average Value
Number
Average Value
Number
Average Value
LOANS ORIGINATED
53
$107,469
99
$95,771
98
$93,468
47
$15,827
1
$59,640
17
$62,183
APPLICATIONS APPROVED, NOT ACCEPTED
2
$101,375
23
$80,501
20
$108,729
15
$19,731
0
$0
2
$119,880
APPLICATIONS DENIED
3
$104,550
41
$68,399
95
$81,529
33
$18,491
0
$0
4
$36,028
APPLICATIONS WITHDRAWN
8
$99,342
14
$114,441
36
$79,880
2
$49,210
0
$0
2
$19,160
FILES CLOSED FOR INCOMPLETENESS
0
$0
2
$43,710
13
$70,182
0
$0
0
$0
0
$0
Aggregated Statistics For Year 1999 (Based on 2 full and 3 partial tracts)
A) FHA, FSA/RHS & VA Home Purchase Loans
B) Conventional Home Purchase Loans
C) Refinancings
D) Home Improvement Loans
F) Non-occupant Loans on < 5 Family Dwellings (A B C & D)
2002 - 2018 National Fire Incident Reporting System (NFIRS) incidents
Based on the data from the years 2002 - 2018 the average number of fires per year is 49. The highest number of fires - 74 took place in 2005, and the least - 13 in 2002. The data has a growing trend.
When looking into fire subcategories, the most reports belonged to: Outside Fires (43.8%), and Structure Fires (41.0%).
Fire incident types reported to NFIRS in Zip Code 99022


 Nearest zip codes: 99011, 99001, 99029, 99224, 99004, 99020.


 Based on the data from the years 2002 - 2018 the average number of fires per year is 49. The highest number of fires - 74 took place in 2005, and the least - 13 in 2002. The data has a growing trend.
 When looking into fire subcategories, the most reports belonged to: Outside Fires (43.8%), and Structure Fires (41.0%).