Estimated zip code population in 2022: 1,124 Zip code population in 2010: 1,137 Zip code population in 2000: 942
Houses and condos: 450 Renter-occupied apartments: 76
% of renters here:
17%
State:
36%
March 2022 cost of living index in zip code 99031: 88.2 (less than average, U.S. average is 100)
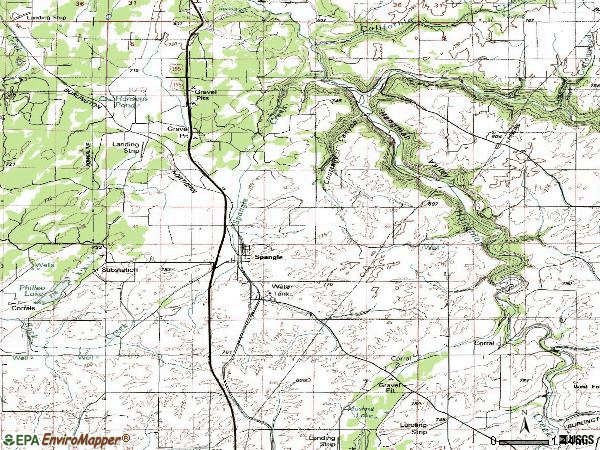
Land area: 71.0 sq. mi. Water area: 0.0 sq. mi.
Population density: 16 people per square mile
(very low).
OSM Map
General Map
Google Map
MSN Map
OSM Map
General Map
Google Map
MSN Map
OSM Map
General Map
Google Map
MSN Map
OSM Map
General Map
Google Map
MSN Map
Please wait while loading the map...
Real estate property taxes paid for housing units in 2022:
This zip code:
0.7% ($2,837)
Washington:
0.8% ($4,283)
Median real estate property taxes paid for housing units with mortgages in 2022: $3,453 (0.8%) Median real estate property taxes paid for housing units with no mortgage in 2022: $2,540 (0.7%)
Estimated median house/condo value in 2022: $398,554
99031:
$398,554
Washington:
$569,500
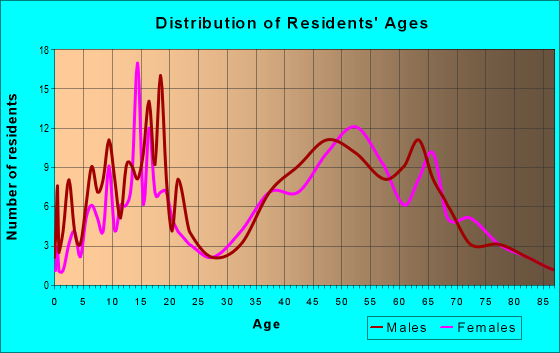
Median resident age:
This zip code:
48.4 years
Washington median age:
38.4 years
Average household size:
This zip code:
2.3 people
Washington:
2.5 people
Averages for the 2020 tax year for zip code 99031, filed in 2021:
Average Adjusted Gross Income (AGI) in 2020: $77,338 (Individual Income Tax Returns)
Here:
$77,338
State:
$99,264
Salary/wage: $68,549 (reported on 78.5% of returns)
Here:
$68,549
State:
$80,347
(% of AGI for various income ranges: 1255.6% for AGIs below $25k, 3905.0% for AGIs $25k-50k, 6352.9% for AGIs $50k-75k, 11874.0% for AGIs $75k-100k, 16826.2% for AGIs $100k-200k)
Taxable interest for individuals: $1,103 (reported on 46.2% of returns)
This zip code:
$1,103
Washington:
$2,077
(% of AGI for various income ranges: 20.0% for AGIs below $25k, 31.0% for AGIs $25k-50k, 121.4% for AGIs $50k-75k, 100.0% for AGIs $75k-100k, 71.2% for AGIs $100k-200k)
Ordinary dividends: $4,808 (reported on 18.5% of returns)
Here:
$4,808
State:
$10,013
(% of AGI for various income ranges: 24.4% for AGIs below $25k, 170.0% for AGIs $50k-75k, 117.5% for AGIs $100k-200k)
Net capital gain/loss in AGI: +$28,875 (reported on 18.5% of returns)
Here:
+$28,875
State:
+$40,092
(% of AGI for various income ranges: 106.7% for AGIs below $25k, 355.7% for AGIs $50k-75k, 107.5% for AGIs $100k-200k)
Profit/loss from business: +$7,980 (reported on 15.4% of returns)
Here:
+$7,980
State:
+$18,312
(% of AGI for various income ranges: 116.7% for AGIs below $25k, 207.1% for AGIs $50k-75k, 685.0% for AGIs $100k-200k)
Taxable individual retirement arrangement distribution: $16,917 (reported on 9.2% of returns)
99031:
$16,917
Washington:
$24,221
(% of AGI for various income ranges: 640.0% for AGIs $50k-75k, 708.8% for AGIs $100k-200k)
Total itemized deductions: $34,450 (reported on 6.2% of returns)
Here:
$34,450
State:
$39,068
(% of AGI for various income ranges: 1722.5% for AGIs $100k-200k)
Charity contributions: $9,100 (reported on 6.2% of returns)
Here:
$9,100
State:
$15,331
(% of AGI for various income ranges: 455.0% for AGIs $100k-200k)
Taxes paid: $8,550 (reported on 6.2% of returns)
99031:
$8,550
State:
$7,774
(% of AGI for various income ranges: 427.5% for AGIs $100k-200k)
Earned income credit: $1,960 (reported on 7.7% of returns)
Here:
$1,960
State:
$2,020
(% of AGI for various income ranges: 50.0% for AGIs below $25k, 53.0% for AGIs $25k-50k)
Percentage of individuals using paid preparers for their 2020 taxes: 90.8%
Here:
91%
State:
93%
(% for various income ranges: 87.5% for AGIs below $25k, 100.0% for AGIs $25k-50k, 90.9% for AGIs $50k-75k, 88.9% for AGIs $75k-100k, 91.7% for AGIs $100k-200k, 75.0% for AGIs over 200k)
Averages for the 2012 tax year for zip code 99031, filed in 2013:
Average Adjusted Gross Income (AGI) in 2012: $58,048 (Individual Income Tax Returns)
Here:
$58,048
State:
$69,533
Salary/wage: $48,536 (reported on 77.0% of returns)
Here:
$48,536
State:
$57,267
(% of AGI for various income ranges: 70.6% for AGIs below $25k, 68.4% for AGIs $25k-50k, 70.4% for AGIs $50k-75k, 64.8% for AGIs $75k-100k, 110.8% for AGIs $100k-200k)
Taxable interest for individuals: $1,108 (reported on 42.6% of returns)
This zip code:
$1,108
Washington:
$1,816
(% of AGI for various income ranges: 2.9% for AGIs below $25k, 1.1% for AGIs $25k-50k, 0.7% for AGIs $50k-75k, 1.0% for AGIs $75k-100k, 0.8% for AGIs $100k-200k)
Ordinary dividends: $7,673 (reported on 18.0% of returns)
Here:
$7,673
State:
$8,163
(% of AGI for various income ranges: 2.1% for AGIs below $25k, 1.2% for AGIs $50k-75k, 0.7% for AGIs $75k-100k, 7.5% for AGIs $100k-200k)
Net capital gain/loss in AGI: +$6,930 (reported on 16.4% of returns)
Here:
+$6,930
State:
+$21,568
(% of AGI for various income ranges: 0.6% for AGIs $50k-75k, 7.9% for AGIs $100k-200k)
Profit/loss from business: +$9,214 (reported on 11.5% of returns)
Here:
+$9,214
State:
+$16,521
(% of AGI for various income ranges: 4.4% for AGIs below $25k, 6.3% for AGIs $25k-50k, 4.6% for AGIs $75k-100k)
Taxable individual retirement arrangement distribution: $9,700 (reported on 11.5% of returns)
99031:
$9,700
Washington:
$18,648
(% of AGI for various income ranges: 3.2% for AGIs below $25k, 6.6% for AGIs $25k-50k, 5.5% for AGIs $75k-100k)
Total itemized deductions: $21,318 (21% of AGI, reported on 27.9% of returns)
Here:
$21,318
State:
$23,872
Here:
21.1% of AGI
State:
18.2% of AGI
(% of AGI for various income ranges: 16.3% for AGIs $25k-50k, 8.5% for AGIs $50k-75k, 11.6% for AGIs $75k-100k, 19.2% for AGIs $100k-200k)
Charity contributions: $5,400 (reported on 23.0% of returns)
Here:
$5,400
State:
$4,465
(% of AGI for various income ranges: 4.8% for AGIs below $25k, 2.0% for AGIs $50k-75k, 2.8% for AGIs $75k-100k, 3.8% for AGIs $100k-200k)
Taxes paid: $4,862 (reported on 26.2% of returns)
99031:
$4,862
State:
$6,400
(% of AGI for various income ranges: 3.6% for AGIs below $25k, 1.6% for AGIs $50k-75k, 2.1% for AGIs $75k-100k, 5.1% for AGIs $100k-200k)
Earned income credit: $1,750 (reported on 13.1% of returns)
Here:
$1,750
State:
$2,073
(% of AGI for various income ranges: 4.1% for AGIs below $25k, 0.8% for AGIs $25k-50k)
Percentage of individuals using paid preparers for their 2012 taxes: 47.5%
Here:
48%
State:
43%
(% for various income ranges: 43.5% for AGIs below $25k, 50.0% for AGIs $25k-50k, 50.0% for AGIs $50k-75k, 42.9% for AGIs $75k-100k, 71.4% for AGIs $100k-200k)
Averages for the 2004 tax year for zip code 99031, filed in 2005:
Average Adjusted Gross Income (AGI) in 2004: $40,422 (Individual Income Tax Returns)
Here:
$40,422
State:
$54,331
Salary/wage: $35,588 (reported on 82.7% of returns)
Here:
$35,588
State:
$45,761
(% of AGI for various income ranges: 94.4% for AGIs below $10k, 78.0% for AGIs $10k-25k, 74.7% for AGIs $25k-50k, 78.7% for AGIs $50k-75k, 87.9% for AGIs $75k-100k, 55.7% for AGIs over 100k)
Taxable interest for individuals: $1,389 (reported on 48.5% of returns)
This zip code:
$1,389
Washington:
$2,110
(% of AGI for various income ranges: 7.1% for AGIs below $10k, 2.6% for AGIs $10k-25k, 3.2% for AGIs $25k-50k, 0.9% for AGIs $50k-75k, 0.8% for AGIs $75k-100k, 0.9% for AGIs over 100k)
Taxable dividends: $1,842 (reported on 20.1% of returns)
Here:
$1,842
State:
$5,879
(% of AGI for various income ranges: 3.8% for AGIs below $10k, 1.0% for AGIs $10k-25k, 0.9% for AGIs $25k-50k, 0.2% for AGIs $50k-75k, 1.8% for AGIs over 100k)
Net capital gain/loss: +$6,073 (reported on 19.2% of returns)
Here:
+$6,073
State:
+$15,835
(% of AGI for various income ranges: -4.5% for AGIs below $10k, -0.3% for AGIs $10k-25k, 0.6% for AGIs $25k-50k, -0.1% for AGIs $50k-75k, 10.5% for AGIs over 100k)
Profit/loss from business: +$3,211 (reported on 13.4% of returns)
Here:
+$3,211
State:
+$13,994
(% of AGI for various income ranges: -0.2% for AGIs below $10k, 4.8% for AGIs $10k-25k, 0.5% for AGIs $25k-50k, 2.0% for AGIs $50k-75k)
IRA payment deduction: $2,941 (reported on 3.0% of returns)
99031:
$2,941
Washington:
$3,001
Total itemized deductions: $18,170 (25% of AGI, reported on 27.0% of returns)
Here:
$18,170
State:
$19,669
Here:
25.3% of AGI
State:
20.7% of AGI
(% of AGI for various income ranges: 17.6% for AGIs $10k-25k, 12.5% for AGIs $25k-50k, 11.1% for AGIs $50k-75k, 15.1% for AGIs $75k-100k, 10.6% for AGIs over 100k)
Charity contributions deductions: $3,928 (5% of AGI, reported on 22.0% of returns)
Here:
$3,928
State:
$3,569
Here:
5.0% of AGI
State:
3.5% of AGI
(% of AGI for various income ranges: 0.8% for AGIs $10k-25k, 2.2% for AGIs $25k-50k, 2.5% for AGIs $50k-75k, 2.1% for AGIs $75k-100k, 2.3% for AGIs over 100k)
Total tax: $5,062 (reported on 73.7% of returns)
99031:
$5,062
State:
$9,065
(% of AGI for various income ranges: 3.8% for AGIs below $10k, 4.1% for AGIs $10k-25k, 6.2% for AGIs $25k-50k, 7.8% for AGIs $50k-75k, 9.9% for AGIs $75k-100k, 14.8% for AGIs over 100k)
Earned income credit: $1,372 (reported on 13.8% of returns)
Here:
$1,372
State:
$1,607
Percentage of individuals using paid preparers for their 2004 taxes: 49.7%
Here:
50%
State:
49%
(% for various income ranges: 40.5% for AGIs below $10k, 46.9% for AGIs $10k-25k, 61.6% for AGIs $25k-50k, 43.6% for AGIs $50k-75k, 43.8% for AGIs $75k-100k, 70.3% for AGIs over 100k)
Household received Food Stamps/SNAP in the past 12 months: 60 Household did not receive Food Stamps/SNAP in the past 12 months: 387
Women who had a birth in the past 12 months: 15 (16 now married, 0 unmarried) Women who did not have a birth in the past 12 months: 203 (88 now married, 115 unmarried)
Housing units in zip code 99031 with a mortgage: 216 (15 second mortgage, 16 both second mortgage and home equity loan) Median monthly owner costs for units with a mortgage: $1,713 Median monthly owner costs for units without a mortgage: $510
Residents with income below the poverty level in 2022:
This zip code:
11.1%
Whole state:
10.0%
Residents with income below 50% of the poverty level in 2022:
This zip code:
5.2%
Whole state:
4.6%
Median number of rooms in houses and condos:
Here:
7.3
State:
6.5
Median number of rooms in apartments:
Here:
5.0
State:
3.9
Notable locations in this zip code not listed on our city pages
In group quarters: 81 (-1 institutionalized population)
Size of family households: 136 2-persons, 89 3-persons, 48 4-persons, 13 5-persons, 12 6-persons
Size of nonfamily households: 128 1-person, 17 2-persons
96 married couples with children.
8 single-parent households (8 women).
98.7% of residents of 99031 zip code speak English at home.
0.2% of residents speak other Indo-European language at home (50% very well, 50% well).
Foreign born population: 0 (0.0%)
:
0.0%
Whole state:
15.3%
19%German
16%American
14%Irish
8%Danish
6%Basque
4%English
4%Norwegian
Year of entry for the foreign-born population
212010 or later
02000 to 2009
01990 to 1999
0Before 1990
Facilities with environmental interests located in this zip code:
CABLEWAY INC (T24N R43E S33 in SPANGLE, WA)
(Resource Conservation and Recovery Act (tracking hazardous waste))
50.4%Electricity
19.3%Utility gas
10.0%Bottled, tank, or LP gas
9.3%Wood
7.0%Fuel oil, kerosene, etc.
4.6%Other fuel
Population in 1990: 1,434.
Place of birth for U.S.-born residents:
This state: 692
Northeast: 10
Midwest: 28
South: 27
West: 341
67% of the 99031 zip code residents lived in the same house 5 years ago. Out of people who lived in different houses, 69% lived in this county. Out of people who lived in different counties, 50% lived in Washington.
91% of the 99031 zip code residents lived in the same house 1 year ago. Out of people who lived in different houses, 37% moved from this county. Out of people who lived in different houses, 30% moved from different county within same state. Out of people who lived in different houses, 36% moved from different state.
Private vs. public school enrollment:
Students in private schools in grades 1 to 8 (elementary and middle school): 39
Here:
62.4%
Washington:
12.4%
Students in private schools in grades 9 to 12 (high school): 33
Here:
52.3%
Washington:
9.2%
Students in private undergraduate colleges: 12
Here:
37.1%
Washington:
16.5%
Occupation by median earnings in the past 12 months ($)
200,516Community and social service occupations
98,833Health diagnosing and treating practitioners and other technical occupations
82,854Education, training, and library occupations
68,034Management occupations
63,997Sales and related occupations
52,933Construction and extraction occupations
Companies with federal contracts located in this zip code:
VIRGIL ZABINSKI (805 E STUTLER RD in SPANGLE, WA; small business) : $55,382 in 5 contractsfrom 2001 to 2005
Contracts for Carpet Laying and Cleaning, Construction of Structures and Facilities -- Recreation Facilities (Non-Building), Construction of Structures and Facilities -- Other Administrative Facilities and Service Buildings by Army, Forest Service, Forest Service (disused code: now 12C2) Signed by year:2000: $0; 2001: $2,000; 2002: $0; 2003: $6,522; 2004: $0; 2005: $46,860; 2006: $0.
Biggest contracts:
$46,860 with Army for Carpet Laying and Cleaning. Taking place in OR. Signed on 2005-09-30. Completion date: 2005-09-15.
$5,300 with Forest Service for Construction of Structures and Facilities -- Recreation Facilities (Non-Building). Signed on 2003-04-15. Completion date: 2003-05-15.
$2,000 with Forest Service (disused code: now 12C2) for Construction of Structures and Facilities -- Other Administrative Facilities and Service Buildings. Signed on 2001-11-15. Completion date: 2001-11-15.
$611 with Forest Service for Construction of Structures and Facilities -- Recreation Facilities (Non-Building). Signed on 2003-06-15. Completion date: 2003-05-15.
WILLIAM D MCCRACKEN (19507 SOUTH DUNCAN ROAD in SPANGLE, WA; small business)
$22,100 with Public Health Service for Dentistry Services. Taking place in AZ. Signed on 2005-06-08. Effective on 2005-07-11. Completion date: 2005-09-30.
Top industries in this zip code by the number of employees in 2005:
Educational Services: Elementary and Secondary Schools (250-499 employees: 1 establishment)
Health Care and Social Assistance: Offices of Dentists (20-49: 1)
Wholesale Trade: Plumbing and Heating Equipment and Supplies (Hydronics) Merchant Wholesalers (10-19: 1)
Educational Services: Apprenticeship Training (5-9: 1)
Other Services (except Public Administration): General Automotive Repair (5-9: 1)
Construction: Site Preparation Contractors (5-9: 1)
Finance and Insurance: Commercial Banking (5-9: 1)
Construction: New Single-Family Housing Construction (except Operative Builders) (5-9: 1)
People in group quarters in 2010:
5 people in workers' group living quarters and job corps centers
Fatal accident statistics in 2013:
Fatal accident count: 1
Vehicles involved in fatal accidents: 1
Fatal accidents caused by drunken drivers: 0
Fatalities: 1
Persons involved in fatal accidents: 2
Pedestrians involved in fatal accidents: 0
Home Mortgage Disclosure Act Aggregated Statistics For Year 2009 (Based on 2 partial tracts)
A) FHA, FSA/RHS & VA Home Purchase Loans
B) Conventional Home Purchase Loans
C) Refinancings
D) Home Improvement Loans
F) Non-occupant Loans on < 5 Family Dwellings (A B C & D)
G) Loans On Manufactured Home Dwelling (A B C & D)
Number
Average Value
Number
Average Value
Number
Average Value
Number
Average Value
Number
Average Value
Number
Average Value
LOANS ORIGINATED
3
$158,893
4
$201,128
24
$166,937
2
$102,490
0
$0
4
$128,240
APPLICATIONS APPROVED, NOT ACCEPTED
0
$0
0
$0
2
$150,570
0
$0
0
$0
0
$0
APPLICATIONS DENIED
1
$224,480
0
$0
9
$155,891
2
$82,985
0
$0
1
$159,120
APPLICATIONS WITHDRAWN
0
$0
1
$194,710
8
$201,428
0
$0
1
$90,000
1
$90,340
FILES CLOSED FOR INCOMPLETENESS
0
$0
0
$0
1
$166,990
0
$0
0
$0
0
$0
Aggregated Statistics For Year 2008 (Based on 2 partial tracts)
A) FHA, FSA/RHS & VA Home Purchase Loans
B) Conventional Home Purchase Loans
C) Refinancings
D) Home Improvement Loans
F) Non-occupant Loans on < 5 Family Dwellings (A B C & D)
G) Loans On Manufactured Home Dwelling (A B C & D)
Number
Average Value
Number
Average Value
Number
Average Value
Number
Average Value
Number
Average Value
Number
Average Value
LOANS ORIGINATED
3
$116,347
6
$144,295
20
$149,576
5
$48,524
1
$40,040
2
$125,415
APPLICATIONS APPROVED, NOT ACCEPTED
0
$0
1
$130,040
2
$113,440
1
$38,330
0
$0
1
$116,350
APPLICATIONS DENIED
1
$122,850
1
$149,880
11
$144,813
1
$46,200
0
$0
1
$65,360
APPLICATIONS WITHDRAWN
0
$0
1
$206,690
7
$144,066
0
$0
0
$0
1
$89,660
FILES CLOSED FOR INCOMPLETENESS
0
$0
0
$0
0
$0
0
$0
0
$0
0
$0
Aggregated Statistics For Year 2007 (Based on 2 partial tracts)
A) FHA, FSA/RHS & VA Home Purchase Loans
B) Conventional Home Purchase Loans
C) Refinancings
D) Home Improvement Loans
F) Non-occupant Loans on < 5 Family Dwellings (A B C & D)
G) Loans On Manufactured Home Dwelling (A B C & D)
Number
Average Value
Number
Average Value
Number
Average Value
Number
Average Value
Number
Average Value
Number
Average Value
LOANS ORIGINATED
3
$115,320
15
$135,945
24
$126,357
6
$56,577
5
$200,460
7
$118,694
APPLICATIONS APPROVED, NOT ACCEPTED
0
$0
2
$291,385
5
$169,936
2
$67,585
1
$212,510
0
$0
APPLICATIONS DENIED
1
$148,510
4
$175,635
16
$149,263
5
$81,922
1
$82,130
3
$104,713
APPLICATIONS WITHDRAWN
0
$0
2
$88,800
5
$127,094
0
$0
0
$0
1
$80,070
FILES CLOSED FOR INCOMPLETENESS
0
$0
0
$0
2
$141,160
0
$0
0
$0
0
$0
Aggregated Statistics For Year 2006 (Based on 2 partial tracts)
A) FHA, FSA/RHS & VA Home Purchase Loans
B) Conventional Home Purchase Loans
C) Refinancings
D) Home Improvement Loans
F) Non-occupant Loans on < 5 Family Dwellings (A B C & D)
G) Loans On Manufactured Home Dwelling (A B C & D)
Number
Average Value
Number
Average Value
Number
Average Value
Number
Average Value
Number
Average Value
Number
Average Value
LOANS ORIGINATED
1
$164,260
15
$98,531
22
$108,337
7
$50,597
1
$82,470
4
$138,250
APPLICATIONS APPROVED, NOT ACCEPTED
0
$0
2
$147,660
4
$103,088
1
$107,110
1
$71,520
1
$81,100
APPLICATIONS DENIED
0
$0
5
$110,942
19
$120,797
3
$56,007
2
$76,825
3
$118,743
APPLICATIONS WITHDRAWN
0
$0
2
$142,355
9
$137,754
1
$109,500
0
$0
0
$0
FILES CLOSED FOR INCOMPLETENESS
0
$0
0
$0
2
$191,630
0
$0
0
$0
0
$0
Aggregated Statistics For Year 2005 (Based on 2 partial tracts)
A) FHA, FSA/RHS & VA Home Purchase Loans
B) Conventional Home Purchase Loans
C) Refinancings
D) Home Improvement Loans
F) Non-occupant Loans on < 5 Family Dwellings (A B C & D)
G) Loans On Manufactured Home Dwelling (A B C & D)
Number
Average Value
Number
Average Value
Number
Average Value
Number
Average Value
Number
Average Value
Number
Average Value
LOANS ORIGINATED
3
$92,737
26
$91,604
20
$113,542
3
$58,860
2
$75,115
8
$85,036
APPLICATIONS APPROVED, NOT ACCEPTED
1
$65,020
2
$124,730
4
$127,212
0
$0
0
$0
3
$84,180
APPLICATIONS DENIED
1
$111,560
4
$108,135
13
$110,083
4
$43,888
1
$27,380
3
$131,063
APPLICATIONS WITHDRAWN
0
$0
5
$108,066
5
$102,044
2
$123,705
1
$52,360
0
$0
FILES CLOSED FOR INCOMPLETENESS
0
$0
2
$47,735
3
$95,017
0
$0
0
$0
0
$0
Aggregated Statistics For Year 2004 (Based on 2 partial tracts)
A) FHA, FSA/RHS & VA Home Purchase Loans
B) Conventional Home Purchase Loans
C) Refinancings
D) Home Improvement Loans
F) Non-occupant Loans on < 5 Family Dwellings (A B C & D)
G) Loans On Manufactured Home Dwelling (A B C & D)
Number
Average Value
Number
Average Value
Number
Average Value
Number
Average Value
Number
Average Value
Number
Average Value
LOANS ORIGINATED
2
$129,695
17
$86,033
21
$94,724
2
$56,290
2
$99,065
5
$87,808
APPLICATIONS APPROVED, NOT ACCEPTED
0
$0
4
$141,500
2
$105,225
1
$79,050
1
$311,400
1
$80,420
APPLICATIONS DENIED
1
$80,070
7
$71,813
14
$106,204
1
$43,800
1
$75,280
5
$103,002
APPLICATIONS WITHDRAWN
1
$77,000
2
$73,915
11
$98,055
1
$61,600
1
$195,740
1
$96,160
FILES CLOSED FOR INCOMPLETENESS
0
$0
0
$0
3
$105,057
0
$0
0
$0
0
$0
Aggregated Statistics For Year 2003 (Based on 2 partial tracts)
A) FHA, FSA/RHS & VA Home Purchase Loans
B) Conventional Home Purchase Loans
C) Refinancings
D) Home Improvement Loans
F) Non-occupant Loans on < 5 Family Dwellings (A B C & D)
Number
Average Value
Number
Average Value
Number
Average Value
Number
Average Value
Number
Average Value
LOANS ORIGINATED
3
$86,463
15
$99,945
51
$107,853
3
$27,833
3
$199,843
APPLICATIONS APPROVED, NOT ACCEPTED
0
$0
1
$67,410
5
$89,724
0
$0
0
$0
APPLICATIONS DENIED
0
$0
4
$91,282
17
$95,977
1
$9,580
2
$98,040
APPLICATIONS WITHDRAWN
0
$0
2
$97,700
9
$90,151
0
$0
1
$96,840
FILES CLOSED FOR INCOMPLETENESS
0
$0
0
$0
1
$37,300
0
$0
0
$0
Aggregated Statistics For Year 2002 (Based on 2 partial tracts)
A) FHA, FSA/RHS & VA Home Purchase Loans
B) Conventional Home Purchase Loans
C) Refinancings
D) Home Improvement Loans
F) Non-occupant Loans on < 5 Family Dwellings (A B C & D)
Number
Average Value
Number
Average Value
Number
Average Value
Number
Average Value
Number
Average Value
LOANS ORIGINATED
2
$91,365
9
$86,539
35
$97,947
3
$31,710
2
$54,750
APPLICATIONS APPROVED, NOT ACCEPTED
0
$0
2
$99,410
4
$124,988
0
$0
0
$0
APPLICATIONS DENIED
0
$0
2
$92,735
12
$80,930
2
$15,055
0
$0
APPLICATIONS WITHDRAWN
0
$0
1
$80,420
6
$102,432
0
$0
0
$0
FILES CLOSED FOR INCOMPLETENESS
0
$0
0
$0
1
$135,170
0
$0
0
$0
Aggregated Statistics For Year 2001 (Based on 2 partial tracts)
A) FHA, FSA/RHS & VA Home Purchase Loans
B) Conventional Home Purchase Loans
C) Refinancings
D) Home Improvement Loans
F) Non-occupant Loans on < 5 Family Dwellings (A B C & D)
Number
Average Value
Number
Average Value
Number
Average Value
Number
Average Value
Number
Average Value
LOANS ORIGINATED
2
$89,485
9
$87,451
28
$100,411
4
$35,160
1
$180,680
APPLICATIONS APPROVED, NOT ACCEPTED
0
$0
0
$0
5
$78,842
1
$11,980
0
$0
APPLICATIONS DENIED
0
$0
3
$56,120
17
$84,161
1
$19,850
0
$0
APPLICATIONS WITHDRAWN
0
$0
0
$0
8
$98,596
0
$0
0
$0
FILES CLOSED FOR INCOMPLETENESS
0
$0
0
$0
2
$105,910
0
$0
0
$0
Aggregated Statistics For Year 2000 (Based on 2 partial tracts)
A) FHA, FSA/RHS & VA Home Purchase Loans
B) Conventional Home Purchase Loans
C) Refinancings
D) Home Improvement Loans
F) Non-occupant Loans on < 5 Family Dwellings (A B C & D)
Number
Average Value
Number
Average Value
Number
Average Value
Number
Average Value
Number
Average Value
LOANS ORIGINATED
2
$93,765
10
$85,790
9
$74,448
4
$25,750
1
$36,270
APPLICATIONS APPROVED, NOT ACCEPTED
0
$0
2
$93,250
4
$65,360
2
$16,425
0
$0
APPLICATIONS DENIED
1
$53,380
4
$87,602
12
$67,927
4
$20,360
1
$12,660
APPLICATIONS WITHDRAWN
1
$55,440
1
$68,780
4
$73,572
1
$50,300
0
$0
FILES CLOSED FOR INCOMPLETENESS
0
$0
0
$0
1
$60,570
0
$0
0
$0
Aggregated Statistics For Year 1999 (Based on 1 partial tract)
A) FHA, FSA/RHS & VA Home Purchase Loans
B) Conventional Home Purchase Loans
C) Refinancings
D) Home Improvement Loans
F) Non-occupant Loans on < 5 Family Dwellings (A B C & D)
Detailed PMIC statistics for the following Tracts:0143.00
2002 - 2018 National Fire Incident Reporting System (NFIRS) incidents
According to the data from the years 2002 - 2018 the average number of fires per year is 6. The highest number of fire incidents - 19 took place in 2006, and the least - 0 in 2003. The data has a rising trend.
When looking into fire subcategories, the most incidents belonged to: Outside Fires (62.7%), and Structure Fires (17.3%).
Fire incident types reported to NFIRS in Zip Code 99031


 Nearest zip codes: 99039, 99036, 99223, 99012, 99170, 99020.


 According to the data from the years 2002 - 2018 the average number of fires per year is 6. The highest number of fire incidents - 19 took place in 2006, and the least - 0 in 2003. The data has a rising trend.
 When looking into fire subcategories, the most incidents belonged to: Outside Fires (62.7%), and Structure Fires (17.3%).