Estimated zip code population in 2022: 4,955 Zip code population in 2010: 5,109 Zip code population in 2000: 4,382
Houses and condos: 2,666 Renter-occupied apartments: 460
% of renters here:
21%
State:
36%
March 2022 cost of living index in zip code 99109: 88.2 (less than average, U.S. average is 100)
Land area: 280.2 sq. mi. Water area: 0.1 sq. mi.
Population density: 18 people per square mile
(very low).
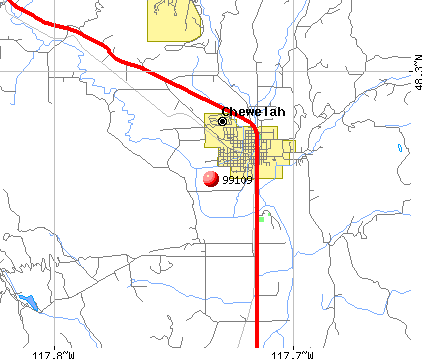
OSM Map
General Map
Google Map
MSN Map
OSM Map
General Map
Google Map
MSN Map
OSM Map
General Map
Google Map
MSN Map
OSM Map
General Map
Google Map
MSN Map
Please wait while loading the map...
Real estate property taxes paid for housing units in 2022:
This zip code:
0.6% ($1,866)
Washington:
0.8% ($4,283)
Median real estate property taxes paid for housing units with mortgages in 2022: $2,037 (0.6%) Median real estate property taxes paid for housing units with no mortgage in 2022: $1,763 (0.7%)
Estimated median house/condo value in 2022: $290,404
99109:
$290,404
Washington:
$569,500
According to our research of Washington and other state lists, there were 4 registered sex offenders living in 99109 zip code as of April 28, 2024. The ratio of all residents to sex offenders in zip code 99109 is 1,330 to 1. The ratio of registered sex offenders to all residents in this zip code is near the state average.
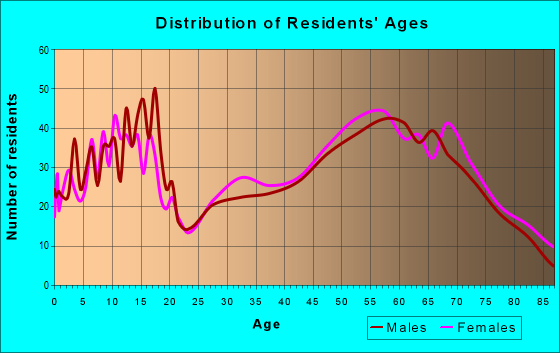
Median resident age:
This zip code:
55.5 years
Washington median age:
38.4 years
Average household size:
This zip code:
2.2 people
Washington:
2.5 people
Averages for the 2020 tax year for zip code 99109, filed in 2021:
Average Adjusted Gross Income (AGI) in 2020: $60,689 (Individual Income Tax Returns)
Here:
$60,689
State:
$99,264
Salary/wage: $49,843 (reported on 70.9% of returns)
Here:
$49,843
State:
$80,347
(% of AGI for various income ranges: 1031.4% for AGIs below $25k, 3148.8% for AGIs $25k-50k, 5891.2% for AGIs $50k-75k, 8082.7% for AGIs $75k-100k, 15154.7% for AGIs $100k-200k, 54770.0% for AGIs over 200k)
Taxable interest for individuals: $1,860 (reported on 35.9% of returns)
This zip code:
$1,860
Washington:
$2,077
(% of AGI for various income ranges: 55.7% for AGIs below $25k, 37.9% for AGIs $25k-50k, 88.8% for AGIs $50k-75k, 202.0% for AGIs $75k-100k, 192.9% for AGIs $100k-200k, 1365.0% for AGIs over 200k)
Ordinary dividends: $4,319 (reported on 15.2% of returns)
Here:
$4,319
State:
$10,013
(% of AGI for various income ranges: 32.9% for AGIs below $25k, 24.6% for AGIs $25k-50k, 102.0% for AGIs $50k-75k, 223.3% for AGIs $75k-100k, 168.2% for AGIs $100k-200k, 2000.0% for AGIs over 200k)
Net capital gain/loss in AGI: +$17,133 (reported on 18.1% of returns)
Here:
+$17,133
State:
+$40,092
(% of AGI for various income ranges: 15.5% for AGIs below $25k, 45.6% for AGIs $25k-50k, 222.4% for AGIs $50k-75k, 365.3% for AGIs $75k-100k, 1149.4% for AGIs $100k-200k, 20070.0% for AGIs over 200k)
Profit/loss from business: +$17,710 (reported on 12.7% of returns)
Here:
+$17,710
State:
+$18,312
(% of AGI for various income ranges: 106.3% for AGIs below $25k, 199.0% for AGIs $25k-50k, 109.2% for AGIs $50k-75k, 158.0% for AGIs $75k-100k, 1957.1% for AGIs $100k-200k)
Taxable individual retirement arrangement distribution: $19,788 (reported on 13.5% of returns)
99109:
$19,788
Washington:
$24,221
(% of AGI for various income ranges: 114.7% for AGIs below $25k, 139.6% for AGIs $25k-50k, 273.2% for AGIs $50k-75k, 533.3% for AGIs $75k-100k, 2127.6% for AGIs $100k-200k)
Total itemized deductions: $31,755 (reported on 4.6% of returns)
Here:
$31,755
State:
$39,068
(% of AGI for various income ranges: 188.6% for AGIs below $25k, 337.2% for AGIs $50k-75k, 1015.3% for AGIs $100k-200k)
Charity contributions: $6,800 (reported on 3.4% of returns)
Here:
$6,800
State:
$15,331
(% of AGI for various income ranges: 64.4% for AGIs $50k-75k, 225.3% for AGIs $100k-200k)
Taxes paid: $5,800 (reported on 4.2% of returns)
99109:
$5,800
State:
$7,774
(% of AGI for various income ranges: 16.5% for AGIs below $25k, 56.4% for AGIs $50k-75k, 210.6% for AGIs $100k-200k)
Earned income credit: $2,409 (reported on 14.3% of returns)
Here:
$2,409
State:
$2,020
(% of AGI for various income ranges: 91.8% for AGIs below $25k, 76.9% for AGIs $25k-50k)
Percentage of individuals using paid preparers for their 2020 taxes: 92.8%
Here:
93%
State:
93%
(% for various income ranges: 91.7% for AGIs below $25k, 93.7% for AGIs $25k-50k, 94.7% for AGIs $50k-75k, 91.7% for AGIs $75k-100k, 93.8% for AGIs $100k-200k, 87.5% for AGIs over 200k)
Averages for the 2012 tax year for zip code 99109, filed in 2013:
Average Adjusted Gross Income (AGI) in 2012: $45,722 (Individual Income Tax Returns)
Here:
$45,722
State:
$69,533
Salary/wage: $38,689 (reported on 74.1% of returns)
Here:
$38,689
State:
$57,267
(% of AGI for various income ranges: 62.7% for AGIs below $25k, 62.9% for AGIs $25k-50k, 63.8% for AGIs $50k-75k, 70.0% for AGIs $75k-100k, 63.6% for AGIs $100k-200k, 47.1% for AGIs over 200k)
Taxable interest for individuals: $1,879 (reported on 36.3% of returns)
This zip code:
$1,879
Washington:
$1,816
(% of AGI for various income ranges: 3.5% for AGIs below $25k, 1.5% for AGIs $25k-50k, 1.8% for AGIs $50k-75k, 1.3% for AGIs $75k-100k, 0.5% for AGIs $100k-200k, 1.2% for AGIs over 200k)
Ordinary dividends: $3,884 (reported on 17.9% of returns)
Here:
$3,884
State:
$8,163
(% of AGI for various income ranges: 2.6% for AGIs below $25k, 1.5% for AGIs $25k-50k, 1.2% for AGIs $50k-75k, 0.9% for AGIs $75k-100k, 2.4% for AGIs $100k-200k)
Net capital gain/loss in AGI: +$4,814 (reported on 17.5% of returns)
Here:
+$4,814
State:
+$21,568
(% of AGI for various income ranges: 0.4% for AGIs $25k-50k, 0.5% for AGIs $50k-75k, 0.9% for AGIs $75k-100k, 6.7% for AGIs $100k-200k)
Profit/loss from business: +$7,643 (reported on 14.2% of returns)
Here:
+$7,643
State:
+$16,521
(% of AGI for various income ranges: 6.8% for AGIs below $25k, 2.8% for AGIs $25k-50k, 1.3% for AGIs $50k-75k, 1.5% for AGIs $75k-100k, 2.3% for AGIs $100k-200k)
Taxable individual retirement arrangement distribution: $13,957 (reported on 13.2% of returns)
99109:
$13,957
Washington:
$18,648
(% of AGI for various income ranges: 3.6% for AGIs below $25k, 3.9% for AGIs $25k-50k, 4.7% for AGIs $50k-75k, 2.4% for AGIs $75k-100k, 6.7% for AGIs $100k-200k)
Total itemized deductions: $18,476 (24% of AGI, reported on 21.7% of returns)
Here:
$18,476
State:
$23,872
Here:
24.5% of AGI
State:
18.2% of AGI
(% of AGI for various income ranges: 9.1% for AGIs below $25k, 8.8% for AGIs $25k-50k, 8.7% for AGIs $50k-75k, 9.4% for AGIs $75k-100k, 12.2% for AGIs $100k-200k)
Charity contributions: $3,290 (reported on 14.6% of returns)
Here:
$3,290
State:
$4,465
(% of AGI for various income ranges: 1.0% for AGIs below $25k, 0.7% for AGIs $25k-50k, 0.9% for AGIs $50k-75k, 1.5% for AGIs $75k-100k, 1.7% for AGIs $100k-200k)
Taxes paid: $3,982 (reported on 20.8% of returns)
99109:
$3,982
State:
$6,400
(% of AGI for various income ranges: 1.4% for AGIs below $25k, 1.5% for AGIs $25k-50k, 1.6% for AGIs $50k-75k, 2.0% for AGIs $75k-100k, 3.1% for AGIs $100k-200k)
Earned income credit: $2,315 (reported on 18.9% of returns)
Here:
$2,315
State:
$2,073
(% of AGI for various income ranges: 6.2% for AGIs below $25k, 1.1% for AGIs $25k-50k)
Percentage of individuals using paid preparers for their 2012 taxes: 49.5%
Here:
50%
State:
43%
(% for various income ranges: 40.7% for AGIs below $25k, 50.9% for AGIs $25k-50k, 54.8% for AGIs $50k-75k, 52.9% for AGIs $75k-100k, 76.5% for AGIs $100k-200k, 66.7% for AGIs over 200k)
Averages for the 2004 tax year for zip code 99109, filed in 2005:
Average Adjusted Gross Income (AGI) in 2004: $37,310 (Individual Income Tax Returns)
Here:
$37,310
State:
$54,331
Salary/wage: $31,279 (reported on 77.5% of returns)
Here:
$31,279
State:
$45,761
(% of AGI for various income ranges: 124.8% for AGIs below $10k, 63.3% for AGIs $10k-25k, 71.3% for AGIs $25k-50k, 70.4% for AGIs $50k-75k, 67.7% for AGIs $75k-100k, 46.9% for AGIs over 100k)
Taxable interest for individuals: $1,783 (reported on 46.5% of returns)
This zip code:
$1,783
Washington:
$2,110
(% of AGI for various income ranges: 9.0% for AGIs below $10k, 4.5% for AGIs $10k-25k, 2.0% for AGIs $25k-50k, 2.0% for AGIs $50k-75k, 1.2% for AGIs $75k-100k, 1.5% for AGIs over 100k)
Taxable dividends: $1,960 (reported on 21.7% of returns)
Here:
$1,960
State:
$5,879
(% of AGI for various income ranges: 2.9% for AGIs below $10k, 1.2% for AGIs $10k-25k, 1.2% for AGIs $25k-50k, 1.2% for AGIs $50k-75k, 0.9% for AGIs $75k-100k, 1.0% for AGIs over 100k)
Net capital gain/loss: +$6,781 (reported on 22.3% of returns)
Here:
+$6,781
State:
+$15,835
(% of AGI for various income ranges: -0.7% for AGIs below $10k, 1.9% for AGIs $10k-25k, 2.9% for AGIs $25k-50k, 2.0% for AGIs $50k-75k, 4.8% for AGIs $75k-100k, 8.5% for AGIs over 100k)
Profit/loss from business: +$10,287 (reported on 16.0% of returns)
Here:
+$10,287
State:
+$13,994
(% of AGI for various income ranges: 4.4% for AGIs below $10k, 5.7% for AGIs $10k-25k, 2.7% for AGIs $25k-50k, 3.1% for AGIs $50k-75k, 2.5% for AGIs $75k-100k, 8.1% for AGIs over 100k)
IRA payment deduction: $3,804 (reported on 2.7% of returns)
99109:
$3,804
Washington:
$3,001
Total itemized deductions: $16,261 (24% of AGI, reported on 21.1% of returns)
Here:
$16,261
State:
$19,669
Here:
24.3% of AGI
State:
20.7% of AGI
(% of AGI for various income ranges: 13.2% for AGIs below $10k, 9.5% for AGIs $10k-25k, 8.4% for AGIs $25k-50k, 9.4% for AGIs $50k-75k, 9.1% for AGIs $75k-100k, 9.5% for AGIs over 100k)
Charity contributions deductions: $3,268 (5% of AGI, reported on 16.6% of returns)
Here:
$3,268
State:
$3,569
Here:
4.6% of AGI
State:
3.5% of AGI
(% of AGI for various income ranges: 1.8% for AGIs below $10k, 1.0% for AGIs $10k-25k, 1.2% for AGIs $25k-50k, 1.6% for AGIs $50k-75k, 1.4% for AGIs $75k-100k, 1.8% for AGIs over 100k)
Total tax: $5,274 (reported on 70.1% of returns)
99109:
$5,274
State:
$9,065
(% of AGI for various income ranges: 2.7% for AGIs below $10k, 3.5% for AGIs $10k-25k, 5.9% for AGIs $25k-50k, 8.7% for AGIs $50k-75k, 10.5% for AGIs $75k-100k, 19.2% for AGIs over 100k)
Earned income credit: $1,771 (reported on 18.1% of returns)
Here:
$1,771
State:
$1,607
Percentage of individuals using paid preparers for their 2004 taxes: 56.3%
Here:
56%
State:
49%
(% for various income ranges: 47.3% for AGIs below $10k, 58.9% for AGIs $10k-25k, 53.4% for AGIs $25k-50k, 58.2% for AGIs $50k-75k, 66.7% for AGIs $75k-100k, 78.8% for AGIs over 100k)
Household received Food Stamps/SNAP in the past 12 months: 408 Household did not receive Food Stamps/SNAP in the past 12 months: 1,814
Women who had a birth in the past 12 months: 15 (16 now married, 0 unmarried) Women who did not have a birth in the past 12 months: 770 (418 now married, 350 unmarried)
Housing units in zip code 99109 with a mortgage: 831 (28 second mortgage, 29 both second mortgage and home equity loan) Houses without a mortgage: 5
Median monthly owner costs for units with a mortgage: $1,504 Median monthly owner costs for units without a mortgage: $481
Residents with income below the poverty level in 2022:
This zip code:
12.8%
Whole state:
10.0%
Residents with income below 50% of the poverty level in 2022:
This zip code:
9.7%
Whole state:
4.6%
Median number of rooms in houses and condos:
Here:
6.4
State:
6.5
Median number of rooms in apartments:
Here:
3.8
State:
3.9
Notable locations in this zip code not listed on our city pages
Notable locations in zip code 99109: Red Quarry (A), Camp Hafer (B), Chewelah Golf and Country Club (C), Forty Nine Degrees North Ski Area (D), Addy Sewage Lagoon (E), Chewelah Wastewater Treatment Plant (F), Chewelah Rural Ambulance (G), Stevens County Fire District 4 Station 43 Chewelah City (H), Stevens County Fire District 4 Station 44 Moser Road (I), Chewelah Community Health Center (J), Saint Joseph Hospital of Chewelah Long Term Care Facility (K), Chewelah City Hall (L), Chewelah Museum (M), Chewelah Public Library (N). Display/hide their locations on the map
Churches in zip code 99109 include: Chewelah Seventh Day Adventist Church (A), Addy New Life Christian Center (B), Chewelah Baptist Church (C), Chewelah United Church of Christ (D), Faith Community Church (E), Kingdom Hall of Jehovahs Witnesses (F), Saint Paul Lutheran Church (G), The Church of Jesus Christ of Latter Day Saints (H). Display/hide their locations on the map
Lakes: Buck Lake (A), Johnson Lake (B), Fourmile Lake (C), Doe Lake (D), Phillips Lake (E), Mud Lake (F), Horseshoe Lake (G), Browns Lake (H). Display/hide their locations on the map
Creeks: Bayley Creek (A), Blue Creek (B), Butte Creek (C), Cottonwood Creek (D), Donaldson Creek (E), Drummond Creek (F), Franzwa Creek (G), Hartill Creek (H), Healey Creek (I). Display/hide their locations on the map
In group quarters: 91 (-1 institutionalized population)
Size of family households: 872 2-persons, 284 3-persons, 96 4-persons, 105 5-persons, 63 6-persons, 11 7-or-more-persons
Size of nonfamily households: 709 1-person, 82 2-persons
472 married couples with children.
168 single-parent households (73 men, 95 women).
98.1% of residents of 99109 zip code speak English at home.
1.2% of residents speak Spanish at home (100% very well).
0.7% of residents speak other language at home (100% very well).
Foreign born population: 65 (1.3%) (87.4% of them are naturalized citizens)
This zip code:
1.3%
Whole state:
15.3%
25%Czechoslovakia (includes Czech Republic and Slovakia)
11%Belgium
8%Taiwan
6%Sweden
6%United Kingdom, excluding England and Scotland
30%American
12%German
8%European
6%Irish
6%Norwegian
5%English
3%Ukrainian
Year of entry for the foreign-born population
42010 or later
52000 to 2009
141990 to 1999
64Before 1990
Facilities with environmental interests located in this zip code:
CHEWELAH ASPHALT COMPANY (2400 COZY NOOK RD in CHEWELAH, WA)
National Pollutant Discharge Elimination System NON-MAJOR (Tracking pollutant discharge elimination systems) - permit STATE MASTER (Washington State Department of Ecology's Facility/Site identification system) - WATQUAL-WAG507153, National Pollutant Discharge Elimination System Permit Business SIC classification: CONSTRUCTION SAND AND GRAVEL
CHEWELAH STP (210 WEST NORTH AVENUE in CHEWELAH, WA)
National Pollutant Discharge Elimination System NON-MAJOR (Tracking pollutant discharge elimination systems) - permit STATE MASTER (Washington State Department of Ecology's Facility/Site identification system) - WATQUAL-WA0023604, NPDES NON-MAJOR Business SIC classification: SEWERAGE SYSTEMS Organizations: CHEWELAH CITY (CONTACT/OPERATOR)
Alternative names: CHEWELAH CITY, CHEWELAH, CITY OF, CHEWELAH CY OF, CHEWELAH WASTEWATER TREATMENT PLANT, SITE ID 530650009
CHEWELAH CITY PUBLIC WORKS (303 WEST MAIN in CHEWELAH, WA)
COMPLIANCE ACTIVITY (Tracking inspections of insecticide, fungicide, and rodenticide, and toxic substances) COMMUNITY WATER SYSTEM (SDWIS) - SDWIS-WA5312750 3T, WATER TREATMENT PLANT, SDWIS-WA5312750 4T, SDWIS-WA5312750 5T, Alternative names: CHEWELAH CY OF, CHEWELAH WATER DEPARTMENT, CITY OF, CHEWELAH WATER DEPT SOUTH
CHEWELAH ALTERNATIVE (N 210 PARK in CHEWELAH, WA)
(National Center for Education Statistics) - STATE ID-1709 Organizations: CHEWELAH SCHOOL DIST 36 (SCHOOL DISTRICT)
ANDRIST DR CHARLES (N END OF TOWN in CHEWELAH, WA)
(Resource Conservation and Recovery Act (tracking hazardous waste))
CHEWELAH CITY HALL (301 EAST CLAY in CHEWELAH, WA)
(Integrated Compliance Information System) - ICIS-10-1993-0103, FORMAL ENFORCEMENT ACTION Alternative names: CHEWELAH CY OF, SITE ID 530650009
CLOTHES BASKET (S 112 2ND AVE in CHEWELAH, WA)
(Resource Conservation and Recovery Act (tracking hazardous waste)) Organizations: SUSAN MELLICK (CONTACT/OPERATOR)
CHEWELAH SD (N 210 PARK in CHEWELAH, WA)
COMPLIANCE ACTIVITY (Tracking inspections of insecticide, fungicide, and rodenticide, and toxic substances)
Housing units lacking complete plumbing facilities: 1.4% Housing units lacking complete kitchen facilities: 3.5%
39.2%Electricity
27.5%Utility gas
22.7%Wood
4.7%Bottled, tank, or LP gas
2.7%Other fuel
2.3%Fuel oil, kerosene, etc.
1.1%Solar energy
Population in 1990: 5,239.
Place of birth for U.S.-born residents:
This state: 2,793
Northeast: 107
Midwest: 348
South: 276
West: 1,308
55% of the 99109 zip code residents lived in the same house 5 years ago. Out of people who lived in different houses, 50% lived in this county. Out of people who lived in different counties, 50% lived in Washington.
89% of the 99109 zip code residents lived in the same house 1 year ago. Out of people who lived in different houses, 59% moved from this county. Out of people who lived in different houses, 30% moved from different county within same state. Out of people who lived in different houses, 10% moved from different state.
Private vs. public school enrollment:
Students in private schools in grades 1 to 8 (elementary and middle school): 37
Here:
9.9%
Washington:
12.4%
Students in private schools in grades 9 to 12 (high school): 11
Here:
7.7%
Washington:
9.2%
Students in private undergraduate colleges: 8
Here:
6.6%
Washington:
16.5%
Occupation by median earnings in the past 12 months ($)
84,417Life, physical, and social science occupations
82,723Community and social service occupations
58,985Production occupations
58,042Installation, maintenance, and repair occupations
57,644Business and financial operations occupations
56,297Health diagnosing and treating practitioners and other technical occupations
Top industries in this zip code by the number of employees in 2005:
Arts, Entertainment, and Recreation: Other Gambling Industries (100-249 employees: 1 establishment)
Health Care and Social Assistance: General Medical and Surgical Hospitals (100-249: 1)
Arts, Entertainment, and Recreation: Skiing Facilities (100-249: 1)
Health Care and Social Assistance: Home Health Care Services (50-99: 1, 20-49: 1)
17 people in nursing facilities/skilled-nursing facilities
People in group quarters in 2000:
39 people in nursing homes
29 people in other noninstitutional group quarters
Fatal accident statistics in 2014:
Fatal accident count: 1
Vehicles involved in fatal accidents: 1
Fatal accidents caused by drunken drivers: 1
Fatalities: 1
Persons involved in fatal accidents: 1
Pedestrians involved in fatal accidents: 0
Fatal accident statistics in 2013:
Fatal accident count: 1
Vehicles involved in fatal accidents: 1
Fatal accidents caused by drunken drivers: 1
Fatalities: 1
Persons involved in fatal accidents: 2
Pedestrians involved in fatal accidents: 0
2002 - 2018 National Fire Incident Reporting System (NFIRS) incidents
According to the data from the years 2002 - 2018 the average number of fires per year is 37. The highest number of fire incidents - 53 took place in 2005, and the least - 17 in 2016. The data has a dropping trend.
When looking into fire subcategories, the most reports belonged to: Outside Fires (54.5%), and Structure Fires (30.8%).
Fire incident types reported to NFIRS in Zip Code 99109


 Nearest zip codes: 99181, 99148, 99101, 99173, 99110, 99180.


 According to the data from the years 2002 - 2018 the average number of fires per year is 37. The highest number of fire incidents - 53 took place in 2005, and the least - 17 in 2016. The data has a dropping trend.
 When looking into fire subcategories, the most reports belonged to: Outside Fires (54.5%), and Structure Fires (30.8%).