Estimated zip code population in 2022: 10,149 Zip code population in 2010: 9,201 Zip code population in 2000: 8,286
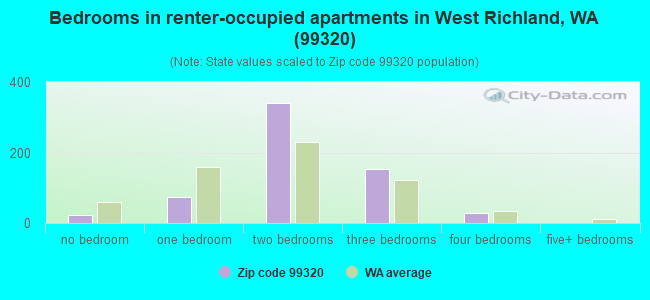
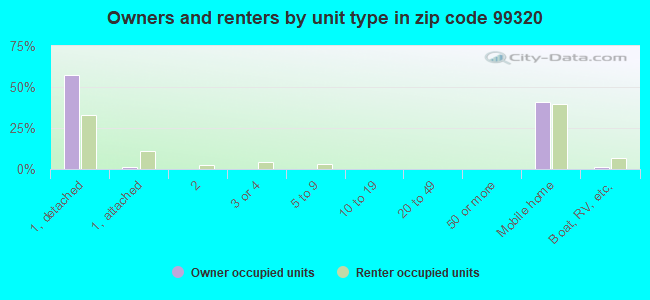
Houses and condos: 3,981 Renter-occupied apartments: 622
% of renters here:
17%
State:
36%
March 2022 cost of living index in zip code 99320: 88.1 (less than average, U.S. average is 100)
Land area: 138.9 sq. mi. Water area: 1.1 sq. mi.
Population density: 73 people per square mile
(very low).
OSM Map
General Map
Google Map
MSN Map
OSM Map
General Map
Google Map
MSN Map
OSM Map
General Map
Google Map
MSN Map
OSM Map
General Map
Google Map
MSN Map
Please wait while loading the map...
Real estate property taxes paid for housing units in 2022:
This zip code:
0.7% ($2,388)
Washington:
0.8% ($4,283)
Median real estate property taxes paid for housing units with mortgages in 2022: $2,453 (0.7%) Median real estate property taxes paid for housing units with no mortgage in 2022: $2,256 (0.7%)
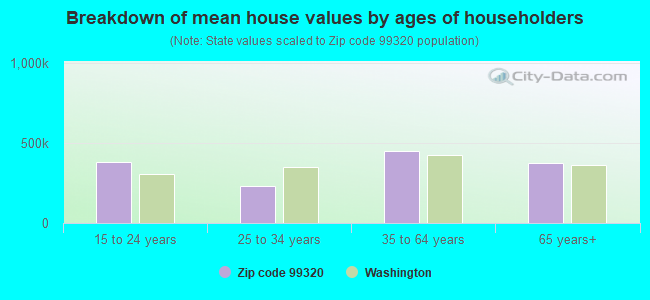
Estimated median house/condo value in 2022: $321,802
99320:
$321,802
Washington:
$569,500
According to our research of Washington and other state lists, there were 7 registered sex offenders living in 99320 zip code as of April 29, 2024. The ratio of all residents to sex offenders in zip code 99320 is 1,322 to 1. The ratio of registered sex offenders to all residents in this zip code is near the state average.
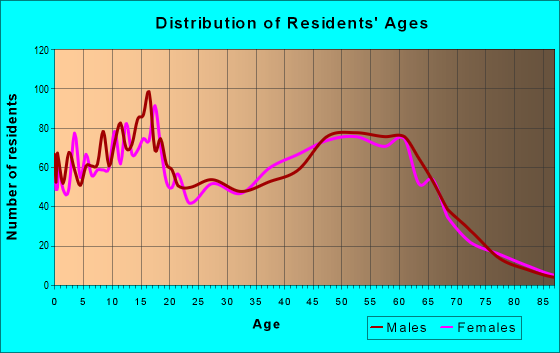
Median resident age:
This zip code:
36.7 years
Washington median age:
38.4 years
Average household size:
This zip code:
2.7 people
Washington:
2.5 people
Averages for the 2020 tax year for zip code 99320, filed in 2021:
Average Adjusted Gross Income (AGI) in 2020: $64,582 (Individual Income Tax Returns)
Here:
$64,582
State:
$99,264
Salary/wage: $57,299 (reported on 83.5% of returns)
Here:
$57,299
State:
$80,347
(% of AGI for various income ranges: 1221.8% for AGIs below $25k, 3307.8% for AGIs $25k-50k, 6339.3% for AGIs $50k-75k, 9599.2% for AGIs $75k-100k, 17024.8% for AGIs $100k-200k, 43706.0% for AGIs over 200k)
Taxable interest for individuals: $1,016 (reported on 26.0% of returns)
This zip code:
$1,016
Washington:
$2,077
(% of AGI for various income ranges: 16.9% for AGIs below $25k, 17.0% for AGIs $25k-50k, 26.6% for AGIs $50k-75k, 28.2% for AGIs $75k-100k, 77.4% for AGIs $100k-200k, 512.0% for AGIs over 200k)
Ordinary dividends: $2,969 (reported on 11.6% of returns)
Here:
$2,969
State:
$10,013
(% of AGI for various income ranges: 20.2% for AGIs below $25k, 14.4% for AGIs $25k-50k, 30.7% for AGIs $50k-75k, 47.9% for AGIs $75k-100k, 98.4% for AGIs $100k-200k, 832.0% for AGIs over 200k)
Net capital gain/loss in AGI: +$14,500 (reported on 11.2% of returns)
Here:
+$14,500
State:
+$40,092
(% of AGI for various income ranges: 7.0% for AGIs below $25k, 19.6% for AGIs $25k-50k, 71.2% for AGIs $50k-75k, 150.3% for AGIs $75k-100k, 591.2% for AGIs $100k-200k, 6694.0% for AGIs over 200k)
Profit/loss from business: +$6,110 (reported on 11.2% of returns)
Here:
+$6,110
State:
+$18,312
(% of AGI for various income ranges: 44.9% for AGIs below $25k, 86.2% for AGIs $25k-50k, 90.9% for AGIs $50k-75k, 70.3% for AGIs $75k-100k, 3428.0% for AGIs over 200k)
Taxable individual retirement arrangement distribution: $24,084 (reported on 7.9% of returns)
99320:
$24,084
Washington:
$24,221
(% of AGI for various income ranges: 49.4% for AGIs below $25k, 114.5% for AGIs $25k-50k, 171.2% for AGIs $50k-75k, 316.2% for AGIs $75k-100k, 729.4% for AGIs $100k-200k, 3026.0% for AGIs over 200k)
Total itemized deductions: $27,861 (reported on 6.0% of returns)
Here:
$27,861
State:
$39,068
(% of AGI for various income ranges: 165.2% for AGIs $25k-50k, 132.0% for AGIs $50k-75k, 282.6% for AGIs $75k-100k, 625.6% for AGIs $100k-200k, 2592.0% for AGIs over 200k)
Charity contributions: $8,243 (reported on 4.5% of returns)
Here:
$8,243
State:
$15,331
(% of AGI for various income ranges: 11.9% for AGIs $25k-50k, 11.6% for AGIs $50k-75k, 34.6% for AGIs $75k-100k, 178.2% for AGIs $100k-200k, 1058.0% for AGIs over 200k)
Taxes paid: $6,437 (reported on 5.8% of returns)
99320:
$6,437
State:
$7,774
(% of AGI for various income ranges: 25.5% for AGIs $25k-50k, 28.6% for AGIs $50k-75k, 69.7% for AGIs $75k-100k, 157.0% for AGIs $100k-200k, 568.0% for AGIs over 200k)
Earned income credit: $2,348 (reported on 13.7% of returns)
Here:
$2,348
State:
$2,020
(% of AGI for various income ranges: 85.6% for AGIs below $25k, 69.6% for AGIs $25k-50k)
Percentage of individuals using paid preparers for their 2020 taxes: 92.9%
Here:
93%
State:
93%
(% for various income ranges: 92.3% for AGIs below $25k, 92.9% for AGIs $25k-50k, 92.0% for AGIs $50k-75k, 92.7% for AGIs $75k-100k, 96.2% for AGIs $100k-200k, 85.7% for AGIs over 200k)
Averages for the 2012 tax year for zip code 99320, filed in 2013:
Average Adjusted Gross Income (AGI) in 2012: $55,952 (Individual Income Tax Returns)
Here:
$55,952
State:
$69,533
Salary/wage: $47,726 (reported on 86.7% of returns)
Here:
$47,726
State:
$57,267
(% of AGI for various income ranges: 78.2% for AGIs below $25k, 78.0% for AGIs $25k-50k, 80.9% for AGIs $50k-75k, 83.2% for AGIs $75k-100k, 80.9% for AGIs $100k-200k, 30.0% for AGIs over 200k)
Taxable interest for individuals: $976 (reported on 28.6% of returns)
This zip code:
$976
Washington:
$1,816
(% of AGI for various income ranges: 1.0% for AGIs below $25k, 0.4% for AGIs $25k-50k, 0.5% for AGIs $50k-75k, 0.3% for AGIs $75k-100k, 0.5% for AGIs $100k-200k, 0.6% for AGIs over 200k)
Ordinary dividends: $2,989 (reported on 11.5% of returns)
Here:
$2,989
State:
$8,163
(% of AGI for various income ranges: 0.8% for AGIs below $25k, 0.4% for AGIs $25k-50k, 0.4% for AGIs $50k-75k, 0.4% for AGIs $75k-100k, 0.5% for AGIs $100k-200k, 1.6% for AGIs over 200k)
Net capital gain/loss in AGI: +$5,762 (reported on 9.4% of returns)
Here:
+$5,762
State:
+$21,568
(% of AGI for various income ranges: 0.3% for AGIs $25k-50k, 0.2% for AGIs $50k-75k, 1.2% for AGIs $100k-200k, 4.5% for AGIs over 200k)
Profit/loss from business: +$6,740 (reported on 11.0% of returns)
Here:
+$6,740
State:
+$16,521
(% of AGI for various income ranges: 3.7% for AGIs below $25k, 0.8% for AGIs $25k-50k, 0.9% for AGIs $50k-75k, 0.8% for AGIs $75k-100k, 2.1% for AGIs $100k-200k)
Taxable individual retirement arrangement distribution: $16,265 (reported on 7.9% of returns)
99320:
$16,265
Washington:
$18,648
(% of AGI for various income ranges: 1.7% for AGIs below $25k, 2.2% for AGIs $25k-50k, 2.9% for AGIs $50k-75k, 2.4% for AGIs $75k-100k, 3.2% for AGIs $100k-200k)
Total itemized deductions: $18,294 (19% of AGI, reported on 27.8% of returns)
Here:
$18,294
State:
$23,872
Here:
18.9% of AGI
State:
18.2% of AGI
(% of AGI for various income ranges: 5.7% for AGIs below $25k, 8.9% for AGIs $25k-50k, 10.8% for AGIs $50k-75k, 9.8% for AGIs $75k-100k, 10.3% for AGIs $100k-200k, 5.5% for AGIs over 200k)
Charity contributions: $3,841 (reported on 20.2% of returns)
Here:
$3,841
State:
$4,465
(% of AGI for various income ranges: 0.4% for AGIs below $25k, 0.9% for AGIs $25k-50k, 1.1% for AGIs $50k-75k, 1.6% for AGIs $75k-100k, 1.9% for AGIs $100k-200k, 1.4% for AGIs over 200k)
Taxes paid: $4,418 (reported on 27.6% of returns)
99320:
$4,418
State:
$6,400
(% of AGI for various income ranges: 1.1% for AGIs below $25k, 1.8% for AGIs $25k-50k, 2.5% for AGIs $50k-75k, 2.4% for AGIs $75k-100k, 2.6% for AGIs $100k-200k, 1.5% for AGIs over 200k)
Earned income credit: $2,277 (reported on 18.1% of returns)
Here:
$2,277
State:
$2,073
(% of AGI for various income ranges: 6.9% for AGIs below $25k, 1.2% for AGIs $25k-50k)
Percentage of individuals using paid preparers for their 2012 taxes: 46.9%
Here:
47%
State:
43%
(% for various income ranges: 41.6% for AGIs below $25k, 46.7% for AGIs $25k-50k, 51.6% for AGIs $50k-75k, 50.0% for AGIs $75k-100k, 48.9% for AGIs $100k-200k, 83.3% for AGIs over 200k)
Averages for the 2004 tax year for zip code 99320, filed in 2005:
Average Adjusted Gross Income (AGI) in 2004: $43,992 (Individual Income Tax Returns)
Here:
$43,992
State:
$54,331
Salary/wage: $42,368 (reported on 89.6% of returns)
Here:
$42,368
State:
$45,761
(% of AGI for various income ranges: 104.0% for AGIs below $10k, 76.8% for AGIs $10k-25k, 86.5% for AGIs $25k-50k, 89.2% for AGIs $50k-75k, 91.5% for AGIs $75k-100k, 80.1% for AGIs over 100k)
Taxable interest for individuals: $792 (reported on 44.8% of returns)
This zip code:
$792
Washington:
$2,110
(% of AGI for various income ranges: 4.2% for AGIs below $10k, 1.6% for AGIs $10k-25k, 0.9% for AGIs $25k-50k, 0.7% for AGIs $50k-75k, 0.5% for AGIs $75k-100k, 0.6% for AGIs over 100k)
Taxable dividends: $1,334 (reported on 13.5% of returns)
Here:
$1,334
State:
$5,879
(% of AGI for various income ranges: 1.0% for AGIs below $10k, 0.7% for AGIs $10k-25k, 0.4% for AGIs $25k-50k, 0.4% for AGIs $50k-75k, 0.3% for AGIs $75k-100k, 0.5% for AGIs over 100k)
Net capital gain/loss: +$5,028 (reported on 11.3% of returns)
Here:
+$5,028
State:
+$15,835
(% of AGI for various income ranges: -1.7% for AGIs below $10k, 0.1% for AGIs $10k-25k, 0.4% for AGIs $25k-50k, 0.5% for AGIs $50k-75k, 1.2% for AGIs $75k-100k, 3.7% for AGIs over 100k)
Profit/loss from business: +$2,665 (reported on 11.7% of returns)
Here:
+$2,665
State:
+$13,994
(% of AGI for various income ranges: -2.1% for AGIs below $10k, 3.4% for AGIs $10k-25k, 1.3% for AGIs $25k-50k, -0.3% for AGIs $50k-75k, 0.1% for AGIs $75k-100k, 1.1% for AGIs over 100k)
IRA payment deduction: $3,113 (reported on 1.8% of returns)
99320:
$3,113
Washington:
$3,001
(% of AGI for various income ranges: 0.2% for AGIs $10k-25k, 0.2% for AGIs $25k-50k, 0.1% for AGIs $50k-75k, 0.2% for AGIs $75k-100k)
Total itemized deductions: $15,545 (22% of AGI, reported on 31.8% of returns)
Here:
$15,545
State:
$19,669
Here:
22.3% of AGI
State:
20.7% of AGI
(% of AGI for various income ranges: 10.1% for AGIs below $10k, 8.2% for AGIs $10k-25k, 10.5% for AGIs $25k-50k, 11.9% for AGIs $50k-75k, 12.3% for AGIs $75k-100k, 11.4% for AGIs over 100k)
Charity contributions deductions: $2,659 (4% of AGI, reported on 25.6% of returns)
Here:
$2,659
State:
$3,569
Here:
3.6% of AGI
State:
3.5% of AGI
(% of AGI for various income ranges: 0.6% for AGIs below $10k, 0.8% for AGIs $10k-25k, 1.0% for AGIs $25k-50k, 1.6% for AGIs $50k-75k, 1.9% for AGIs $75k-100k, 2.0% for AGIs over 100k)
Total tax: $5,639 (reported on 73.1% of returns)
99320:
$5,639
State:
$9,065
(% of AGI for various income ranges: 1.7% for AGIs below $10k, 3.4% for AGIs $10k-25k, 5.8% for AGIs $25k-50k, 8.5% for AGIs $50k-75k, 10.3% for AGIs $75k-100k, 15.5% for AGIs over 100k)
Earned income credit: $1,788 (reported on 14.8% of returns)
Here:
$1,788
State:
$1,607
Percentage of individuals using paid preparers for their 2004 taxes: 48.4%
Here:
48%
State:
49%
(% for various income ranges: 38.1% for AGIs below $10k, 49.6% for AGIs $10k-25k, 50.7% for AGIs $25k-50k, 50.8% for AGIs $50k-75k, 50.0% for AGIs $75k-100k, 52.4% for AGIs over 100k)
Likely homosexual households (counted as self-reported same-sex unmarried-partner households)
Lesbian couples: 0.0% of all households
Gay men: 0.3% of all households
Household received Food Stamps/SNAP in the past 12 months: 796 Household did not receive Food Stamps/SNAP in the past 12 months: 2,902
Women who had a birth in the past 12 months: 203 (144 now married, 56 unmarried) Women who did not have a birth in the past 12 months: 2,046 (905 now married, 1,141 unmarried)
Housing units in zip code 99320 with a mortgage: 2,015 (138 second mortgage, 129 both second mortgage and home equity loan) Houses without a mortgage: 7
Median monthly owner costs for units with a mortgage: $1,449 Median monthly owner costs for units without a mortgage: $461
Residents with income below the poverty level in 2022:
This zip code:
11.2%
Whole state:
10.0%
Residents with income below 50% of the poverty level in 2022:
This zip code:
5.4%
Whole state:
4.6%
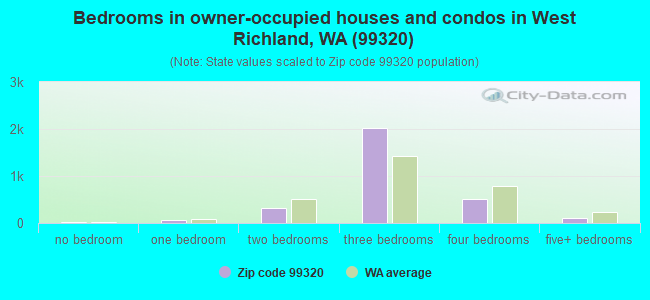
Median number of rooms in houses and condos:
Here:
6.1
State:
6.5
Median number of rooms in apartments:
Here:
4.7
State:
3.9
Notable locations in this zip code not listed on our city pages
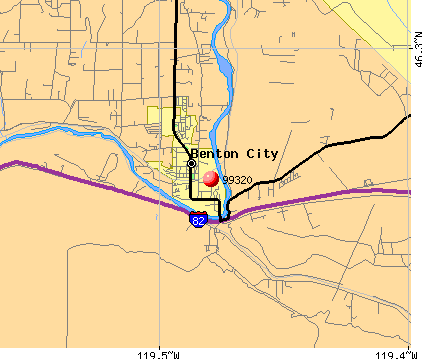
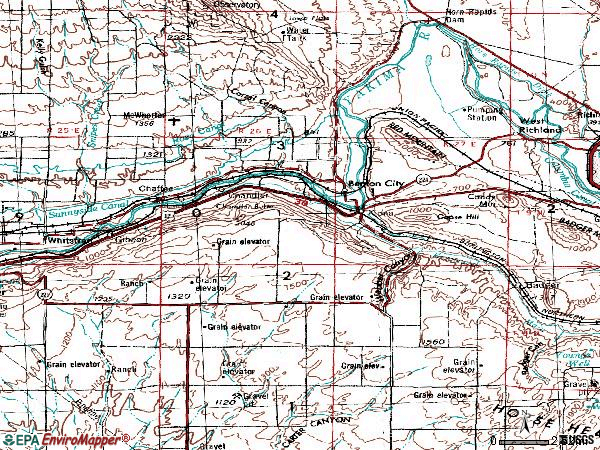
Notable locations in zip code 99320: Grosscup (A), Chandler Power and Pumping Plant (B), Chandler (C), Hodges Ranch (D), The Badlands (E), Benton County Fire District 1 Station 150 (F), Benton County Fire District 2 (G), Benton County Fire Protection District 5 Station 510 (H). Display/hide their locations on the map
1,622 married couples with children.
553 single-parent households (123 men, 430 women).
79.5% of residents of 99320 zip code speak English at home.
19.0% of residents speak Spanish at home (50% very well, 20% well, 24% not well, 6% not at all).
0.8% of residents speak other Indo-European language at home (67% very well, 32% well, 1% not well).
0.3% of residents speak Asian or Pacific Island language at home (93% very well, 7% not well).
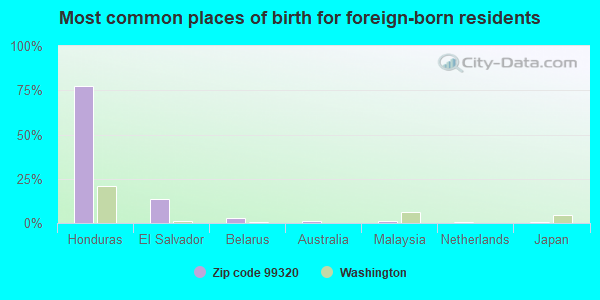
Foreign born population: 1,158 (11.4%) (26.7% of them are naturalized citizens)
This zip code:
11.4%
Whole state:
15.3%
77%Honduras
14%El Salvador
3%Belarus
1%Australia
1%Malaysia
1%Netherlands
0%Japan
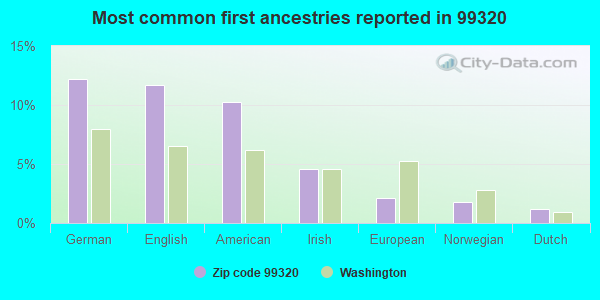
12%German
12%English
10%American
5%Irish
2%European
2%Norwegian
1%Dutch
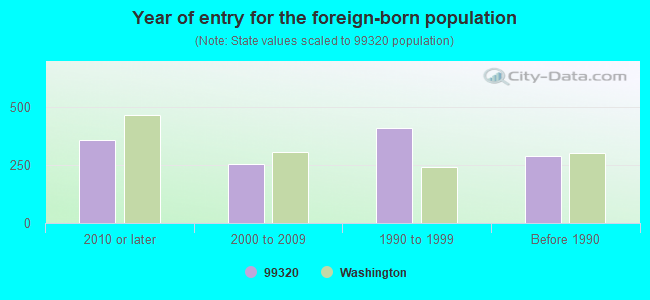
Year of entry for the foreign-born population
3582010 or later
2552000 to 2009
4081990 to 1999
290Before 1990
Facilities with environmental interests located in this zip code:
A & B ASPHALT (16004 E FIELD ROAD in BENTON CITY, WA)
CRITERIA AND HAZARDOUS AIR POLLUTANT INVENTORY (Inventory of air pollution sources) National Pollutant Discharge Elimination System NON-MAJOR (Tracking pollutant discharge elimination systems) - permit National Pollutant Discharge Elimination System NON-MAJOR (Tracking pollutant discharge elimination systems) - permit National Pollutant Discharge Elimination System NON-MAJOR (Tracking pollutant discharge elimination systems) - permit STATE MASTER (Washington State Department of Ecology's Facility/Site identification system) - WATQUAL-WAG505080, National Pollutant Discharge Elimination System Permit Business SIC classification: DAIRY FARMS; CRUSHED AND BROKEN STONE; CONSTRUCTION SAND AND GRAVEL; ASPHALT PAVING MIXTURES AND BLOCKS; CONCRETE PRODUCTS, EXCEPT BLOCK AND BRICK; READY-MIXED CONCRETE Organizations: A AND B ASPHALT (CONTACT/OWNER)
AMERICAN ROCK PRODUCTS KIONA QUARRY (KENNEDY RD BOMBING RANGE in BENTON CITY, WA)
National Pollutant Discharge Elimination System NON-MAJOR (Tracking pollutant discharge elimination systems) - permit STATE MASTER (Washington State Department of Ecology's Facility/Site identification system) - WATQUAL-WAG505067, National Pollutant Discharge Elimination System Permit Business SIC classification: DAIRY FARMS; CRUSHED AND BROKEN STONE Alternative names: DEATLEY CRUSHING -, DEATLEY CRUSHING KIONA PIT, DEATLEY CRUSHING - KIONA QUARR, DEATLEY CRUSHING KIONA QUARRY
Housing units lacking complete plumbing facilities: 2.2% Housing units lacking complete kitchen facilities: 0.6%
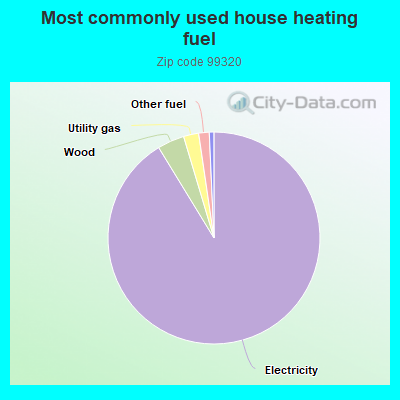
91.0%Electricity
4.1%Wood
2.3%Utility gas
1.6%Other fuel
0.7%Bottled, tank, or LP gas
Population in 1990: 5,047. Population change in the 1990s: +3,239 (+64.2%).
Place of birth for U.S.-born residents:
This state: 5,813
Northeast: 169
Midwest: 418
South: 531
West: 1,866
55% of the 99320 zip code residents lived in the same house 5 years ago. Out of people who lived in different houses, 57% lived in this county. Out of people who lived in different counties, 50% lived in Washington.
93% of the 99320 zip code residents lived in the same house 1 year ago. Out of people who lived in different houses, 55% moved from this county. Out of people who lived in different houses, 26% moved from different county within same state. Out of people who lived in different houses, 20% moved from different state. Out of people who lived in different houses, 5% moved from abroad.
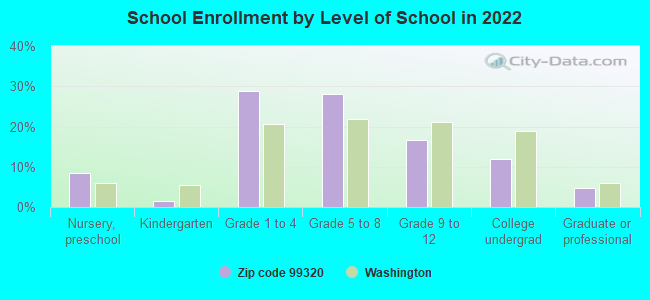
Private vs. public school enrollment:
Students in private schools in grades 1 to 8 (elementary and middle school): 93
Here:
7.9%
Washington:
12.4%
Students in private schools in grades 9 to 12 (high school): 18
Here:
5.3%
Washington:
9.2%
Students in private undergraduate colleges: 9
Here:
3.9%
Washington:
16.5%
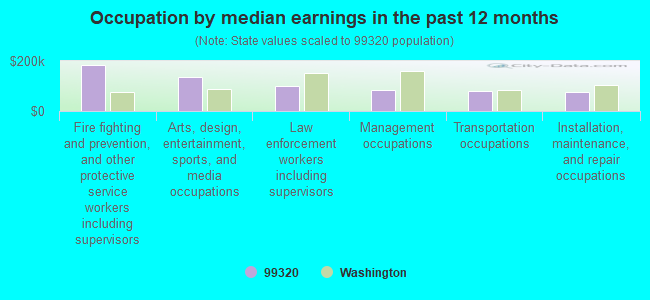
Occupation by median earnings in the past 12 months ($)
183,069Fire fighting and prevention, and other protective service workers including supervisors
137,810Arts, design, entertainment, sports, and media occupations
98,831Law enforcement workers including supervisors
83,979Management occupations
81,793Transportation occupations
77,205Installation, maintenance, and repair occupations
Companies with federal contracts located in this zip code:
DEL SOL ENTERPRISES (52929 EAST KENNEDY ROAD in BENTON CITY, WA; small business) : $1,658,495 in 26 contractsfrom 2000 to 2005
Contracts for Landscaping/Groundskeeping Services, Maintenance, Repair or Alteration of Real Property -- Recreation Facilities (Non-Building), Maintenance, Repair or Alteration of Real Property -- Miscellaneous Buildings by Army, U.S. Army Corps of Engineers - civil program financing only, Navy Signed by year:2000: $97,399; 2001: $100,136; 2002: $58,929; 2003: $334,987; 2004: $517,034; 2005: $550,010; 2006: $0.
Biggest contracts:
$282,597 with Army for Landscaping/Groundskeeping Services. Taking place in OR. Signed on 2005-12-30. Completion date: 2006-12-29.
$275,289 with U.S. Army Corps of Engineers - civil program financing only for Landscaping/Groundskeeping Services. Taking place in OR. Signed on 2003-02-07. Completion date: 2006-12-29.
$214,442, same as above.Signed on 2004-04-09. Completion date: 2006-12-29.
$214,442 with Army for Landscaping/Groundskeeping Services. Taking place in OR. Signed on 2004-04-09. Completion date: 2006-12-29.
DEL SOL ENTERPRISES (52929 E KENNEDY RD NE in BENTON CITY, WA; small business) : $1,345,630 in 48 contractsfrom 1999 to 2006
Contracts for Custodial Janitorial Services, Landscaping/Groundskeeping Services by ENERGY, Department of, Army, U.S. Army Corps of Engineers - civil program financing only Signed by year:2000: $273,000; 2001: $216,795; 2002: $250,501; 2003: $199,657; 2004: $159,874; 2005: $188,204; 2006: -$412.
Biggest contracts:
$273,000 with ENERGY, Department of for Custodial Janitorial Services. Signed on 2000-07-15. Completion date: 2001-07-15.
$160,000, same as above.Signed on 2002-09-15. Completion date: 2003-07-15.
$140,876, same as above.Signed on 2001-07-15. Completion date: 2002-07-15.
$78,466 with Army for Custodial Janitorial Services. Signed on 2003-12-09. Completion date: 2006-08-30.
Top industries in this zip code by the number of employees in 2005:
Construction: Highway, Street, and Bridge Construction (50-99 employees: 1 establishment)
Mining: Other Crushed and Broken Stone Mining and Quarrying (20-49: 1)
Health Care and Social Assistance: Child Day Care Services (10-19: 1, 5-9: 1, 1-4: 1)
2002 - 2018 National Fire Incident Reporting System (NFIRS) incidents
According to the data from the years 2002 - 2018 the average number of fire incidents per year is 126. The highest number of reported fires - 197 took place in 2007, and the least - 66 in 2004. The data has an increasing trend.
When looking into fire subcategories, the most reports belonged to: Outside Fires (61.8%), and Structure Fires (23.8%).
Fire incident types reported to NFIRS in Zip Code 99320


 Nearest zip codes: 99353, 99354, 99352, 99350, 99338, 98944.


 According to the data from the years 2002 - 2018 the average number of fire incidents per year is 126. The highest number of reported fires - 197 took place in 2007, and the least - 66 in 2004. The data has an increasing trend.
 When looking into fire subcategories, the most reports belonged to: Outside Fires (61.8%), and Structure Fires (23.8%).