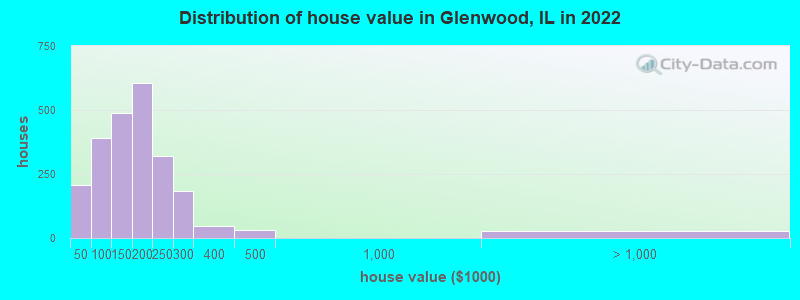
Estimated median house or condo value in 2022: $161,219 (it was $117,300 in 2000)
Glenwood:
$161,219
IL:
$251,600
Mean prices in 2022:all housing units: $171,161; detached houses: $189,537; townhouses or other attached units: $115,891; in 3-to-4-unit structures: $50,571; in 5-or-more-unit structures: $111,816
Median gross rent in 2022: $1,681.
March 2022 cost of living index in Glenwood: 101.0 (near average, U.S. average is 100)
Percentage of residents living in poverty in 2022: 8.9%
(12.5% for White Non-Hispanic residents, 6.6% for Black residents, 31.1% for Hispanic or Latino residents, 64.3% for other race residents, 2.6% for two or more races residents)
According to our research of Illinois and other state lists, there were 11 registered sex offenders living in Glenwood, Illinois as of May 19, 2024. The ratio of all residents to sex offenders in Glenwood is 801 to 1. The ratio of registered sex offenders to all residents in this city is near the state average.
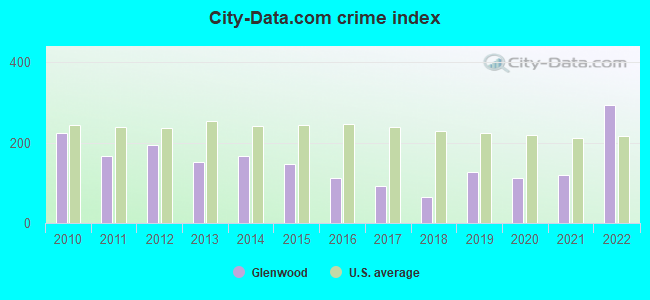
Crime rates in Glenwood by year
Type
2010
2011
2012
2013
2014
2015
2016
2017
2018
2019
2020
2021
2022
Murders (per 100,000)
0 (0.0)
0 (0.0)
0 (0.0)
0 (0.0)
0 (0.0)
0 (0.0)
0 (0.0)
1 (11.2)
0 (0.0)
1 (11.4)
0 (0.0)
0 (0.0)
3 (36.1)
Rapes (per 100,000)
2 (22.3)
0 (0.0)
0 (0.0)
0 (0.0)
0 (0.0)
0 (0.0)
0 (0.0)
0 (0.0)
0 (0.0)
0 (0.0)
0 (0.0)
1 (11.7)
5 (60.1)
Robberies (per 100,000)
9 (100.3)
3 (33.3)
12 (133.2)
11 (121.4)
17 (187.5)
9 (99.5)
7 (77.8)
5 (56.2)
6 (67.7)
7 (79.8)
6 (69.1)
6 (69.9)
10 (120.2)
Assaults (per 100,000)
8 (89.2)
10 (111.2)
10 (111.0)
2 (22.1)
7 (77.2)
9 (99.5)
6 (66.7)
7 (78.7)
5 (56.4)
7 (79.8)
5 (57.6)
8 (93.2)
11 (132.3)
Burglaries (per 100,000)
84 (936.6)
66 (733.7)
61 (676.9)
41 (452.5)
28 (308.8)
53 (585.9)
27 (300.1)
24 (269.8)
21 (236.9)
18 (205.3)
27 (310.9)
10 (116.6)
14 (168.3)
Thefts (per 100,000)
121 (1,349)
140 (1,556)
181 (2,008)
151 (1,667)
143 (1,577)
116 (1,282)
105 (1,167)
31 (348.4)
30 (338.4)
51 (581.7)
43 (495.1)
79 (920.7)
101 (1,214)
Auto thefts (per 100,000)
43 (479.4)
23 (255.7)
5 (55.5)
13 (143.5)
12 (132.4)
7 (77.4)
7 (77.8)
5 (56.2)
4 (45.1)
29 (330.8)
40 (460.6)
27 (314.7)
53 (637.2)
Arson (per 100,000)
0 (0.0)
0 (0.0)
0 (0.0)
0 (0.0)
0 (0.0)
0 (0.0)
0 (0.0)
1 (11.2)
0 (0.0)
1 (11.4)
0 (0.0)
0 (0.0)
1 (12.0)
City-Data.com crime index
223.7
166.3
194.3
150.7
167.0
148.2
110.6
92.4
65.3
126.8
110.7
119.1
294.1
The City-Data.com crime index weighs serious crimes and violent crimes more heavily. Higher means more crime, U.S. average is 246.1. It adjusts for the number of visitors and daily workers commuting into cities.
Latest news from Glenwood, IL collected exclusively by city-data.com from local newspapers, TV, and radio stations
Ancestries: American (7.3%), Italian (2.4%), Polish (2.1%), African (1.3%).
Current Local Time: CST time zone
Incorporated on 03/11/1903
Elevation: 620 feet
Land area: 2.69 square miles.
Population density: 3,109 people per square mile (average).
211 residents are foreign born (1.1% Latin America, 0.7% Africa, 0.4% Asia).
This village:
2.5%
Illinois:
14.1%
Median real estate property taxes paid for housing units with mortgages in 2022: $5,411 (3.0%) Median real estate property taxes paid for housing units with no mortgage in 2022: $3,972 (3.2%)
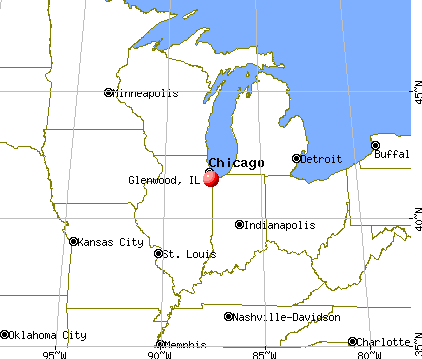
Nearest city with pop. 50,000+: Hammond, IN (7.7 miles , pop. 83,048).
Nearest city with pop. 200,000+: Chicago, IL (20.7 miles , pop. 2,896,016).
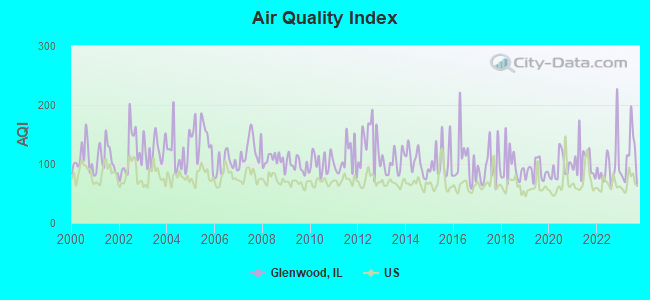
Air Quality Index (AQI) level in 2023 was 111. This is significantly worse than average.
City:
111
U.S.:
73
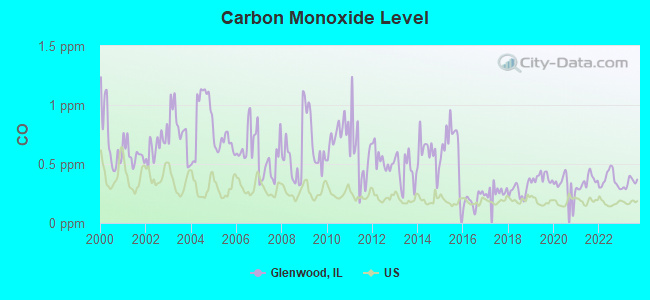
Carbon Monoxide (CO) [ppm] level in 2023 was 0.339. This is worse than average.Closest monitor was 2.7 miles away from the city center.
City:
0.339
U.S.:
0.251
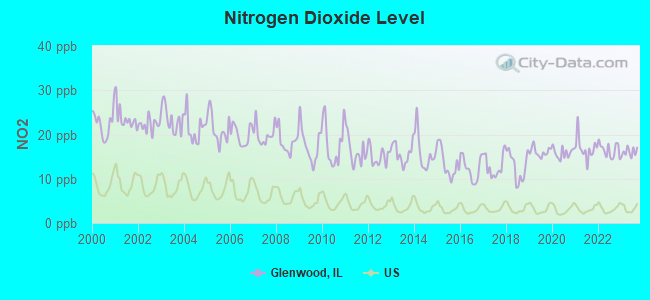
Nitrogen Dioxide (NO2) [ppb] level in 2023 was 16.0. This is significantly worse than average.Closest monitor was 2.7 miles away from the city center.
City:
16.0
U.S.:
5.1
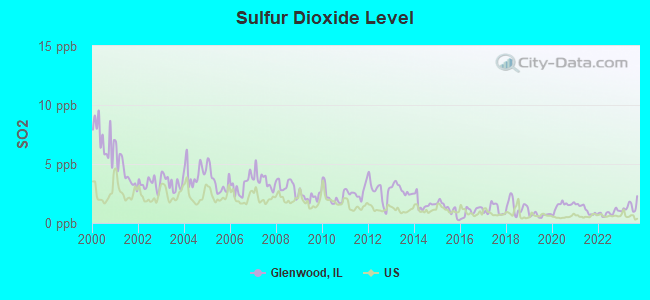
Sulfur Dioxide (SO2) [ppb] level in 2023 was 1.38. This is about average.Closest monitor was 2.7 miles away from the city center.
City:
1.38
U.S.:
1.51
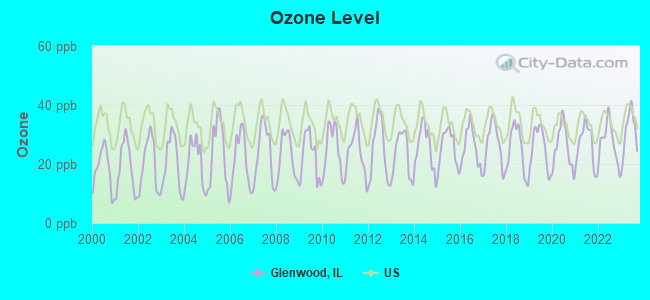
Ozone [ppb] level in 2023 was 31.0. This is about average.Closest monitor was 2.7 miles away from the city center.
City:
31.0
U.S.:
33.3
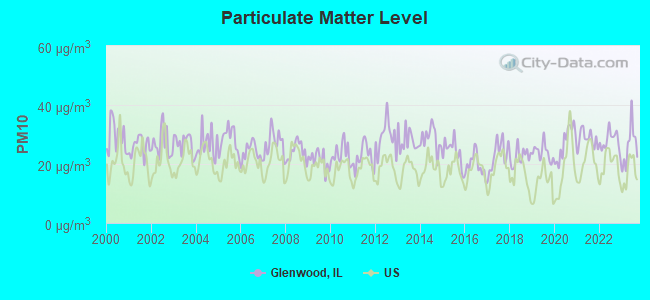
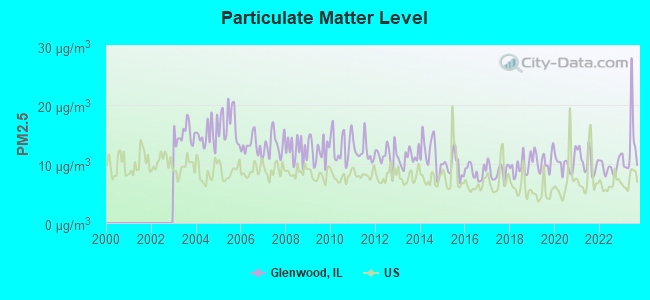
Particulate Matter (PM10) [µg/m3] level in 2023 was 26.1. This is worse than average.Closest monitor was 7.2 miles away from the city center.
City:
26.1
U.S.:
19.2
Particulate Matter (PM2.5) [µg/m3] level in 2023 was 12.9. This is significantly worse than average.Closest monitor was 3.7 miles away from the city center.
City:
12.9
U.S.:
8.1
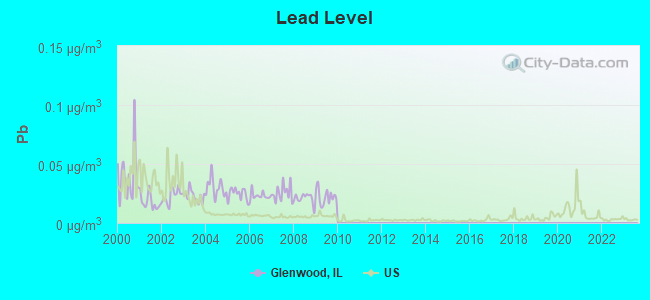
Lead (Pb) [µg/m3] level in 2009 was 0.0223. This is significantly worse than average.Closest monitor was 2.7 miles away from the city center.
City:
0.0223
U.S.:
0.0093
Tornado activity:
Glenwood-area historical tornado activity is near Illinois state average. It is 61% greater than the overall U.S. average.
On 8/28/1990, a category F5 (max. wind speeds 261-318 mph) tornado 25.3 miles away from the Glenwood village center killed 29 peopleand injured 350 peopleand causedbetween $50,000 and $500,000 in damages.
On 4/21/1967, a category F4 (max. wind speeds 207-260 mph) tornado 13.2 miles away from the village center killed 33 peopleand injured 500 peopleand causedbetween $5,000,000 and $50,000,000 in damages.
Earthquake activity:
Glenwood-area historical earthquake activity is significantly above Illinois state average. It is 44% greater than the overall U.S. average.
On 4/18/2008 at 09:36:59, a magnitude 5.4 (5.1 MB, 4.8 MS, 5.4 MW, 5.2 MW, Class: Moderate, Intensity: VI - VII) earthquake occurred 214.4 miles away from the city center On 6/10/1987 at 23:48:54, a magnitude 5.1 (4.9 MB, 4.4 MS, 4.6 MS, 5.1 LG) earthquake occurred 189.0 miles away from the city center On 4/18/2008 at 09:36:59, a magnitude 5.2 (5.2 MW, Depth: 8.9 mi) earthquake occurred 214.5 miles away from the city center On 6/28/2004 at 06:10:52, a magnitude 4.2 (4.2 MW, Depth: 6.2 mi, Class: Light, Intensity: IV - V) earthquake occurred 67.0 miles away from Glenwood center On 6/18/2002 at 17:37:15, a magnitude 5.0 (4.3 MB, 4.6 MW, 5.0 LG) earthquake occurred 246.3 miles away from the city center On 4/18/2008 at 15:14:16, a magnitude 4.8 (4.5 MB, 4.8 MW, 4.6 MW) earthquake occurred 212.6 miles away from the city center Magnitude types: regional Lg-wave magnitude (LG), body-wave magnitude (MB), surface-wave magnitude (MS), moment magnitude (MW)
Natural disasters:
The number of natural disasters in Cook County (20) is greater than the US average (15). Major Disasters (Presidential) Declared: 15 Emergencies Declared: 4
Causes of natural disasters: Floods: 13, Storms: 12, Tornadoes: 3, Snowstorms: 2, Winter Storms: 2, Blizzard: 1, Hurricane: 1, Snow: 1, Wind: 1, Other: 1 (Note: some incidents may be assigned to more than one category).
Main business address for: LANDAUER INC (MEASURING & CONTROLLING DEVICES, NEC).
Hospitals and medical centers in Glenwood:
GLENWOOD HEALTHCARE AND REHAB. (19330 SOUTH COTTAGE GROVE)
Other hospitals and medical centers near Glenwood:
SOUTH SUBURBAN REHAB CENTER (Nursing Home, about 2 miles away; HOMEWOOD, IL)
MANORCARE OF HOMEWOOD (Nursing Home, about 3 miles away; HOMEWOOD, IL)
HOPE HOME HEALTH, INC (Home Health Center, about 3 miles away; HOMEWOOD, IL)
BROADWAY TERRACE (Hospital, about 3 miles away; CHICAGO HEIGHTS, IL)
GENCARE HEALTH SERVICES INC. (Home Health Center, about 3 miles away; CHICAGO HEIGHTS, IL)
PRAIRIE MANOR NRSG AND REHAB CTR (Nursing Home, about 3 miles away; CHICAGO HEIGHTS, IL)
HOME BOUND HEALTHCARE, INC (Home Health Center, about 3 miles away; FLOSSMOOR, IL)
Amtrak stations near Glenwood:
4 miles: HOMEWOOD (181 1ST ST. & PARK AVE.) . Services: ticket office, enclosed waiting area, public restrooms, public payphones, paid short-term parking, paid long-term parking, public transit connection.
GLENWOOD-LYNWOOD PUBLIC LIBRARY DISTRICT (Operating income: $1,414,436; Location: 320 EAST GLENWOOD LANSING ROAD; 34,844 books; 1,369 audio materials; 743 video materials; 8 local licensed databases; 19 state licensed databases; 1 other licensed databases; 119 print serial subscriptions)
User-submitted facts and corrections:
Glenwood School for Boys is now Glenwood School for Boys and Girls. It began accepting girls in 2000
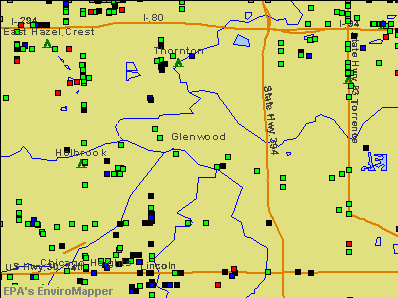
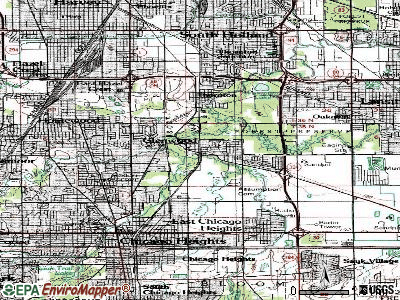
Notable locations in Glenwood: Glenwoodie Country Club (A), Glenwood Fire Department Station 2 (B), Glenwood Fire Department Station 1 (C), Glenwood-Lynwood Public Library (D). Display/hide their locations on the map
Birthplace of: Derrick Walker (American football) - Football player.
Cook County has a predicted average indoor radon screening level between 2 and 4 pCi/L (pico curies per liter) - Moderate Potential
Drinking water stations with addresses in Glenwood that have no violations reported:
SKYLINE POOL (Population served: 175,Primary Water Source Type: Groundwater)
Average household size:
This village:
2.6 people
Illinois:
2.6 people
Percentage of family households:
This village:
71.1%
Whole state:
65.8%
Percentage of households with unmarried partners:
This village:
5.4%
Whole state:
6.3%
Likely homosexual households (counted as self-reported same-sex unmarried-partner households)
Lesbian couples: 0.3% of all households
Gay men: 0.2% of all households
People in group quarters in Glenwood in 2010:
188 people in workers' group living quarters and job corps centers
163 people in nursing facilities/skilled-nursing facilities
6 people in group homes for juveniles (non-correctional)
Banks with branches in Glenwood (2011 data):
JPMorgan Chase Bank, National Association: Glenwood-Illinois Banking Ctr. Branc at 18701 South Halsted Street, branch established on 2005/12/29. Info updated 2011/11/10: Bank assets: $1,811,678.0 mil, Deposits: $1,190,738.0 mil, headquarters in Columbus, OH, positive income, International Specialization, 5577 total offices, Holding Company: Jpmorgan Chase & Co.
Guaranty Bank: Glenwood Office at 103 Holbrook Road, branch established on 2005/09/13. Info updated 2011/07/21: Bank assets: $1,179.1 mil, Deposits: $1,102.7 mil, headquarters in Milwaukee, WI, negative income in the last year, Mortgage Lending Specialization, 166 total offices
MB Financial Bank, National Association: Glenwood Branch at 18301 South Halsted, branch established on 1969/11/28. Info updated 2010/04/27: Bank assets: $9,792.4 mil, Deposits: $7,757.4 mil, headquarters in Chicago, IL, positive income, Commercial Lending Specialization, 93 total offices, Holding Company: Mb Financial, Inc
Religion statistics for Glenwood, IL (based on Cook County data)
Religion
Adherents
Congregations
Catholic
1,947,223
376
Evangelical Protestant
432,975
1,484
Other
312,636
403
Mainline Protestant
202,114
630
Black Protestant
148,895
395
Orthodox
53,276
66
None
2,097,556
-
Source: Clifford Grammich, Kirk Hadaway, Richard Houseal, Dale E.Jones, Alexei Krindatch, Richie Stanley and Richard H.Taylor. 2012. 2010 U.S.Religion Census: Religious Congregations & Membership Study. Association of Statisticians of American Religious Bodies. Jones, Dale E., et al. 2002. Congregations and Membership in the United States 2000. Nashville, TN: Glenmary Research Center. Graphs represent county-level data
Aircraft: BEECH 35-C33A (Category: Land, Seats: 4, Weight: Up to 12,499 Pounds, Speed: 142 mph), Engine: CONT MOTOR IO 520 SERIES (285 HP) (Reciprocating) N-Number: 1CK, N1CK, N-1CK, Serial Number: CE-30, Year manufactured: 1966, Airworthiness Date: 03/22/1966, Certificate Issue Date: 04/24/1995 Registrant (Individual): Nick Wilson, 335 W 194th St, Glenwood, IL 60425
Aircraft: CESSNA 172P (Category: Land, Seats: 4, Weight: Up to 12,499 Pounds), Engine: LYCOMING 0-320 SERIES (180 HP) (Reciprocating) N-Number: 5463K, N5463K, N-5463K, Serial Number: 17274129, Year manufactured: 1980, Airworthiness Date: 07/10/1980, Certificate Issue Date: 07/18/1983 Registrant (Individual): William C Gundlach, 4 N State St, Glenwood, IL 60425
Aircraft: HUGHES SONERAI-1 (Category: Land, Weight: Up to 12,499 Pounds, Speed: 85 mph), Engine: VOLKSWAGEN CONVERSION (36 HP) (Reciprocating) N-Number: 9WX, N9WX, N-9WX, Serial Number: 112, Year manufactured: 1973, Airworthiness Date: 05/08/1978, Certificate Issue Date: 04/19/1982 Registrant (Individual): Gerald Lee Netherton, 401 Tulip Dr, Glenwood, IL 60425
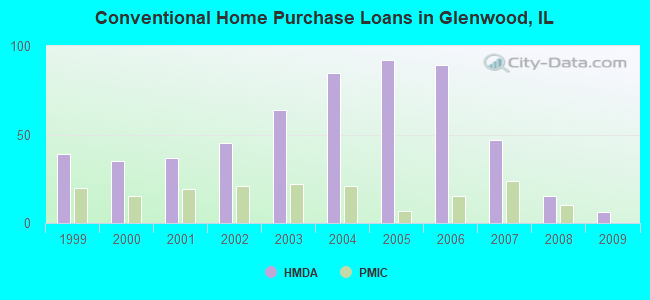
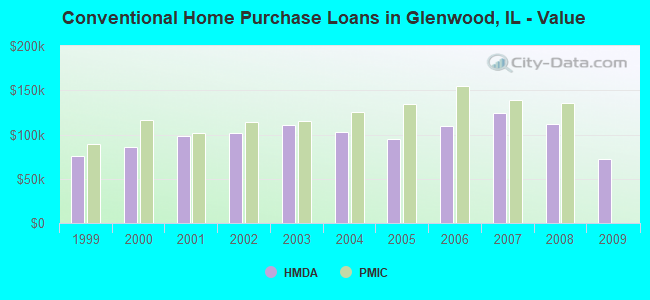
Home Mortgage Disclosure Act Aggregated Statistics For Year 2009 (Based on 3 partial tracts)
A) FHA, FSA/RHS & VA Home Purchase Loans
B) Conventional Home Purchase Loans
C) Refinancings
D) Home Improvement Loans
E) Loans on Dwellings For 5+ Families
F) Non-occupant Loans on < 5 Family Dwellings (A B C & D)
Number
Average Value
Number
Average Value
Number
Average Value
Number
Average Value
Number
Average Value
Number
Average Value
LOANS ORIGINATED
15
$125,773
6
$71,852
51
$133,204
2
$23,435
0
$0
7
$94,929
APPLICATIONS APPROVED, NOT ACCEPTED
1
$72,110
1
$11,490
5
$129,722
0
$0
0
$0
0
$0
APPLICATIONS DENIED
3
$135,113
5
$100,140
29
$140,278
5
$35,428
1
$507,800
1
$34,440
APPLICATIONS WITHDRAWN
2
$78,510
1
$57,890
11
$139,885
2
$39,860
0
$0
0
$0
FILES CLOSED FOR INCOMPLETENESS
1
$64,590
1
$67,030
7
$125,934
0
$0
0
$0
0
$0
Aggregated Statistics For Year 2008 (Based on 3 partial tracts)
A) FHA, FSA/RHS & VA Home Purchase Loans
B) Conventional Home Purchase Loans
C) Refinancings
D) Home Improvement Loans
E) Loans on Dwellings For 5+ Families
F) Non-occupant Loans on < 5 Family Dwellings (A B C & D)
G) Loans On Manufactured Home Dwelling (A B C & D)
Number
Average Value
Number
Average Value
Number
Average Value
Number
Average Value
Number
Average Value
Number
Average Value
Number
Average Value
LOANS ORIGINATED
12
$162,827
15
$112,006
49
$143,840
4
$74,778
1
$513,800
9
$94,728
0
$0
APPLICATIONS APPROVED, NOT ACCEPTED
2
$140,925
2
$143,235
8
$154,394
1
$38,230
0
$0
0
$0
0
$0
APPLICATIONS DENIED
3
$148,710
6
$154,455
63
$146,114
8
$79,838
0
$0
4
$122,722
1
$7,150
APPLICATIONS WITHDRAWN
3
$123,450
2
$196,100
16
$135,701
1
$88,370
0
$0
1
$137,970
0
$0
FILES CLOSED FOR INCOMPLETENESS
1
$150,580
1
$152,600
6
$161,543
1
$51,380
0
$0
0
$0
0
$0
Aggregated Statistics For Year 2007 (Based on 3 partial tracts)
A) FHA, FSA/RHS & VA Home Purchase Loans
B) Conventional Home Purchase Loans
C) Refinancings
D) Home Improvement Loans
E) Loans on Dwellings For 5+ Families
F) Non-occupant Loans on < 5 Family Dwellings (A B C & D)
Number
Average Value
Number
Average Value
Number
Average Value
Number
Average Value
Number
Average Value
Number
Average Value
LOANS ORIGINATED
6
$169,302
47
$124,404
87
$139,062
14
$65,679
1
$266,000
8
$131,008
APPLICATIONS APPROVED, NOT ACCEPTED
0
$0
15
$104,315
18
$147,703
2
$13,155
0
$0
3
$80,667
APPLICATIONS DENIED
6
$170,385
30
$119,965
87
$142,246
20
$59,368
0
$0
5
$99,572
APPLICATIONS WITHDRAWN
0
$0
8
$99,580
19
$162,203
3
$82,247
0
$0
1
$117,830
FILES CLOSED FOR INCOMPLETENESS
0
$0
2
$197,705
12
$156,306
1
$139,750
0
$0
2
$131,640
Aggregated Statistics For Year 2006 (Based on 3 partial tracts)
A) FHA, FSA/RHS & VA Home Purchase Loans
B) Conventional Home Purchase Loans
C) Refinancings
D) Home Improvement Loans
E) Loans on Dwellings For 5+ Families
F) Non-occupant Loans on < 5 Family Dwellings (A B C & D)
Number
Average Value
Number
Average Value
Number
Average Value
Number
Average Value
Number
Average Value
Number
Average Value
LOANS ORIGINATED
4
$160,255
89
$109,929
104
$136,667
12
$75,868
2
$2,675,875
19
$115,238
APPLICATIONS APPROVED, NOT ACCEPTED
0
$0
16
$100,598
29
$143,739
3
$66,617
0
$0
4
$91,005
APPLICATIONS DENIED
1
$221,280
36
$113,636
100
$139,581
21
$42,173
0
$0
8
$95,989
APPLICATIONS WITHDRAWN
2
$173,030
21
$124,260
37
$122,041
2
$118,875
0
$0
4
$95,178
FILES CLOSED FOR INCOMPLETENESS
0
$0
6
$110,673
19
$146,590
0
$0
0
$0
0
$0
Aggregated Statistics For Year 2005 (Based on 3 partial tracts)
A) FHA, FSA/RHS & VA Home Purchase Loans
B) Conventional Home Purchase Loans
C) Refinancings
D) Home Improvement Loans
E) Loans on Dwellings For 5+ Families
F) Non-occupant Loans on < 5 Family Dwellings (A B C & D)
Number
Average Value
Number
Average Value
Number
Average Value
Number
Average Value
Number
Average Value
Number
Average Value
LOANS ORIGINATED
7
$162,309
92
$95,387
125
$123,814
8
$51,834
2
$314,145
17
$103,214
APPLICATIONS APPROVED, NOT ACCEPTED
1
$122,440
25
$100,782
25
$121,996
3
$53,427
0
$0
5
$90,798
APPLICATIONS DENIED
1
$141,130
43
$101,139
101
$123,866
21
$42,666
0
$0
11
$100,609
APPLICATIONS WITHDRAWN
0
$0
15
$107,993
48
$136,565
7
$173,157
0
$0
4
$106,198
FILES CLOSED FOR INCOMPLETENESS
0
$0
9
$107,107
20
$129,108
1
$2,540
0
$0
1
$34,530
Aggregated Statistics For Year 2004 (Based on 3 partial tracts)
A) FHA, FSA/RHS & VA Home Purchase Loans
B) Conventional Home Purchase Loans
C) Refinancings
D) Home Improvement Loans
F) Non-occupant Loans on < 5 Family Dwellings (A B C & D)
Number
Average Value
Number
Average Value
Number
Average Value
Number
Average Value
Number
Average Value
LOANS ORIGINATED
14
$138,334
85
$102,617
112
$111,724
13
$48,858
15
$84,748
APPLICATIONS APPROVED, NOT ACCEPTED
1
$128,890
25
$98,360
24
$119,993
2
$68,475
2
$79,160
APPLICATIONS DENIED
2
$142,875
34
$100,097
91
$114,531
16
$38,872
6
$65,992
APPLICATIONS WITHDRAWN
1
$73,400
11
$116,215
38
$119,889
1
$72,640
3
$110,117
FILES CLOSED FOR INCOMPLETENESS
0
$0
6
$96,070
18
$125,543
0
$0
1
$95,380
Aggregated Statistics For Year 2003 (Based on 3 partial tracts)
A) FHA, FSA/RHS & VA Home Purchase Loans
B) Conventional Home Purchase Loans
C) Refinancings
D) Home Improvement Loans
E) Loans on Dwellings For 5+ Families
F) Non-occupant Loans on < 5 Family Dwellings (A B C & D)
Number
Average Value
Number
Average Value
Number
Average Value
Number
Average Value
Number
Average Value
Number
Average Value
LOANS ORIGINATED
14
$134,184
64
$110,980
158
$103,615
7
$25,449
2
$304,605
7
$83,281
APPLICATIONS APPROVED, NOT ACCEPTED
1
$176,500
12
$88,019
29
$101,523
2
$35,830
1
$558,580
2
$82,765
APPLICATIONS DENIED
2
$134,075
21
$107,540
77
$103,380
12
$23,409
0
$0
4
$65,015
APPLICATIONS WITHDRAWN
0
$0
10
$102,457
35
$108,864
1
$13,390
1
$177,730
2
$83,965
FILES CLOSED FOR INCOMPLETENESS
2
$116,915
2
$147,110
10
$104,181
0
$0
0
$0
1
$124,950
Aggregated Statistics For Year 2002 (Based on 3 partial tracts)
A) FHA, FSA/RHS & VA Home Purchase Loans
B) Conventional Home Purchase Loans
C) Refinancings
D) Home Improvement Loans
E) Loans on Dwellings For 5+ Families
F) Non-occupant Loans on < 5 Family Dwellings (A B C & D)
Number
Average Value
Number
Average Value
Number
Average Value
Number
Average Value
Number
Average Value
Number
Average Value
LOANS ORIGINATED
20
$126,959
45
$101,323
109
$99,407
6
$17,688
1
$782,440
6
$69,862
APPLICATIONS APPROVED, NOT ACCEPTED
1
$152,010
11
$106,307
22
$106,822
1
$7,930
0
$0
3
$87,637
APPLICATIONS DENIED
4
$120,820
14
$96,694
45
$94,855
7
$21,030
0
$0
1
$91,100
APPLICATIONS WITHDRAWN
1
$160,960
6
$126,723
24
$96,726
1
$46,130
0
$0
1
$79,810
FILES CLOSED FOR INCOMPLETENESS
1
$69,060
2
$79,320
26
$96,133
0
$0
0
$0
0
$0
Aggregated Statistics For Year 2001 (Based on 3 partial tracts)
A) FHA, FSA/RHS & VA Home Purchase Loans
B) Conventional Home Purchase Loans
C) Refinancings
D) Home Improvement Loans
E) Loans on Dwellings For 5+ Families
F) Non-occupant Loans on < 5 Family Dwellings (A B C & D)
Number
Average Value
Number
Average Value
Number
Average Value
Number
Average Value
Number
Average Value
Number
Average Value
LOANS ORIGINATED
27
$117,452
37
$98,801
88
$100,116
8
$22,246
1
$372,870
6
$78,467
APPLICATIONS APPROVED, NOT ACCEPTED
1
$87,100
6
$89,220
17
$92,746
1
$25,310
0
$0
1
$68,720
APPLICATIONS DENIED
4
$128,285
17
$93,708
50
$93,117
11
$12,921
0
$0
4
$87,048
APPLICATIONS WITHDRAWN
3
$124,297
7
$86,139
26
$90,282
3
$28,577
0
$0
0
$0
FILES CLOSED FOR INCOMPLETENESS
0
$0
4
$86,910
9
$82,928
1
$12,720
0
$0
0
$0
Aggregated Statistics For Year 2000 (Based on 3 partial tracts)
A) FHA, FSA/RHS & VA Home Purchase Loans
B) Conventional Home Purchase Loans
C) Refinancings
D) Home Improvement Loans
E) Loans on Dwellings For 5+ Families
F) Non-occupant Loans on < 5 Family Dwellings (A B C & D)
Number
Average Value
Number
Average Value
Number
Average Value
Number
Average Value
Number
Average Value
Number
Average Value
LOANS ORIGINATED
26
$114,873
35
$86,030
30
$76,353
8
$17,952
1
$313,760
1
$98,460
APPLICATIONS APPROVED, NOT ACCEPTED
1
$88,010
7
$72,483
10
$80,450
5
$20,840
0
$0
1
$99,290
APPLICATIONS DENIED
2
$92,550
16
$94,339
49
$77,368
11
$18,269
0
$0
1
$163,430
APPLICATIONS WITHDRAWN
3
$103,187
6
$70,827
19
$76,856
4
$41,950
0
$0
1
$50,010
FILES CLOSED FOR INCOMPLETENESS
0
$0
3
$118,833
9
$100,886
0
$0
0
$0
0
$0
Aggregated Statistics For Year 1999 (Based on 2 partial tracts)
A) FHA, FSA/RHS & VA Home Purchase Loans
B) Conventional Home Purchase Loans
C) Refinancings
D) Home Improvement Loans
E) Loans on Dwellings For 5+ Families
F) Non-occupant Loans on < 5 Family Dwellings (A B C & D)
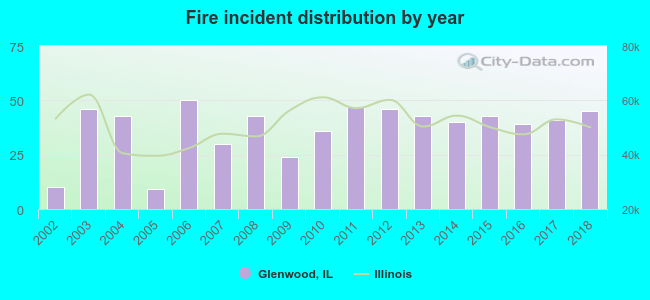
2002 - 2018 National Fire Incident Reporting System (NFIRS) incidents
According to the data from the years 2002 - 2018 the average number of fires per year is 37. The highest number of reported fire incidents - 50 took place in 2006, and the least - 9 in 2005. The data has an increasing trend.
When looking into fire subcategories, the most incidents belonged to: Structure Fires (51.3%), and Outside Fires (23.9%).
Fire incident types reported to NFIRS in Glenwood, IL


 Recent articles from our blog. Our writers, many of them Ph.D. graduates or candidates, create easy-to-read articles on a wide variety of topics.

 (7.7 miles


 According to the data from the years 2002 - 2018 the average number of fires per year is 37. The highest number of reported fire incidents - 50 took place in 2006, and the least - 9 in 2005. The data has an increasing trend.
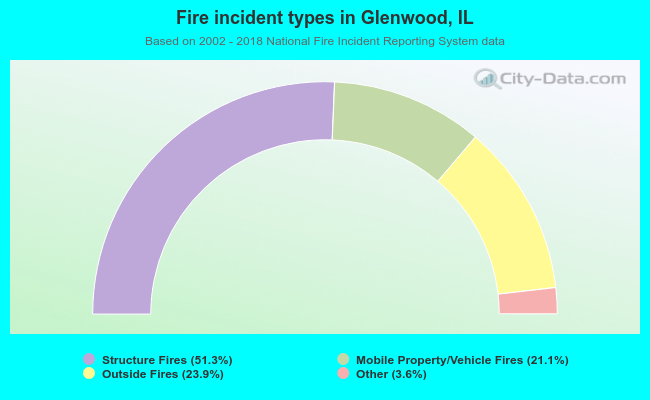 When looking into fire subcategories, the most incidents belonged to: Structure Fires (51.3%), and Outside Fires (23.9%).