Homewood, Illinois Submit your own pictures of this village and show them to the world
OSM Map
General Map
Google Map
MSN Map
OSM Map
General Map
Google Map
MSN Map
OSM Map
General Map
Google Map
MSN Map
OSM Map
General Map
Google Map
MSN Map
Please wait while loading the map...
Population in 2022: 18,735 (100% urban, 0% rural). Population change since 2000: -4.1%Males: 9,096 Females: 9,639
March 2022 cost of living index in Homewood: 99.9 (near average, U.S. average is 100) Percentage of residents living in poverty in 2022: 8.5%for White Non-Hispanic residents , 11.2% for Black residents , 5.4% for Hispanic or Latino residents , 2.3% for other race residents , 0.7% for two or more races residents )
Profiles of local businesses
Business Search - 14 Million verified businesses
Data:
Median household income ($)
Median household income (% change since 2000)
Household income diversity
Ratio of average income to average house value (%)
Ratio of average income to average rent
Median household income ($) - White
Median household income ($) - Black or African American
Median household income ($) - Asian
Median household income ($) - Hispanic or Latino
Median household income ($) - American Indian and Alaska Native
Median household income ($) - Multirace
Median household income ($) - Other Race
Median household income for houses/condos with a mortgage ($)
Median household income for apartments without a mortgage ($)
Races - White alone (%)
Races - White alone (% change since 2000)
Races - Black alone (%)
Races - Black alone (% change since 2000)
Races - American Indian alone (%)
Races - American Indian alone (% change since 2000)
Races - Asian alone (%)
Races - Asian alone (% change since 2000)
Races - Hispanic (%)
Races - Hispanic (% change since 2000)
Races - Native Hawaiian and Other Pacific Islander alone (%)
Races - Native Hawaiian and Other Pacific Islander alone (% change since 2000)
Races - Two or more races (%)
Races - Two or more races (% change since 2000)
Races - Other race alone (%)
Races - Other race alone (% change since 2000)
Racial diversity
Unemployment (%)
Unemployment (% change since 2000)
Unemployment (%) - White
Unemployment (%) - Black or African American
Unemployment (%) - Asian
Unemployment (%) - Hispanic or Latino
Unemployment (%) - American Indian and Alaska Native
Unemployment (%) - Multirace
Unemployment (%) - Other Race
Population density (people per square mile)
Population - Males (%)
Population - Females (%)
Population - Males (%) - White
Population - Males (%) - Black or African American
Population - Males (%) - Asian
Population - Males (%) - Hispanic or Latino
Population - Males (%) - American Indian and Alaska Native
Population - Males (%) - Multirace
Population - Males (%) - Other Race
Population - Females (%) - White
Population - Females (%) - Black or African American
Population - Females (%) - Asian
Population - Females (%) - Hispanic or Latino
Population - Females (%) - American Indian and Alaska Native
Population - Females (%) - Multirace
Population - Females (%) - Other Race
Coronavirus confirmed cases (May 19, 2024)
Deaths caused by coronavirus (May 19, 2024)
Coronavirus confirmed cases (per 100k population) (May 19, 2024)
Deaths caused by coronavirus (per 100k population) (May 19, 2024)
Daily increase in number of cases (May 19, 2024)
Weekly increase in number of cases (May 19, 2024)
Cases doubled (in days) (May 19, 2024)
Hospitalized patients (Apr 18, 2022)
Negative test results (Apr 18, 2022)
Total test results (Apr 18, 2022)
COVID Vaccine doses distributed (per 100k population) (Sep 19, 2023)
COVID Vaccine doses administered (per 100k population) (Sep 19, 2023)
COVID Vaccine doses distributed (Sep 19, 2023)
COVID Vaccine doses administered (Sep 19, 2023)
Likely homosexual households (%)
Likely homosexual households (% change since 2000)
Likely homosexual households - Lesbian couples (%)
Likely homosexual households - Lesbian couples (% change since 2000)
Likely homosexual households - Gay men (%)
Likely homosexual households - Gay men (% change since 2000)
Cost of living index
Median gross rent ($)
Median contract rent ($)
Median monthly housing costs ($)
Median house or condo value ($)
Median house or condo value ($ change since 2000)
Mean house or condo value by units in structure - 1, detached ($)
Mean house or condo value by units in structure - 1, attached ($)
Mean house or condo value by units in structure - 2 ($)
Mean house or condo value by units in structure by units in structure - 3 or 4 ($)
Mean house or condo value by units in structure - 5 or more ($)
Mean house or condo value by units in structure - Boat, RV, van, etc. ($)
Mean house or condo value by units in structure - Mobile home ($)
Median house or condo value ($) - White
Median house or condo value ($) - Black or African American
Median house or condo value ($) - Asian
Median house or condo value ($) - Hispanic or Latino
Median house or condo value ($) - American Indian and Alaska Native
Median house or condo value ($) - Multirace
Median house or condo value ($) - Other Race
Median resident age
Resident age diversity
Median resident age - Males
Median resident age - Females
Median resident age - White
Median resident age - Black or African American
Median resident age - Asian
Median resident age - Hispanic or Latino
Median resident age - American Indian and Alaska Native
Median resident age - Multirace
Median resident age - Other Race
Median resident age - Males - White
Median resident age - Males - Black or African American
Median resident age - Males - Asian
Median resident age - Males - Hispanic or Latino
Median resident age - Males - American Indian and Alaska Native
Median resident age - Males - Multirace
Median resident age - Males - Other Race
Median resident age - Females - White
Median resident age - Females - Black or African American
Median resident age - Females - Asian
Median resident age - Females - Hispanic or Latino
Median resident age - Females - American Indian and Alaska Native
Median resident age - Females - Multirace
Median resident age - Females - Other Race
Commute - mean travel time to work (minutes)
Travel time to work - Less than 5 minutes (%)
Travel time to work - Less than 5 minutes (% change since 2000)
Travel time to work - 5 to 9 minutes (%)
Travel time to work - 5 to 9 minutes (% change since 2000)
Travel time to work - 10 to 19 minutes (%)
Travel time to work - 10 to 19 minutes (% change since 2000)
Travel time to work - 20 to 29 minutes (%)
Travel time to work - 20 to 29 minutes (% change since 2000)
Travel time to work - 30 to 39 minutes (%)
Travel time to work - 30 to 39 minutes (% change since 2000)
Travel time to work - 40 to 59 minutes (%)
Travel time to work - 40 to 59 minutes (% change since 2000)
Travel time to work - 60 to 89 minutes (%)
Travel time to work - 60 to 89 minutes (% change since 2000)
Travel time to work - 90 or more minutes (%)
Travel time to work - 90 or more minutes (% change since 2000)
Marital status - Never married (%)
Marital status - Now married (%)
Marital status - Separated (%)
Marital status - Widowed (%)
Marital status - Divorced (%)
Median family income ($)
Median family income (% change since 2000)
Median non-family income ($)
Median non-family income (% change since 2000)
Median per capita income ($)
Median per capita income (% change since 2000)
Median family income ($) - White
Median family income ($) - Black or African American
Median family income ($) - Asian
Median family income ($) - Hispanic or Latino
Median family income ($) - American Indian and Alaska Native
Median family income ($) - Multirace
Median family income ($) - Other Race
Median year house/condo built
Median year apartment built
Year house built - Built 2005 or later (%)
Year house built - Built 2000 to 2004 (%)
Year house built - Built 1990 to 1999 (%)
Year house built - Built 1980 to 1989 (%)
Year house built - Built 1970 to 1979 (%)
Year house built - Built 1960 to 1969 (%)
Year house built - Built 1950 to 1959 (%)
Year house built - Built 1940 to 1949 (%)
Year house built - Built 1939 or earlier (%)
Average household size
Household density (households per square mile)
Average household size - White
Average household size - Black or African American
Average household size - Asian
Average household size - Hispanic or Latino
Average household size - American Indian and Alaska Native
Average household size - Multirace
Average household size - Other Race
Occupied housing units (%)
Vacant housing units (%)
Owner occupied housing units (%)
Renter occupied housing units (%)
Vacancy status - For rent (%)
Vacancy status - For sale only (%)
Vacancy status - Rented or sold, not occupied (%)
Vacancy status - For seasonal, recreational, or occasional use (%)
Vacancy status - For migrant workers (%)
Vacancy status - Other vacant (%)
Residents with income below the poverty level (%)
Residents with income below 50% of the poverty level (%)
Children below poverty level (%)
Poor families by family type - Married-couple family (%)
Poor families by family type - Male, no wife present (%)
Poor families by family type - Female, no husband present (%)
Poverty status for native-born residents (%)
Poverty status for foreign-born residents (%)
Poverty among high school graduates not in families (%)
Poverty among people who did not graduate high school not in families (%)
Residents with income below the poverty level (%) - White
Residents with income below the poverty level (%) - Black or African American
Residents with income below the poverty level (%) - Asian
Residents with income below the poverty level (%) - Hispanic or Latino
Residents with income below the poverty level (%) - American Indian and Alaska Native
Residents with income below the poverty level (%) - Multirace
Residents with income below the poverty level (%) - Other Race
Air pollution - Air Quality Index (AQI)
Air pollution - CO
Air pollution - NO2
Air pollution - SO2
Air pollution - Ozone
Air pollution - PM10
Air pollution - PM25
Air pollution - Pb
Crime - Murders per 100,000 population
Crime - Rapes per 100,000 population
Crime - Robberies per 100,000 population
Crime - Assaults per 100,000 population
Crime - Burglaries per 100,000 population
Crime - Thefts per 100,000 population
Crime - Auto thefts per 100,000 population
Crime - Arson per 100,000 population
Crime - City-data.com crime index
Crime - Violent crime index
Crime - Property crime index
Crime - Murders per 100,000 population (5 year average)
Crime - Rapes per 100,000 population (5 year average)
Crime - Robberies per 100,000 population (5 year average)
Crime - Assaults per 100,000 population (5 year average)
Crime - Burglaries per 100,000 population (5 year average)
Crime - Thefts per 100,000 population (5 year average)
Crime - Auto thefts per 100,000 population (5 year average)
Crime - Arson per 100,000 population (5 year average)
Crime - City-data.com crime index (5 year average)
Crime - Violent crime index (5 year average)
Crime - Property crime index (5 year average)
1996 Presidential Elections Results (%) - Democratic Party (Clinton)
1996 Presidential Elections Results (%) - Republican Party (Dole)
1996 Presidential Elections Results (%) - Other
2000 Presidential Elections Results (%) - Democratic Party (Gore)
2000 Presidential Elections Results (%) - Republican Party (Bush)
2000 Presidential Elections Results (%) - Other
2004 Presidential Elections Results (%) - Democratic Party (Kerry)
2004 Presidential Elections Results (%) - Republican Party (Bush)
2004 Presidential Elections Results (%) - Other
2008 Presidential Elections Results (%) - Democratic Party (Obama)
2008 Presidential Elections Results (%) - Republican Party (McCain)
2008 Presidential Elections Results (%) - Other
2012 Presidential Elections Results (%) - Democratic Party (Obama)
2012 Presidential Elections Results (%) - Republican Party (Romney)
2012 Presidential Elections Results (%) - Other
2016 Presidential Elections Results (%) - Democratic Party (Clinton)
2016 Presidential Elections Results (%) - Republican Party (Trump)
2016 Presidential Elections Results (%) - Other
2020 Presidential Elections Results (%) - Democratic Party (Biden)
2020 Presidential Elections Results (%) - Republican Party (Trump)
2020 Presidential Elections Results (%) - Other
Ancestries Reported - Arab (%)
Ancestries Reported - Czech (%)
Ancestries Reported - Danish (%)
Ancestries Reported - Dutch (%)
Ancestries Reported - English (%)
Ancestries Reported - French (%)
Ancestries Reported - French Canadian (%)
Ancestries Reported - German (%)
Ancestries Reported - Greek (%)
Ancestries Reported - Hungarian (%)
Ancestries Reported - Irish (%)
Ancestries Reported - Italian (%)
Ancestries Reported - Lithuanian (%)
Ancestries Reported - Norwegian (%)
Ancestries Reported - Polish (%)
Ancestries Reported - Portuguese (%)
Ancestries Reported - Russian (%)
Ancestries Reported - Scotch-Irish (%)
Ancestries Reported - Scottish (%)
Ancestries Reported - Slovak (%)
Ancestries Reported - Subsaharan African (%)
Ancestries Reported - Swedish (%)
Ancestries Reported - Swiss (%)
Ancestries Reported - Ukrainian (%)
Ancestries Reported - United States (%)
Ancestries Reported - Welsh (%)
Ancestries Reported - West Indian (%)
Ancestries Reported - Other (%)
Educational Attainment - No schooling completed (%)
Educational Attainment - Less than high school (%)
Educational Attainment - High school or equivalent (%)
Educational Attainment - Less than 1 year of college (%)
Educational Attainment - 1 or more years of college (%)
Educational Attainment - Associate degree (%)
Educational Attainment - Bachelor's degree (%)
Educational Attainment - Master's degree (%)
Educational Attainment - Professional school degree (%)
Educational Attainment - Doctorate degree (%)
School Enrollment - Nursery, preschool (%)
School Enrollment - Kindergarten (%)
School Enrollment - Grade 1 to 4 (%)
School Enrollment - Grade 5 to 8 (%)
School Enrollment - Grade 9 to 12 (%)
School Enrollment - College undergrad (%)
School Enrollment - Graduate or professional (%)
School Enrollment - Not enrolled in school (%)
School enrollment - Public schools (%)
School enrollment - Private schools (%)
School enrollment - Not enrolled (%)
Median number of rooms in houses and condos
Median number of rooms in apartments
Housing units lacking complete plumbing facilities (%)
Housing units lacking complete kitchen facilities (%)
Density of houses
Urban houses (%)
Rural houses (%)
Households with people 60 years and over (%)
Households with people 65 years and over (%)
Households with people 75 years and over (%)
Households with one or more nonrelatives (%)
Households with no nonrelatives (%)
Population in households (%)
Family households (%)
Nonfamily households (%)
Population in families (%)
Family households with own children (%)
Median number of bedrooms in owner occupied houses
Mean number of bedrooms in owner occupied houses
Median number of bedrooms in renter occupied houses
Mean number of bedrooms in renter occupied houses
Median number of vehichles in owner occupied houses
Mean number of vehichles in owner occupied houses
Median number of vehichles in renter occupied houses
Mean number of vehichles in renter occupied houses
Mortgage status - with mortgage (%)
Mortgage status - with second mortgage (%)
Mortgage status - with home equity loan (%)
Mortgage status - with both second mortgage and home equity loan (%)
Mortgage status - without a mortgage (%)
Average family size
Average family size - White
Average family size - Black or African American
Average family size - Asian
Average family size - Hispanic or Latino
Average family size - American Indian and Alaska Native
Average family size - Multirace
Average family size - Other Race
Geographical mobility - Same house 1 year ago (%)
Geographical mobility - Moved within same county (%)
Geographical mobility - Moved from different county within same state (%)
Geographical mobility - Moved from different state (%)
Geographical mobility - Moved from abroad (%)
Place of birth - Born in state of residence (%)
Place of birth - Born in other state (%)
Place of birth - Native, outside of US (%)
Place of birth - Foreign born (%)
Housing units in structures - 1, detached (%)
Housing units in structures - 1, attached (%)
Housing units in structures - 2 (%)
Housing units in structures - 3 or 4 (%)
Housing units in structures - 5 to 9 (%)
Housing units in structures - 10 to 19 (%)
Housing units in structures - 20 to 49 (%)
Housing units in structures - 50 or more (%)
Housing units in structures - Mobile home (%)
Housing units in structures - Boat, RV, van, etc. (%)
House/condo owner moved in on average (years ago)
Renter moved in on average (years ago)
Year householder moved into unit - Moved in 1999 to March 2000 (%)
Year householder moved into unit - Moved in 1995 to 1998 (%)
Year householder moved into unit - Moved in 1990 to 1994 (%)
Year householder moved into unit - Moved in 1980 to 1989 (%)
Year householder moved into unit - Moved in 1970 to 1979 (%)
Year householder moved into unit - Moved in 1969 or earlier (%)
Means of transportation to work - Drove car alone (%)
Means of transportation to work - Carpooled (%)
Means of transportation to work - Public transportation (%)
Means of transportation to work - Bus or trolley bus (%)
Means of transportation to work - Streetcar or trolley car (%)
Means of transportation to work - Subway or elevated (%)
Means of transportation to work - Railroad (%)
Means of transportation to work - Ferryboat (%)
Means of transportation to work - Taxicab (%)
Means of transportation to work - Motorcycle (%)
Means of transportation to work - Bicycle (%)
Means of transportation to work - Walked (%)
Means of transportation to work - Other means (%)
Working at home (%)
Industry diversity
Most Common Industries - Agriculture, forestry, fishing and hunting, and mining (%)
Most Common Industries - Agriculture, forestry, fishing and hunting (%)
Most Common Industries - Mining, quarrying, and oil and gas extraction (%)
Most Common Industries - Construction (%)
Most Common Industries - Manufacturing (%)
Most Common Industries - Wholesale trade (%)
Most Common Industries - Retail trade (%)
Most Common Industries - Transportation and warehousing, and utilities (%)
Most Common Industries - Transportation and warehousing (%)
Most Common Industries - Utilities (%)
Most Common Industries - Information (%)
Most Common Industries - Finance and insurance, and real estate and rental and leasing (%)
Most Common Industries - Finance and insurance (%)
Most Common Industries - Real estate and rental and leasing (%)
Most Common Industries - Professional, scientific, and management, and administrative and waste management services (%)
Most Common Industries - Professional, scientific, and technical services (%)
Most Common Industries - Management of companies and enterprises (%)
Most Common Industries - Administrative and support and waste management services (%)
Most Common Industries - Educational services, and health care and social assistance (%)
Most Common Industries - Educational services (%)
Most Common Industries - Health care and social assistance (%)
Most Common Industries - Arts, entertainment, and recreation, and accommodation and food services (%)
Most Common Industries - Arts, entertainment, and recreation (%)
Most Common Industries - Accommodation and food services (%)
Most Common Industries - Other services, except public administration (%)
Most Common Industries - Public administration (%)
Occupation diversity
Most Common Occupations - Management, business, science, and arts occupations (%)
Most Common Occupations - Management, business, and financial occupations (%)
Most Common Occupations - Management occupations (%)
Most Common Occupations - Business and financial operations occupations (%)
Most Common Occupations - Computer, engineering, and science occupations (%)
Most Common Occupations - Computer and mathematical occupations (%)
Most Common Occupations - Architecture and engineering occupations (%)
Most Common Occupations - Life, physical, and social science occupations (%)
Most Common Occupations - Education, legal, community service, arts, and media occupations (%)
Most Common Occupations - Community and social service occupations (%)
Most Common Occupations - Legal occupations (%)
Most Common Occupations - Education, training, and library occupations (%)
Most Common Occupations - Arts, design, entertainment, sports, and media occupations (%)
Most Common Occupations - Healthcare practitioners and technical occupations (%)
Most Common Occupations - Health diagnosing and treating practitioners and other technical occupations (%)
Most Common Occupations - Health technologists and technicians (%)
Most Common Occupations - Service occupations (%)
Most Common Occupations - Healthcare support occupations (%)
Most Common Occupations - Protective service occupations (%)
Most Common Occupations - Fire fighting and prevention, and other protective service workers including supervisors (%)
Most Common Occupations - Law enforcement workers including supervisors (%)
Most Common Occupations - Food preparation and serving related occupations (%)
Most Common Occupations - Building and grounds cleaning and maintenance occupations (%)
Most Common Occupations - Personal care and service occupations (%)
Most Common Occupations - Sales and office occupations (%)
Most Common Occupations - Sales and related occupations (%)
Most Common Occupations - Office and administrative support occupations (%)
Most Common Occupations - Natural resources, construction, and maintenance occupations (%)
Most Common Occupations - Farming, fishing, and forestry occupations (%)
Most Common Occupations - Construction and extraction occupations (%)
Most Common Occupations - Installation, maintenance, and repair occupations (%)
Most Common Occupations - Production, transportation, and material moving occupations (%)
Most Common Occupations - Production occupations (%)
Most Common Occupations - Transportation occupations (%)
Most Common Occupations - Material moving occupations (%)
People in Group quarters - Institutionalized population (%)
People in Group quarters - Correctional institutions (%)
People in Group quarters - Federal prisons and detention centers (%)
People in Group quarters - Halfway houses (%)
People in Group quarters - Local jails and other confinement facilities (including police lockups) (%)
People in Group quarters - Military disciplinary barracks (%)
People in Group quarters - State prisons (%)
People in Group quarters - Other types of correctional institutions (%)
People in Group quarters - Nursing homes (%)
People in Group quarters - Hospitals/wards, hospices, and schools for the handicapped (%)
People in Group quarters - Hospitals/wards and hospices for chronically ill (%)
People in Group quarters - Hospices or homes for chronically ill (%)
People in Group quarters - Military hospitals or wards for chronically ill (%)
People in Group quarters - Other hospitals or wards for chronically ill (%)
People in Group quarters - Hospitals or wards for drug/alcohol abuse (%)
People in Group quarters - Mental (Psychiatric) hospitals or wards (%)
People in Group quarters - Schools, hospitals, or wards for the mentally retarded (%)
People in Group quarters - Schools, hospitals, or wards for the physically handicapped (%)
People in Group quarters - Institutions for the deaf (%)
People in Group quarters - Institutions for the blind (%)
People in Group quarters - Orthopedic wards and institutions for the physically handicapped (%)
People in Group quarters - Wards in general hospitals for patients who have no usual home elsewhere (%)
People in Group quarters - Wards in military hospitals for patients who have no usual home elsewhere (%)
People in Group quarters - Juvenile institutions (%)
People in Group quarters - Long-term care (%)
People in Group quarters - Homes for abused, dependent, and neglected children (%)
People in Group quarters - Residential treatment centers for emotionally disturbed children (%)
People in Group quarters - Training schools for juvenile delinquents (%)
People in Group quarters - Short-term care, detention or diagnostic centers for delinquent children (%)
People in Group quarters - Type of juvenile institution unknown (%)
People in Group quarters - Noninstitutionalized population (%)
People in Group quarters - College dormitories (includes college quarters off campus) (%)
People in Group quarters - Military quarters (%)
People in Group quarters - On base (%)
People in Group quarters - Barracks, unaccompanied personnel housing (UPH), (Enlisted/Officer), ;and similar group living quarters for military personnel (%)
People in Group quarters - Transient quarters for temporary residents (%)
People in Group quarters - Military ships (%)
People in Group quarters - Group homes (%)
People in Group quarters - Homes or halfway houses for drug/alcohol abuse (%)
People in Group quarters - Homes for the mentally ill (%)
People in Group quarters - Homes for the mentally retarded (%)
People in Group quarters - Homes for the physically handicapped (%)
People in Group quarters - Other group homes (%)
People in Group quarters - Religious group quarters (%)
People in Group quarters - Dormitories (%)
People in Group quarters - Agriculture workers' dormitories on farms (%)
People in Group quarters - Job Corps and vocational training facilities (%)
People in Group quarters - Other workers' dormitories (%)
People in Group quarters - Crews of maritime vessels (%)
People in Group quarters - Other nonhousehold living situations (%)
People in Group quarters - Other noninstitutional group quarters (%)
Residents speaking English at home (%)
Residents speaking English at home - Born in the United States (%)
Residents speaking English at home - Native, born elsewhere (%)
Residents speaking English at home - Foreign born (%)
Residents speaking Spanish at home (%)
Residents speaking Spanish at home - Born in the United States (%)
Residents speaking Spanish at home - Native, born elsewhere (%)
Residents speaking Spanish at home - Foreign born (%)
Residents speaking other language at home (%)
Residents speaking other language at home - Born in the United States (%)
Residents speaking other language at home - Native, born elsewhere (%)
Residents speaking other language at home - Foreign born (%)
Class of Workers - Employee of private company (%)
Class of Workers - Self-employed in own incorporated business (%)
Class of Workers - Private not-for-profit wage and salary workers (%)
Class of Workers - Local government workers (%)
Class of Workers - State government workers (%)
Class of Workers - Federal government workers (%)
Class of Workers - Self-employed workers in own not incorporated business and Unpaid family workers (%)
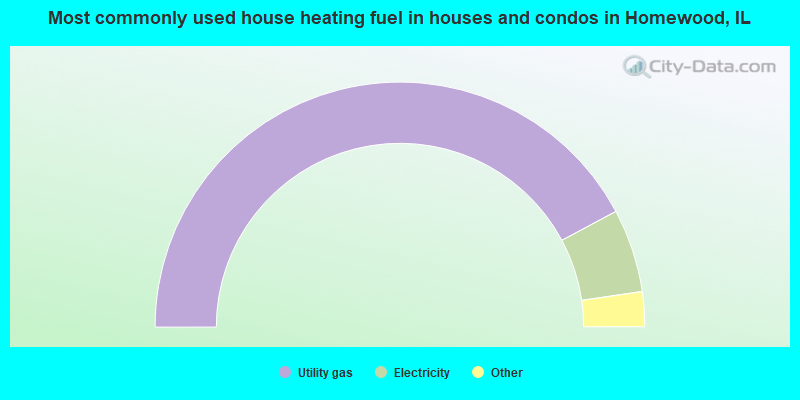
House heating fuel used in houses and condos - Utility gas (%)
House heating fuel used in houses and condos - Bottled, tank, or LP gas (%)
House heating fuel used in houses and condos - Electricity (%)
House heating fuel used in houses and condos - Fuel oil, kerosene, etc. (%)
House heating fuel used in houses and condos - Coal or coke (%)
House heating fuel used in houses and condos - Wood (%)
House heating fuel used in houses and condos - Solar energy (%)
House heating fuel used in houses and condos - Other fuel (%)
House heating fuel used in houses and condos - No fuel used (%)
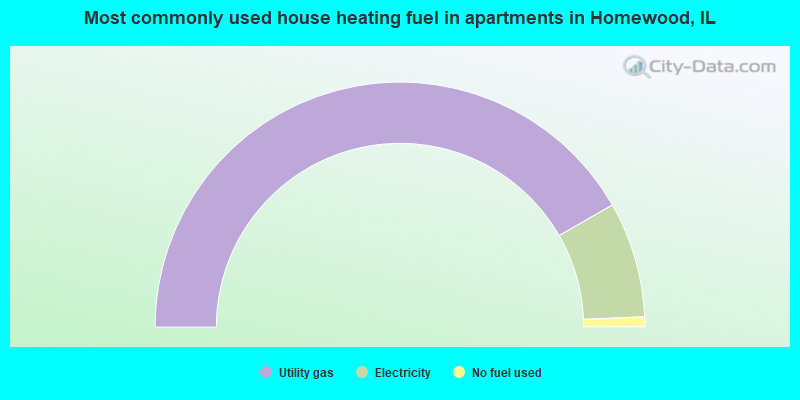
House heating fuel used in apartments - Utility gas (%)
House heating fuel used in apartments - Bottled, tank, or LP gas (%)
House heating fuel used in apartments - Electricity (%)
House heating fuel used in apartments - Fuel oil, kerosene, etc. (%)
House heating fuel used in apartments - Coal or coke (%)
House heating fuel used in apartments - Wood (%)
House heating fuel used in apartments - Solar energy (%)
House heating fuel used in apartments - Other fuel (%)
House heating fuel used in apartments - No fuel used (%)
Armed forces status - In Armed Forces (%)
Armed forces status - Civilian (%)
Armed forces status - Civilian - Veteran (%)
Armed forces status - Civilian - Nonveteran (%)
Fatal accidents locations in years 2005-2021
Fatal accidents locations in 2005
Fatal accidents locations in 2006
Fatal accidents locations in 2007
Fatal accidents locations in 2008
Fatal accidents locations in 2009
Fatal accidents locations in 2010
Fatal accidents locations in 2011
Fatal accidents locations in 2012
Fatal accidents locations in 2013
Fatal accidents locations in 2014
Fatal accidents locations in 2015
Fatal accidents locations in 2016
Fatal accidents locations in 2017
Fatal accidents locations in 2018
Fatal accidents locations in 2019
Fatal accidents locations in 2020
Fatal accidents locations in 2021
Alcohol use - People drinking some alcohol every month (%)
Alcohol use - People not drinking at all (%)
Alcohol use - Average days/month drinking alcohol
Alcohol use - Average drinks/week
Alcohol use - Average days/year people drink much
Audiometry - Average condition of hearing (%)
Audiometry - People that can hear a whisper from across a quiet room (%)
Audiometry - People that can hear normal voice from across a quiet room (%)
Audiometry - Ears ringing, roaring, buzzing (%)
Audiometry - Had a job exposure to loud noise (%)
Audiometry - Had off-work exposure to loud noise (%)
Blood Pressure & Cholesterol - Has high blood pressure (%)
Blood Pressure & Cholesterol - Checking blood pressure at home (%)
Blood Pressure & Cholesterol - Frequently checking blood cholesterol (%)
Blood Pressure & Cholesterol - Has high cholesterol level (%)
Consumer Behavior - Money monthly spent on food at supermarket/grocery store
Consumer Behavior - Money monthly spent on food at other stores
Consumer Behavior - Money monthly spent on eating out
Consumer Behavior - Money monthly spent on carryout/delivered foods
Consumer Behavior - Income spent on food at supermarket/grocery store (%)
Consumer Behavior - Income spent on food at other stores (%)
Consumer Behavior - Income spent on eating out (%)
Consumer Behavior - Income spent on carryout/delivered foods (%)
Current Health Status - General health condition (%)
Current Health Status - Blood donors (%)
Current Health Status - Has blood ever tested for HIV virus (%)
Current Health Status - Left-handed people (%)
Dermatology - People using sunscreen (%)
Diabetes - Diabetics (%)
Diabetes - Had a blood test for high blood sugar (%)
Diabetes - People taking insulin (%)
Diet Behavior & Nutrition - Diet health (%)
Diet Behavior & Nutrition - Milk product consumption (# of products/month)
Diet Behavior & Nutrition - Meals not home prepared (#/week)
Diet Behavior & Nutrition - Meals from fast food or pizza place (#/week)
Diet Behavior & Nutrition - Ready-to-eat foods (#/month)
Diet Behavior & Nutrition - Frozen meals/pizza (#/month)
Drug Use - People that ever used marijuana or hashish (%)
Drug Use - Ever used hard drugs (%)
Drug Use - Ever used any form of cocaine (%)
Drug Use - Ever used heroin (%)
Drug Use - Ever used methamphetamine (%)
Health Insurance - People covered by health insurance (%)
Kidney Conditions-Urology - Avg. # of times urinating at night
Medical Conditions - People with asthma (%)
Medical Conditions - People with anemia (%)
Medical Conditions - People with psoriasis (%)
Medical Conditions - People with overweight (%)
Medical Conditions - Elderly people having difficulties in thinking or remembering (%)
Medical Conditions - People who ever received blood transfusion (%)
Medical Conditions - People having trouble seeing even with glass/contacts (%)
Medical Conditions - People with arthritis (%)
Medical Conditions - People with gout (%)
Medical Conditions - People with congestive heart failure (%)
Medical Conditions - People with coronary heart disease (%)
Medical Conditions - People with angina pectoris (%)
Medical Conditions - People who ever had heart attack (%)
Medical Conditions - People who ever had stroke (%)
Medical Conditions - People with emphysema (%)
Medical Conditions - People with thyroid problem (%)
Medical Conditions - People with chronic bronchitis (%)
Medical Conditions - People with any liver condition (%)
Medical Conditions - People who ever had cancer or malignancy (%)
Mental Health - People who have little interest in doing things (%)
Mental Health - People feeling down, depressed, or hopeless (%)
Mental Health - People who have trouble sleeping or sleeping too much (%)
Mental Health - People feeling tired or having little energy (%)
Mental Health - People with poor appetite or overeating (%)
Mental Health - People feeling bad about themself (%)
Mental Health - People who have trouble concentrating on things (%)
Mental Health - People moving or speaking slowly or too fast (%)
Mental Health - People having thoughts they would be better off dead (%)
Oral Health - Average years since last visit a dentist
Oral Health - People embarrassed because of mouth (%)
Oral Health - People with gum disease (%)
Oral Health - General health of teeth and gums (%)
Oral Health - Average days a week using dental floss/device
Oral Health - Average days a week using mouthwash for dental problem
Oral Health - Average number of teeth
Pesticide Use - Households using pesticides to control insects (%)
Pesticide Use - Households using pesticides to kill weeds (%)
Physical Activity - People doing vigorous-intensity work activities (%)
Physical Activity - People doing moderate-intensity work activities (%)
Physical Activity - People walking or bicycling (%)
Physical Activity - People doing vigorous-intensity recreational activities (%)
Physical Activity - People doing moderate-intensity recreational activities (%)
Physical Activity - Average hours a day doing sedentary activities
Physical Activity - Average hours a day watching TV or videos
Physical Activity - Average hours a day using computer
Physical Functioning - People having limitations keeping them from working (%)
Physical Functioning - People limited in amount of work they can do (%)
Physical Functioning - People that need special equipment to walk (%)
Physical Functioning - People experiencing confusion/memory problems (%)
Physical Functioning - People requiring special healthcare equipment (%)
Prescription Medications - Average number of prescription medicines taking
Preventive Aspirin Use - Adults 40+ taking low-dose aspirin (%)
Reproductive Health - Vaginal deliveries (%)
Reproductive Health - Cesarean deliveries (%)
Reproductive Health - Deliveries resulted in a live birth (%)
Reproductive Health - Pregnancies resulted in a delivery (%)
Reproductive Health - Women breastfeeding newborns (%)
Reproductive Health - Women that had a hysterectomy (%)
Reproductive Health - Women that had both ovaries removed (%)
Reproductive Health - Women that have ever taken birth control pills (%)
Reproductive Health - Women taking birth control pills (%)
Reproductive Health - Women that have ever used Depo-Provera or injectables (%)
Reproductive Health - Women that have ever used female hormones (%)
Sexual Behavior - People 18+ that ever had sex (vaginal, anal, or oral) (%)
Sexual Behavior - Males 18+ that ever had vaginal sex with a woman (%)
Sexual Behavior - Males 18+ that ever performed oral sex on a woman (%)
Sexual Behavior - Males 18+ that ever had anal sex with a woman (%)
Sexual Behavior - Males 18+ that ever had any sex with a man (%)
Sexual Behavior - Females 18+ that ever had vaginal sex with a man (%)
Sexual Behavior - Females 18+ that ever performed oral sex on a man (%)
Sexual Behavior - Females 18+ that ever had anal sex with a man (%)
Sexual Behavior - Females 18+ that ever had any kind of sex with a woman (%)
Sexual Behavior - Average age people first had sex
Sexual Behavior - Average number of female sex partners in lifetime (males 18+)
Sexual Behavior - Average number of female vaginal sex partners in lifetime (males 18+)
Sexual Behavior - Average age people first performed oral sex on a woman (18+)
Sexual Behavior - Average number of woman performed oral sex on in lifetime (18+)
Sexual Behavior - Average number of male sex partners in lifetime (males 18+)
Sexual Behavior - Average number of male anal sex partners in lifetime (males 18+)
Sexual Behavior - Average age people first performed oral sex on a man (18+)
Sexual Behavior - Average number of male oral sex partners in lifetime (18+)
Sexual Behavior - People using protection when performing oral sex (%)
Sexual Behavior - Average number of times people have vaginal or anal sex a year
Sexual Behavior - People having sex without condom (%)
Sexual Behavior - Average number of male sex partners in lifetime (females 18+)
Sexual Behavior - Average number of male vaginal sex partners in lifetime (females 18+)
Sexual Behavior - Average number of female sex partners in lifetime (females 18+)
Sexual Behavior - Circumcised males 18+ (%)
Sleep Disorders - Average hours sleeping at night
Sleep Disorders - People that has trouble sleeping (%)
Smoking-Cigarette Use - People smoking cigarettes (%)
Taste & Smell - People 40+ having problems with smell (%)
Taste & Smell - People 40+ having problems with taste (%)
Taste & Smell - People 40+ that ever had wisdom teeth removed (%)
Taste & Smell - People 40+ that ever had tonsils teeth removed (%)
Taste & Smell - People 40+ that ever had a loss of consciousness because of a head injury (%)
Taste & Smell - People 40+ that ever had a broken nose or other serious injury to face or skull (%)
Taste & Smell - People 40+ that ever had two or more sinus infections (%)
Weight - Average height (inches)
Weight - Average weight (pounds)
Weight - Average BMI
Weight - People that are obese (%)
Weight - People that ever were obese (%)
Weight - People trying to lose weight (%)
According to our research of Illinois and other state lists, there were 11 registered sex offenders living in Homewood, Illinois as of May 19, 2024 . The ratio of all residents to sex offenders in Homewood is 1,745 to 1.The ratio of registered sex offenders to all residents in this city is lower than the state average.
Officers per 1,000 residents here:
2.23Illinois average:
2.84
Latest news from Homewood, IL collected exclusively by city-data.com from local newspapers, TV, and radio stations
Ancestries: Irish (5.0%), German (4.4%), Polish (2.7%), European (1.8%), Italian (1.6%), American (1.5%).
Current Local Time:
Incorporated on 03/30/1893
Land area: 5.20 square miles.
Population density: 3,600 people per square mile (average).
790 residents are foreign born (1.5% Latin America , 0.9% Europe , 0.8% Asia , 0.5% Africa ).
This village:
4.1%Illinois:
14.1%
Median real estate property taxes paid for housing units with mortgages in 2022: $5,923 (2.8%)Median real estate property taxes paid for housing units with no mortgage in 2022: $5,224 (3.0%)
Nearest city with pop. 50,000+: Hammond, IN
Nearest city with pop. 200,000+: Chicago, IL
Nearest cities:
Latitude: 41.56 N, Longitude: 87.66 W
Daytime population change due to commuting: +556 (+2.9%)Workers who live and work in this village: 2,101 (24.0%)
Single-family new house construction building permits:
2022: 1 building , cost: $225,0002021: 2 buildings , average cost: $185,5002020: 1 building , cost: $175,0002017: 2 buildings , average cost: $110,0002016: 2 buildings , average cost: $136,5002015: 3 buildings , average cost: $103,3002013: 1 building , cost: $322,0002012: 1 building , cost: $281,0002011: 2 buildings , average cost: $216,5002007: 5 buildings , average cost: $300,0002006: 22 buildings , average cost: $227,8002005: 13 buildings , average cost: $249,7002004: 10 buildings , average cost: $231,5002003: 11 buildings , average cost: $237,9002002: 13 buildings , average cost: $208,7002001: 36 buildings , average cost: $134,2002000: 29 buildings , average cost: $116,8001999: 8 buildings , average cost: $239,1001998: 5 buildings , average cost: $169,8001997: 4 buildings , average cost: $195,000Unemployment in December 2023:
Population change in the 1990s: +493 (+2.6%).
Most common occupations in Homewood, IL (%)
Both Males Females
Preschool, kindergarten, elementary, and middle school teachers (6.6%)
Other management occupations, except farmers and farm managers (5.9%)
Sales representatives, services, wholesale and manufacturing (4.9%)
Other office and administrative support workers, including supervisors (4.6%)
Secretaries and administrative assistants (4.3%)
Other sales and related occupations, including supervisors (3.2%)
Registered nurses (2.6%)
Sales representatives, services, wholesale and manufacturing (7.4%)
Other management occupations, except farmers and farm managers (6.5%)
Other sales and related occupations, including supervisors (4.1%)
Top executives (4.0%)
Other production occupations, including supervisors (3.7%)
Preschool, kindergarten, elementary, and middle school teachers (3.4%)
Computer specialists (3.2%)
Preschool, kindergarten, elementary, and middle school teachers (9.7%)
Secretaries and administrative assistants (8.2%)
Other office and administrative support workers, including supervisors (6.4%)
Other management occupations, except farmers and farm managers (5.3%)
Registered nurses (4.6%)
Information and record clerks, except customer service representatives (4.0%)
Health technologists and technicians (3.3%)
Tornado activity:
Homewood-area historical tornado activity is near Illinois state average. It is 60% greater than the overall U.S. average.
On 8/28/1990, a category F5 (max. wind speeds 261-318 mph) tornado 22.8 miles away from the Homewood village center killed 29 people and injured 350 people and caused between $50,000 and $500,000 in damages.
On 4/21/1967, a category F4 (max. wind speeds 207-260 mph) tornado 11.6 miles away from the village center killed 33 people and injured 500 people and caused between $5,000,000 and $50,000,000 in damages.
Earthquake activity:
Homewood-area historical earthquake activity is significantly above Illinois state average. It is 45% greater than the overall U.S. average. On 4/18/2008 at 09:36:59, a magnitude 5.4 (5.1 MB, 4.8 MS, 5.4 MW, 5.2 MW, Class: Moderate, Intensity: VI - VII) earthquake occurred 215.2 miles away from the city center On 6/10/1987 at 23:48:54, a magnitude 5.1 (4.9 MB, 4.4 MS, 4.6 MS, 5.1 LG) earthquake occurred 189.7 miles away from Homewood center On 4/18/2008 at 09:36:59, a magnitude 5.2 (5.2 MW, Depth: 8.9 mi) earthquake occurred 215.2 miles away from the city center On 6/28/2004 at 06:10:52, a magnitude 4.2 (4.2 MW, Depth: 6.2 mi, Class: Light, Intensity: IV - V) earthquake occurred 64.4 miles away from the city center On 6/18/2002 at 17:37:15, a magnitude 5.0 (4.3 MB, 4.6 MW, 5.0 LG) earthquake occurred 247.1 miles away from the city center On 4/18/2008 at 15:14:16, a magnitude 4.8 (4.5 MB, 4.8 MW, 4.6 MW) earthquake occurred 213.4 miles away from Homewood center Magnitude types: regional Lg-wave magnitude (LG), body-wave magnitude (MB), surface-wave magnitude (MS), moment magnitude (MW) Natural disasters: The number of natural disasters in Cook County (20) is greater than the US average (15).Major Disasters (Presidential) Declared: 15Emergencies Declared: 4Floods: 13, Storms: 12, Tornadoes: 3, Snowstorms: 2, Winter Storms: 2, Blizzard: 1, Hurricane: 1, Snow: 1, Wind: 1, Other: 1 (Note: some incidents may be assigned to more than one category). Hospitals and medical centers in Homewood: AFFECTIONATE HOME HEALTH CARE, INC (17900 DIXIE HWY, STE 1)
HOPE HOME HEALTH, INC (18456 POPLAR AVENUE)
LIVING SPRING HOME HEALTH CARE, INC (18350 S KEDZIE AVE SUITE 204)
NETT HANDS HOME CARE, INC (18227 SOUTH HARWOOD AVE, 2ND FL, UNIT 1)
MANORCARE OF HOMEWOOD (940 MAPLE AVENUE)
SOUTH SUBURBAN REHAB CENTER (19000 HALSTED)
Amtrak station: HOMEWOOD (181 1ST ST. & PARK AVE.)
.
Services: ticket office, enclosed waiting area, public restrooms, public payphones, paid short-term parking, paid long-term parking, public transit connection.
Colleges/universities with over 2000 students nearest to Homewood:
Prairie State College (about 3 miles; Chicago Heights, IL ; Full-time enrollment: 4,050)
South Suburban College (about 5 miles; South Holland, IL ; FT enrollment: 3,972)
Governors State University (about 9 miles; University Park, IL ; FT enrollment: 4,043)
Purdue University-Calumet Campus (about 10 miles; Hammond, IN ; FT enrollment: 7,343)
Saint Xavier University (about 11 miles; Chicago, IL ; FT enrollment: 3,576)
City Colleges of Chicago-Olive-Harvey College (about 12 miles; Chicago, IL ; FT enrollment: 4,110)
Chicago State University (about 12 miles; Chicago, IL ; FT enrollment: 4,352)
Public elementary/middle schools in Homewood:
Private elementary/middle schools in Homewood: ST JOSEPH SCHOOL Students: 170, Location: 17949 DIXIE HWY, Grades: PK-8)HELLO MONTESSORI PRESCHOOL & KINDERGARTEN Students: 21, Location: 18850 RIEGEL RD, Grades: PK-T1)
See full list of schools located in Homewood Library in Homewood: HOMEWOOD PUBLIC LIBRARY DISTRICT Operating income: $2,439,508; Location: 17917 DIXIE HIGHWAY; 91,617 books ; 2,000 e-books ; 6,395 audio materials ; 7,382 video materials ; 20 local licensed databases ; 17 state licensed databases ; 277 print serial subscriptions ; 11 electronic serial subscriptions )
User-submitted facts and corrections:
A significant area of interest in Homewood is the Izaak Walton Preserve on Ridge Road. The preserve is open to the public and includes lakes, marked trails, and several acres of virgin Illinois prarie. The preserve is maintained entirely by volunteers and provides habitat for a wide variety of native plants and animals. added by I.D.M.
Notable locations in Homewood: (A) , Homewood-Flossmoor Tennis Club (B) , Calumet Country Club (C) , Ravisloe Country Club (D) , Homewood Fire Department (E) , Homewood Public Library (F) , Homewood Village Hall (G) , Marie Irwin Center (H) , E-COM Consolidated Dispatch Center (I) . Display/hide their locations on the map
Shopping Centers: (1) , Park Place Plaza Shopping Center (2) , Cherry Creek Shopping Center (3) . Display/hide their locations on the map
Churches in Homewood include: (A) , Homewood Reformed Church (B) , Saint Andrews Church (C) , Saint Joseph Roman Catholic Church (D) , Saint Paul Community Church (E) , Homewood Baptist Church (F) , Faith Lutheran Church (G) . Display/hide their locations on the map
Cemetery: (1) . Display/hide its location on the map
Parks in Homewood include: (1) , Lions Park (2) , Well Park (3) , Orchard Park (4) , Cedar Park (5) , Woodbrough Park (6) , Indian Trail Park (7) , Independence Park (8) , Hollydale Park (9) . Display/hide their locations on the map
Tourist attraction:
Hotels:
Birthplace of: TJ Cummings - Basketball player.
Cook County has a predicted average indoor radon screening level between 2 and 4 pCi/L (pico curies per liter) - Moderate Potential Average household size: This village:
2.5 peopleIllinois:
2.6 people
Percentage of family households: This village:
68.0%Whole state:
65.8%
Percentage of households with unmarried partners: This village:
4.2%Whole state:
6.3%
Likely homosexual households (counted as self-reported same-sex unmarried-partner households)
Lesbian couples: 0.3% of all households Gay men: 0.2% of all households
People in group quarters in Homewood in 2010:
219 people in nursing facilities/skilled-nursing facilities
34 people in emergency and transitional shelters (with sleeping facilities) for people experiencing homelessness
3 people in in-patient hospice facilities
2 people in other noninstitutional facilities
people in nursing homes in 2000Banks with most branches in Homewood (2011 data):
TCF National Bank: Homewood Jewel Branch #2307, Homewood Branch, Halsted/Homewood Jewel Branch #2330. Info updated 2009/11/23: Bank assets: $19,007.0 mil, Deposits: $12,377.0 mil, headquarters in Sioux Falls, SD, positive income , Commercial Lending Specialization, 441 total offices , Holding Company: Tcf Financial Corporation
Great Lakes Bank, National Association: Homewood Branch at 2034 Ridge Road, branch established on 1946/07/27; Homewood Branch at 18600 Dixie Highway, branch established on 1914/01/01. Info updated 2007/12/05: Bank assets: $627.2 mil, Deposits: $501.8 mil, headquarters in Blue Island, IL, positive income , Commercial Lending Specialization, 8 total offices , Holding Company: Great Lakes Financial Resources, Inc. Employee Stock Ownership Plan
South End Savings, s.b.: South End Savings, S.B. at 18200 S Halsted, branch established on 1914/01/01. Info updated 2006/11/03: Bank assets: $36.3 mil, Deposits: $30.7 mil, local headquarters , positive income , Mortgage Lending Specialization, 1 total offices
JPMorgan Chase Bank, National Association: Homewood Banking Center Branch at 18301 Dixie Highway, branch established on 2006/08/16. Info updated 2011/11/10: Bank assets: $1,811,678.0 mil, Deposits: $1,190,738.0 mil, headquarters in Columbus, OH, positive income , International Specialization, 5577 total offices , Holding Company: Jpmorgan Chase & Co.
RBS Citizens, National Association: Dixie Hwy/ Homewood Branch at 18300 Dixie Highway, branch established on 1920/01/01. Info updated 2007/09/19: Bank assets: $106,940.6 mil, Deposits: $75,690.2 mil, headquarters in Providence, RI, positive income , 1135 total offices , Holding Company: Uk Financial Investments Limited
MB Financial Bank, National Association: Homewood In Walt's Branch at 2345 West 183rd Street, branch established on 2008/02/15. Info updated 2010/04/27: Bank assets: $9,792.4 mil, Deposits: $7,757.4 mil, headquarters in Chicago, IL, positive income , Commercial Lending Specialization, 93 total offices , Holding Company: Mb Financial, Inc
Bank of America, National Association: Homewood at 18340 Governors Highway, branch established on 1997/11/22. Info updated 2009/11/18: Bank assets: $1,451,969.3 mil, Deposits: $1,077,176.8 mil, headquarters in Charlotte, NC, positive income , 5782 total offices , Holding Company: Bank Of America Corporation
BMO Harris Bank National Association: Harris N. A. Branch at 17600 Halsted, branch established on 2005/10/31. Info updated 2011/07/14: Bank assets: $97,264.0 mil, Deposits: $75,624.6 mil, headquarters in Chicago, IL, positive income , 717 total offices , Holding Company: Bank Of Montreal
U.S. Bank National Association: Homewood Branch at 18300 South Kedzie, branch established on 1914/01/01. Info updated 2012/01/30: Bank assets: $330,470.8 mil, Deposits: $236,091.5 mil, headquarters in Cincinnati, OH, positive income , 3121 total offices , Holding Company: U.S. Bancorp
For population 15 years and over in Homewood:
Never married: 35.9%Now married: 46.7%Separated: 3.0%Widowed: 6.2%Divorced: 8.2% For population 25 years and over in Homewood:
High school or higher: 95.7%Bachelor's degree or higher: 43.5%Graduate or professional degree: 16.5%Unemployed: 4.1%Mean travel time to work (commute): 27.0 minutes
Education Gini index (Inequality in education) Here:
9.6Illinois average:
12.5
Religion statistics for Homewood, IL (based on Cook County data)
Religion Adherents Congregations Catholic 1,947,223 376 Evangelical Protestant 432,975 1,484 Other 312,636 403 Mainline Protestant 202,114 630 Black Protestant 148,895 395 Orthodox 53,276 66 None 2,097,556 -
Source: Clifford Grammich, Kirk Hadaway, Richard Houseal, Dale E.Jones, Alexei Krindatch, Richie Stanley and Richard H.Taylor. 2012. 2010 U.S.Religion Census: Religious Congregations & Membership Study. Association of Statisticians of American Religious Bodies. Jones, Dale E., et al. 2002. Congregations and Membership in the United States 2000. Nashville, TN: Glenmary Research Center. Graphs represent county-level data
Food Environment Statistics: Number of grocery stores : 1,460This county :
2.77 / 10,000 pop.Illinois :
2.24 / 10,000 pop.
Number of supercenters and club stores : 23Here :
0.04 / 10,000 pop.Illinois :
0.08 / 10,000 pop.
Number of convenience stores (no gas) : 490This county :
0.93 / 10,000 pop.State :
0.75 / 10,000 pop.
Number of convenience stores (with gas) : 806Here :
1.53 / 10,000 pop.Illinois :
2.61 / 10,000 pop.
Number of full-service restaurants : 3,516Cook County :
6.67 / 10,000 pop.Illinois :
6.86 / 10,000 pop.
Adult diabetes rate : This county :
8.4%Illinois :
8.3%
Low-income preschool obesity rate : Health and Nutrition:
Average overall health of teeth and gums : Homewood:
50.8%Illinois:
47.2%
Average BMI : Homewood:
28.7Illinois:
28.6
People feeling badly about themselves : People not drinking alcohol at all : Homewood:
10.1%Illinois:
10.8%
Average hours sleeping at night : General health condition : Homewood:
58.2%Illinois:
56.4%
Average condition of hearing : This city:
79.4%Illinois:
79.9%
More about Health and Nutrition of Homewood, IL Residents
Local government employment and payroll (March 2022)
Function
Full-time employees
Monthly full-time payroll
Average yearly full-time wage
Part-time employees
Monthly part-time payroll
Police Protection - Officers
40 $355,371 $106,611 0 $0 Firefighters
20 $152,459 $91,475 2 $3,268 Other Government Administration
11 $88,534 $96,583 12 $24,508 Water Supply
10 $70,880 $85,056 0 $0 Other and Unallocable
8 $68,056 $102,084 1 $266 Streets and Highways
8 $60,636 $90,954 0 $0 Financial Administration
5 $37,203 $89,287 0 $0 Natural Resources
4 $28,623 $85,869 0 $0 Police - Other
4 $20,336 $61,008 23 $17,660 Fire - Other
1 $4,934 $59,208 0 $0
Totals for Government
111 $887,033 $95,895 38 $45,702
Homewood government finances - Expenditure in 2018 (per resident):
Construction - General - Other: $913,000 ($48.73)
Current Operations - General - Other: $15,254,000 ($814.20)
Water Utilities: $6,781,000 ($361.94)Central Staff Services: $5,527,000 ($295.01)Financial Administration: $1,115,000 ($59.51)General - Interest on Debt: $1,873,000 ($99.97)
Other Capital Outlay - Central Staff Services: $579,000 ($30.90)
Water Utilities: $461,000 ($24.61)Total Salaries and Wages: $11,195,000 ($597.54)
Homewood government finances - Revenue in 2018 (per resident):
Charges - Other: $994,000 ($53.06)
Parking Facilities: $25,000 ($1.33)Federal Intergovernmental - Other: $3,000 ($0.16)
Miscellaneous - General Revenue - Other: $3,044,000 ($162.48)
Fines and Forfeits: $594,000 ($31.71)Interest Earnings: $5,000 ($0.27)Revenue - Water Utilities: $7,236,000 ($386.23)
State Intergovernmental - General Local Government Support: $6,719,000 ($358.63)
Highways: $493,000 ($26.31)Other: $8,000 ($0.43)Tax - Property: $6,018,000 ($321.22)
Other Selective Sales: $2,406,000 ($128.42)Public Utilities Sales: $1,540,000 ($82.20)Other License: $643,000 ($34.32)
Homewood government finances - Debt in 2018 (per resident):
Long Term Debt - Beginning Outstanding - Unspecified Public Purpose: $46,815,000 ($2498.80)
Outstanding Unspecified Public Purpose: $44,887,000 ($2395.89)Retired Unspecified Public Purpose: $4,677,000 ($249.64)Issue, Unspecified Public Purpose: $2,750,000 ($146.78)
Homewood government finances - Cash and Securities in 2018 (per resident):
Other Funds - Cash and Securities: $22,438,000 ($1197.65)
3.53% of this county's 2021 resident taxpayers lived in other counties in 2020 ($82,405 average adjusted gross income )
Here:
3.53%Illinois average:
5.09%
0.01% of residents moved from foreign countries ($114 average AGI )Cook County:
0.01%Illinois average:
0.01%
Top counties from which taxpayers relocated into this county between 2020 and 2021:
5.44% of this county's 2020 resident taxpayers moved to other counties in 2021 ($120,340 average adjusted gross income )
Here:
5.44%Illinois average:
6.10%
0.01% of residents moved to foreign countries ($140 average AGI )Cook County:
0.01%Illinois average:
0.01%
Top counties to which taxpayers relocated from this county between 2020 and 2021:
Businesses in Homewood, IL
Name Count Name Count
7-Eleven 2 KFC 1 AT&T 1 Kmart 1 Ace Hardware 1 Kohl's 1 Applebee's 1 Lane Bryant 1 Baskin-Robbins 1 MasterBrand Cabinets 1 Bed Bath & Beyond 1 McDonald's 2 Brunswick Bowling & Billiards 1 Menards 1 Caribou Coffee 1 Nike 4 Chevrolet 1 OfficeMax 1 Cold Stone Creamery 1 Panda Express 1 Cricket Wireless 1 Panera Bread 1 Curves 1 Payless 1 DHL 1 Pizza Hut 1 Dairy Queen 1 RadioShack 1 Discount Tire 1 Sears 1 DressBarn 1 Sprint Nextel 1 Dressbarn 1 Starbucks 3 Dunkin Donuts 2 Subway 1 Famous Footwear 1 T-Mobile 1 Fashion Bug 1 T.J.Maxx 1 FedEx 9 Taco Bell 1 Firestone Complete Auto Care 1 Target 1 Ford 1 U-Haul 3 GameStop 1 UPS 12 H&R Block 1 Walgreens 1 Home Depot 1 White Castle 1 Jewel-Osco 2
Strongest AM radio stations in Homewood:
WLS (890 AM; 50 kW; CHICAGO, IL; Owner: WLS, INC.)
WVIV (1200 AM; 20 kW; CHICAGO, IL; Owner: WLXX-AM LICENSE CORP.)
WYLL (1160 AM; 50 kW; CHICAGO, IL; Owner: SCA LICENSE CORPORATION)
WNTD (950 AM; 5 kW; CHICAGO, IL; Owner: RADIO UNICA OF CHICAGO LICENSE CORP.)
WMVP (1000 AM; 50 kW; CHICAGO, IL; Owner: ABC, INC.)
WNWI (1080 AM; 3 kW; OAK LAWN, IL; Owner: BIRACH BROADCASTING CORPORATION)
WSCR (670 AM; 50 kW; CHICAGO, IL; Owner: INFINITY BROADCASTING OPERATIONS, INC.)
WBEE (1570 AM; 1 kW; HARVEY, IL)
WIND (560 AM; 5 kW; CHICAGO, IL; Owner: TICHENOR LICENSE CORPORATION ("TLC"))
WBBM (780 AM; 50 kW; CHICAGO, IL; Owner: INFINITY BROADCASTING OPERATIONS, INC.)
WGN (720 AM; 50 kW; CHICAGO, IL; Owner: WGN CONTINENTAL BROADCASTING CO.)
WRDZ (1300 AM; 4 kW; LA GRANGE, IL; Owner: ABC, INC.)
WCGO (1600 AM; 1 kW; CHICAGO HEIGHTS, IL)
Strongest FM radio stations in Homewood:
WYCA (106.3 FM; LANSING, IL; Owner: DONTRON, INC.)
WPWX (92.3 FM; HAMMOND, IN; Owner: DONTRON, INC.)
WCKG (105.9 FM; ELMWOOD PARK, IL; Owner: INFINITY HOLDINGS CORPORATION OF ORLANDO)
WLIT-FM (93.9 FM; CHICAGO, IL; Owner: AMFM RADIO LICENSES, L.L.C.)
WJMK (104.3 FM; CHICAGO, IL; Owner: INFINITY BROADCASTING CORP. OF ILLINOIS)
WNUA (95.5 FM; CHICAGO, IL; Owner: AMFM RADIO LICENSES, L.L.C.)
WTMX (101.9 FM; SKOKIE, IL; Owner: BONNEVILLE HOLDING COMPANY)
WBBM-FM (96.3 FM; CHICAGO, IL; Owner: INFINITY BROADCASTING OPERATIONS, INC.)
WKSC-FM (103.5 FM; CHICAGO, IL; Owner: AMFM RADIO LICENSES, L.L.C.)
WFMT (98.7 FM; CHICAGO, IL; Owner: WINDOW TO THE WORLD COMMUNICATIONS)
WZZN (94.7 FM; CHICAGO, IL; Owner: ABC CHICAGO FM RADIO,INC.)
WGCI-FM (107.5 FM; CHICAGO, IL; Owner: AMFM RADIO LICENSES, L.L.C.)
WDRV (97.1 FM; CHICAGO, IL; Owner: BONNEVILLE HOLDING COMPANY)
WBEZ (91.5 FM; CHICAGO, IL; Owner: THE WBEZ ALLIANCE, INC.)
WKQX (101.1 FM; CHICAGO, IL; Owner: EMMIS RADIO LICENSE CORPORATION)
WLUP-FM (97.9 FM; CHICAGO, IL; Owner: BONNEVILLE HOLDING COMPANY)
WNND (100.3 FM; CHICAGO, IL; Owner: BONNEVILLE HOLDING COMPANY)
WOJO (105.1 FM; EVANSTON, IL; Owner: TICHENOR LICENSE CORPORATION ("TLC"))
WUSN (99.5 FM; CHICAGO, IL; Owner: INFINITY BROADCASTING CORPORATION OF CHICAGO)
WVAZ (102.7 FM; OAK PARK, IL; Owner: AMFM RADIO LICENSES, L.L.C.)
TV broadcast stations around Homewood:
WLS-TV (Channel 7; CHICAGO, IL; Owner: WLS TELEVISION, INC.)
WMAQ-TV (Channel 5; CHICAGO, IL; Owner: NBC SUBSIDIARY (WMAQ-TV), INC.)
WTTW (Channel 11; CHICAGO, IL; Owner: WINDOW TO THE WORLD COMMUNICATIONS, INC.)
WGN-TV (Channel 9; CHICAGO, IL; Owner: WGN CONTINENTAL BROADCASTING COMPANY)
WYIN (Channel 56; GARY, IN; Owner: NORTHWEST INDIANA PUBLIC BROADCASTING, INC.)
WGBO-TV (Channel 66; JOLIET, IL; Owner: WGBO LICENSE PARTNERSHIP, G.P.)
WBBM-TV (Channel 2; CHICAGO, IL; Owner: CBS BROADCASTING INC.)
WPWR-TV (Channel 50; GARY, IN; Owner: FOX TELEVISION STATIONS, INC.)
WXFT (Channel 60; AURORA, IL; Owner: TELEFUTURA CHICAGO LLC)
WCIU-TV (Channel 26; CHICAGO, IL; Owner: WCIU-TV LIMITED PARTNERSHIP)
WCPX (Channel 38; CHICAGO, IL; Owner: PAXSON CHICAGO LICENSE, INC.)
WFLD (Channel 32; CHICAGO, IL; Owner: FOX TELEVISION STATIONS, INC.)
W68DO (Channel 68; PALATINE, IL; Owner: TRINITY BROADCASTING NETWORK)
WFBT-CA (Channel 23; CHICAGO, IL; Owner: CHANNEL 23 LIMITED PARTNERSHIP)
WJYS (Channel 62; HAMMOND, IN; Owner: JOVON BROADCASTING CORPORATION)
WSNS-TV (Channel 44; CHICAGO, IL; Owner: TELEMUNDO OF CHICAGO, INC.)
WOCH-LP (Channel 28; CHICAGO, IL; Owner: KM LPTV OF CHICAGO-28, L.L.C.)
WYCC (Channel 20; CHICAGO, IL; Owner: COLLEGE DIST. #508, COUNTY OF COOK)
W54AP (Channel 54; BLUE ISLAND, IL; Owner: CATHOLIC VIEWS BROADCASTS, INC.)
WOCK-CA (Channel 13; CHICAGO, IL; Owner: KM LPTV OF CHICAGO-13, L.L.C.)
W34CK (Channel 34; ARLINGTON HEIGHTS, IL; Owner: FIRST UNITED, INC.)
W18AT (Channel 18; GARY, IN; Owner: LESEA BROADCASTING CORPORATION)
National Bridge Inventory (NBI) Statistics 8 Number of bridges36ft / 10.6m Total length259,300 Total average daily traffic46,738 Total average daily truck traffic
FCC Registered Antenna Towers: 45 (
See the full list of FCC Registered Antenna Towers in Homewood )
FCC Registered Private Land Mobile Towers: 3 (
See the full list of FCC Registered Private Land Mobile Towers in Homewood, IL )
FCC Registered Broadcast Land Mobile Towers: 18 (
See the full list of FCC Registered Broadcast Land Mobile Towers )
FCC Registered Microwave Towers: 22 (
See the full list of FCC Registered Microwave Towers in this town )
FCC Registered Paging Towers: 2 (
See the full list of FCC Registered Paging Towers )
FCC Registered Amateur Radio Licenses: 72 (
See the full list of FCC Registered Amateur Radio Licenses in Homewood )
FAA Registered Aircraft: 7
Aircraft: CULVER LFA (Category: Land, Seats: 2, Weight: Up to 12,499 Pounds, Speed: 108 mph), Engine: FRANKLIN 4AC176C-D-F (80 HP) (Reciprocating)N-Number: 41733, N41733, N-41733, Serial Number: 455, Year manufactured: 1942, Airworthiness Date: 11/13/1955, Certificate Issue Date: 03/13/2014Registrant (Individual): Stuart Wallace, 2829 183rd St, Homewood, IL 60430Aircraft: AIRBORNE WINDSPORTS PTY LTD EDGE XT-912-L (Category: Land, Seats: 2, Weight: Up to 12,499 Pounds), Engine: ROTAX 912ULS SERIES (100 HP) (4 Cycle)N-Number: 432LM, N432LM, N-432LM, Serial Number: XT-912-0523, Year manufactured: 2017, Airworthiness Date: 07/01/2017, Certificate Issue Date: 06/14/2017Registrant (Individual): Michael J Hamm, 18404 Clyde Rd, Homewood, IL 60430Aircraft: CIRRUS DESIGN CORP SR22 (Category: Land, Seats: 4, Weight: Up to 12,499 Pounds), Engine: CONT MOTOR IO-550-N (310 HP) (Reciprocating)N-Number: 630RA, N630RA, N-630RA, Serial Number: 2872, Year manufactured: 2007, Airworthiness Date: 12/17/2007, Certificate Issue Date: 01/11/2008Registrant (Corporation): Ab & D Custom Furniture Inc, 17200 Palmer Blvd, Homewood, IL 60430Aircraft: BELLANCA 14-13-2 (Category: Land, Seats: 4, Weight: Up to 12,499 Pounds, Speed: 120 mph), Engine: FRANKLIN 6A4150 SERIES (150 HP) (Reciprocating)N-Number: 86867, N86867, N-86867, Serial Number: 1229, Year manufactured: 1946, Airworthiness Date: 05/18/1956, Certificate Issue Date: 08/10/1981Registrant (Co-Owned): Stuart J Wallace, 2829 183rd St, Homewood, IL 60430, Other Owners: Jamie M WallaceAircraft: PIPER PA-28-140 (Category: Land, Seats: 4, Weight: Up to 12,499 Pounds, Speed: 107 mph), Engine: LYCOMING 0-320 SERIES (180 HP) (Reciprocating)N-Number: 3766K, N3766K, N-3766K, Serial Number: 28-23723, Year manufactured: 1967, Certificate Issue Date: 11/13/1970Registrant (Co-Owned): David Wyatt, 1618 Ridge Road, Homewood, IL 60430, Other Owners: David C EarlDeregistered: Cancel Date: 04/05/2018Aircraft: LESS' ARD JUNGSTER II (Category: Land, Weight: Up to 12,499 Pounds, Speed: 112 mph), Engine: ReciprocatingN-Number: 110L, N110L, N-110L, Serial Number: 682025, Certificate Issue Date: 12/21/1970Registrant (Individual): Ard Francis A Less, 3433 Flossmoor Rd, Homewood, IL 60430Aircraft: CESSNA 140 (Category: Land, Seats: 2, Weight: Up to 12,499 Pounds, Speed: 105 mph), Engine: CONT MOTOR C85 SERIES (85 HP) (Reciprocating)N-Number: 76011, N76011, N-76011, Serial Number: 10405, Year manufactured: 1946, Certificate Issue Date: 12/16/1977Registrant (Individual): William Tuinenga, 18136 Dolphin Lake Dr, Homewood, IL 60430Deregistered: Cancel Date: 02/04/2017
Home Mortgage Disclosure Act Aggregated Statistics For Year 2009(Based on 1 full and 5 partial tracts) A) FHA, FSA/RHS & VA B) Conventional C) Refinancings D) Home Improvement Loans F) Non-occupant Loans on Number Average Value Number Average Value Number Average Value Number Average Value Number Average Value
LOANS ORIGINATED 88 $152,468 44 $130,208 339 $160,194 18 $75,188 16 $90,039 APPLICATIONS APPROVED, NOT ACCEPTED 7 $135,646 4 $131,675 28 $170,460 2 $9,415 3 $108,627 APPLICATIONS DENIED 20 $157,844 16 $110,681 143 $167,863 22 $49,800 9 $96,579 APPLICATIONS WITHDRAWN 9 $140,227 4 $118,005 87 $164,088 3 $76,257 5 $107,814 FILES CLOSED FOR INCOMPLETENESS 4 $176,580 2 $97,255 26 $168,361 2 $43,845 0 $0
Aggregated Statistics For Year 2008(Based on 1 full and 5 partial tracts) A) FHA, FSA/RHS & VA B) Conventional C) Refinancings D) Home Improvement Loans E) Loans on Dwellings For 5+ Families F) Non-occupant Loans on Number Average Value Number Average Value Number Average Value Number Average Value Number Average Value Number Average Value
LOANS ORIGINATED 75 $163,873 104 $156,538 255 $165,474 22 $41,425 1 $1,119,470 40 $139,630 APPLICATIONS APPROVED, NOT ACCEPTED 10 $170,152 13 $166,779 44 $172,225 11 $41,299 0 $0 5 $144,334 APPLICATIONS DENIED 21 $166,410 31 $153,406 193 $171,852 35 $50,590 0 $0 13 $124,076 APPLICATIONS WITHDRAWN 18 $163,118 15 $171,635 73 $164,440 2 $99,545 1 $208,020 8 $143,152 FILES CLOSED FOR INCOMPLETENESS 2 $123,810 9 $125,297 24 $178,666 1 $125,720 0 $0 3 $155,717
Aggregated Statistics For Year 2007(Based on 1 full and 5 partial tracts) A) FHA, FSA/RHS & VA B) Conventional C) Refinancings D) Home Improvement Loans E) Loans on Dwellings For 5+ Families F) Non-occupant Loans on Number Average Value Number Average Value Number Average Value Number Average Value Number Average Value Number Average Value
LOANS ORIGINATED 25 $162,378 253 $154,024 421 $150,015 66 $63,638 2 $133,750 50 $126,870 APPLICATIONS APPROVED, NOT ACCEPTED 2 $166,055 41 $157,021 78 $146,085 11 $33,293 1 $387,930 7 $119,327 APPLICATIONS DENIED 9 $171,959 89 $154,593 347 $160,602 85 $72,596 1 $202,160 36 $140,790 APPLICATIONS WITHDRAWN 6 $195,078 27 $174,371 92 $169,419 8 $83,648 0 $0 8 $173,575 FILES CLOSED FOR INCOMPLETENESS 1 $162,770 13 $164,679 47 $175,957 2 $196,820 0 $0 7 $111,236
Aggregated Statistics For Year 2006(Based on 1 full and 5 partial tracts) A) FHA, FSA/RHS & VA B) Conventional C) Refinancings D) Home Improvement Loans E) Loans on Dwellings For 5+ Families F) Non-occupant Loans on G) Loans On Manufactured Number Average Value Number Average Value Number Average Value Number Average Value Number Average Value Number Average Value Number Average Value
LOANS ORIGINATED 21 $153,746 499 $132,566 534 $148,601 92 $56,366 1 $1,761,770 67 $124,144 0 $0 APPLICATIONS APPROVED, NOT ACCEPTED 2 $242,580 80 $135,395 96 $147,577 13 $87,734 0 $0 15 $125,752 0 $0 APPLICATIONS DENIED 6 $224,182 209 $125,835 358 $150,685 61 $68,133 0 $0 45 $129,719 2 $106,520 APPLICATIONS WITHDRAWN 5 $193,916 64 $132,819 164 $160,710 9 $103,708 0 $0 14 $109,053 0 $0 FILES CLOSED FOR INCOMPLETENESS 1 $89,170 28 $122,784 76 $170,014 1 $20,080 0 $0 5 $93,540 0 $0
Aggregated Statistics For Year 2005(Based on 1 full and 5 partial tracts) A) FHA, FSA/RHS & VA B) Conventional C) Refinancings D) Home Improvement Loans E) Loans on Dwellings For 5+ Families F) Non-occupant Loans on G) Loans On Manufactured Number Average Value Number Average Value Number Average Value Number Average Value Number Average Value Number Average Value Number Average Value
LOANS ORIGINATED 16 $159,496 502 $122,417 545 $138,386 83 $59,358 2 $414,505 69 $107,923 0 $0 APPLICATIONS APPROVED, NOT ACCEPTED 2 $178,740 85 $112,884 100 $130,119 17 $59,406 0 $0 7 $94,083 1 $58,940 APPLICATIONS DENIED 4 $162,402 123 $116,181 376 $144,463 63 $67,953 2 $401,650 25 $122,951 0 $0 APPLICATIONS WITHDRAWN 2 $111,365 62 $125,999 191 $158,600 24 $172,728 1 $325,340 13 $131,387 0 $0 FILES CLOSED FOR INCOMPLETENESS 1 $117,350 22 $114,332 66 $137,612 1 $64,460 0 $0 3 $76,863 0 $0
Aggregated Statistics For Year 2004(Based on 1 full and 5 partial tracts) A) FHA, FSA/RHS & VA B) Conventional C) Refinancings D) Home Improvement Loans E) Loans on Dwellings For 5+ Families F) Non-occupant Loans on G) Loans On Manufactured Number Average Value Number Average Value Number Average Value Number Average Value Number Average Value Number Average Value Number Average Value
LOANS ORIGINATED 34 $146,051 387 $123,084 628 $129,529 64 $58,264 1 $370,860 59 $105,903 3 $56,543 APPLICATIONS APPROVED, NOT ACCEPTED 3 $196,343 69 $124,668 122 $124,022 14 $62,199 0 $0 13 $112,931 0 $0 APPLICATIONS DENIED 11 $129,980 94 $116,986 352 $131,357 59 $46,360 0 $0 24 $99,849 2 $86,120 APPLICATIONS WITHDRAWN 3 $114,933 41 $143,655 149 $130,193 9 $61,204 0 $0 9 $112,037 0 $0 FILES CLOSED FOR INCOMPLETENESS 1 $95,110 13 $150,008 91 $141,777 3 $76,643 0 $0 3 $156,703 0 $0
Aggregated Statistics For Year 2003(Based on 1 full and 5 partial tracts) A) FHA, FSA/RHS & VA B) Conventional C) Refinancings D) Home Improvement Loans E) Loans on Dwellings For 5+ Families F) Non-occupant Loans on Number Average Value Number Average Value Number Average Value Number Average Value Number Average Value Number Average Value
LOANS ORIGINATED 55 $136,181 368 $128,225 1,198 $120,395 57 $39,184 1 $3,659,740 56 $96,477 APPLICATIONS APPROVED, NOT ACCEPTED 4 $115,065 48 $123,297 140 $117,864 12 $33,739 0 $0 9 $94,867 APPLICATIONS DENIED 5 $134,560 84 $116,409 374 $119,554 47 $29,133 0 $0 23 $95,567 APPLICATIONS WITHDRAWN 8 $130,441 47 $125,473 172 $124,159 5 $27,356 0 $0 7 $118,843 FILES CLOSED FOR INCOMPLETENESS 3 $126,337 10 $133,093 56 $125,705 3 $38,420 0 $0 2 $66,865
Aggregated Statistics For Year 2002(Based on 1 full and 5 partial tracts) A) FHA, FSA/RHS & VA B) Conventional C) Refinancings D) Home Improvement Loans E) Loans on Dwellings For 5+ Families F) Non-occupant Loans on Number Average Value Number Average Value Number Average Value Number Average Value Number Average Value Number Average Value
LOANS ORIGINATED 93 $120,591 299 $113,181 671 $120,134 47 $28,518 1 $1,690,580 39 $93,883 APPLICATIONS APPROVED, NOT ACCEPTED 6 $140,090 40 $111,564 112 $115,130 6 $30,290 0 $0 10 $92,832 APPLICATIONS DENIED 13 $135,594 64 $104,798 211 $115,276 29 $25,109 0 $0 14 $92,853 APPLICATIONS WITHDRAWN 9 $116,284 33 $124,904 138 $120,589 11 $27,945 1 $179,140 7 $120,569 FILES CLOSED FOR INCOMPLETENESS 2 $139,070 19 $123,564 113 $111,164 1 $78,290 0 $0 3 $92,880
Aggregated Statistics For Year 2001(Based on 1 full and 5 partial tracts) A) FHA, FSA/RHS & VA B) Conventional C) Refinancings D) Home Improvement Loans E) Loans on Dwellings For 5+ Families F) Non-occupant Loans on Number Average Value Number Average Value Number Average Value Number Average Value Number Average Value Number Average Value
LOANS ORIGINATED 103 $123,297 286 $108,448 568 $114,157 59 $30,184 2 $740,140 20 $89,879 APPLICATIONS APPROVED, NOT ACCEPTED 2 $139,755 36 $106,663 65 $106,220 15 $22,518 0 $0 8 $83,180 APPLICATIONS DENIED 6 $101,645 64 $102,504 250 $110,054 48 $21,947 0 $0 15 $80,861 APPLICATIONS WITHDRAWN 13 $121,251 35 $116,721 122 $108,017 18 $32,635 0 $0 2 $120,105 FILES CLOSED FOR INCOMPLETENESS 3 $108,623 9 $91,452 41 $121,199 2 $29,650 0 $0 1 $167,460
Aggregated Statistics For Year 2000(Based on 1 full and 5 partial tracts) A) FHA, FSA/RHS & VA B) Conventional C) Refinancings D) Home Improvement Loans E) Loans on Dwellings For 5+ Families F) Non-occupant Loans on Number Average Value Number Average Value Number Average Value Number Average Value Number Average Value Number Average Value
LOANS ORIGINATED 94 $113,972 259 $107,006 172 $96,302 66 $34,017 2 $325,095 24 $80,254 APPLICATIONS APPROVED, NOT ACCEPTED 4 $137,735 27 $104,969 42 $109,323 15 $23,601 1 $250,630 2 $102,180 APPLICATIONS DENIED 12 $120,157 72 $110,543 185 $101,721 59 $29,759 0 $0 10 $59,818 APPLICATIONS WITHDRAWN 8 $102,236 36 $109,352 82 $87,467 8 $39,630 0 $0 6 $90,530 FILES CLOSED FOR INCOMPLETENESS 1 $111,920 6 $103,587 56 $120,936 1 $39,930 0 $0 2 $107,960
Aggregated Statistics For Year 1999(Based on 1 full and 5 partial tracts) A) FHA, FSA/RHS & VA B) Conventional C) Refinancings D) Home Improvement Loans E) Loans on Dwellings For 5+ Families F) Non-occupant Loans on Number Average Value Number Average Value Number Average Value Number Average Value Number Average Value Number Average Value
LOANS ORIGINATED 97 $113,415 278 $113,534 365 $101,956 66 $22,383 1 $133,170 42 $75,431 APPLICATIONS APPROVED, NOT ACCEPTED 1 $189,140 32 $103,806 82 $100,876 16 $20,208 0 $0 2 $80,780 APPLICATIONS DENIED 14 $112,456 68 $101,860 178 $109,888 57 $18,320 0 $0 6 $90,688 APPLICATIONS WITHDRAWN 8 $104,226 39 $117,609 137 $102,619 14 $41,655 1 $1,710,210 5 $104,472 FILES CLOSED FOR INCOMPLETENESS 1 $117,120 7 $108,453 54 $104,376 3 $16,570 0 $0 2 $59,570
Detailed HMDA statistics for the following Tracts:
8255.03
, 8284.01 , 8284.02 , 8286.01 , 8286.02 , 8298.00
Private Mortgage Insurance Companies Aggregated Statistics For Year 2009(Based on 1 full and 5 partial tracts) A) Conventional B) Refinancings C) Non-occupant Loans on Number Average Value Number Average Value Number Average Value
LOANS ORIGINATED 7 $160,306 7 $186,471 0 $0 APPLICATIONS APPROVED, NOT ACCEPTED 8 $168,230 2 $188,580 2 $144,580 APPLICATIONS DENIED 1 $182,260 4 $184,278 0 $0 APPLICATIONS WITHDRAWN 2 $197,160 2 $215,730 0 $0 FILES CLOSED FOR INCOMPLETENESS 0 $0 1 $104,080 0 $0
Aggregated Statistics For Year 2008(Based on 1 full and 5 partial tracts) A) Conventional B) Refinancings C) Non-occupant Loans on Number Average Value Number Average Value Number Average Value
LOANS ORIGINATED 69 $170,017 25 $169,758 6 $154,650 APPLICATIONS APPROVED, NOT ACCEPTED 28 $157,375 19 $188,232 2 $139,360 APPLICATIONS DENIED 11 $144,297 6 $102,870 3 $134,783 APPLICATIONS WITHDRAWN 4 $177,902 1 $150,870 1 $168,620 FILES CLOSED FOR INCOMPLETENESS 3 $117,107 2 $138,950 2 $68,105
Aggregated Statistics For Year 2007(Based on 1 full and 5 partial tracts) A) Conventional B) Refinancings C) Non-occupant Loans on Number Average Value Number Average Value Number Average Value
LOANS ORIGINATED 108 $175,350 59 $199,652 3 $160,080 APPLICATIONS APPROVED, NOT ACCEPTED 23 $182,237 10 $173,039 1 $58,550 APPLICATIONS DENIED 7 $194,080 2 $130,440 0 $0 APPLICATIONS WITHDRAWN 7 $164,931 6 $193,410 1 $102,820 FILES CLOSED FOR INCOMPLETENESS 0 $0 0 $0 0 $0
Aggregated Statistics For Year 2006(Based on 1 full and 5 partial tracts) A) Conventional B) Refinancings C) Non-occupant Loans on Number Average Value Number Average Value Number Average Value
LOANS ORIGINATED 82 $155,215 32 $180,498 5 $94,766 APPLICATIONS APPROVED, NOT ACCEPTED 11 $134,704 8 $156,030 1 $118,550 APPLICATIONS DENIED 2 $117,000 0 $0 0 $0 APPLICATIONS WITHDRAWN 3 $182,827 2 $142,820 0 $0 FILES CLOSED FOR INCOMPLETENESS 1 $54,780 0 $0 0 $0
Aggregated Statistics For Year 2005(Based on 1 full and 5 partial tracts) A) Conventional B) Refinancings C) Non-occupant Loans on Number Average Value Number Average Value Number Average Value
LOANS ORIGINATED 80 $145,745 32 $158,840 9 $99,750 APPLICATIONS APPROVED, NOT ACCEPTED 8 $132,331 11 $151,395 1 $128,830 APPLICATIONS DENIED 1 $47,840 2 $197,640 1 $239,000 APPLICATIONS WITHDRAWN 3 $158,930 4 $172,252 0 $0 FILES CLOSED FOR INCOMPLETENESS 1 $155,320 2 $116,490 0 $0
Aggregated Statistics For Year 2004(Based on 1 full and 5 partial tracts) A) Conventional B) Refinancings C) Non-occupant Loans on Number Average Value Number Average Value Number Average Value
LOANS ORIGINATED 92 $142,081 45 $148,106 10 $97,975 APPLICATIONS APPROVED, NOT ACCEPTED 12 $149,277 22 $165,263 2 $107,455 APPLICATIONS DENIED 2 $138,840 1 $72,810 0 $0 APPLICATIONS WITHDRAWN 4 $171,878 2 $141,395 0 $0 FILES CLOSED FOR INCOMPLETENESS 0 $0 0 $0 0 $0
Aggregated Statistics For Year 2003(Based on 1 full and 5 partial tracts) A) Conventional B) Refinancings C) Non-occupant Loans on Number Average Value Number Average Value Number Average Value
LOANS ORIGINATED 151 $128,909 146 $139,881 12 $91,156 APPLICATIONS APPROVED, NOT ACCEPTED 19 $130,064 34 $131,955 5 $110,400 APPLICATIONS DENIED 3 $91,970 1 $164,850 1 $65,870 APPLICATIONS WITHDRAWN 6 $115,153 8 $137,715 1 $97,480 FILES CLOSED FOR INCOMPLETENESS 0 $0 0 $0 0 $0
Aggregated Statistics For Year 2002(Based on 1 full and 5 partial tracts) A) Conventional B) Refinancings C) Non-occupant Loans on Number Average Value Number Average Value Number Average Value
LOANS ORIGINATED 125 $122,674 109 $135,652 10 $87,145 APPLICATIONS APPROVED, NOT ACCEPTED 18 $111,477 20 $134,898 1 $70,690 APPLICATIONS DENIED 1 $67,510 3 $112,013 0 $0 APPLICATIONS WITHDRAWN 6 $128,495 7 $151,194 2 $188,750 FILES CLOSED FOR INCOMPLETENESS 1 $69,080 0 $0 0 $0
Aggregated Statistics For Year 2001(Based on 1 full and 5 partial tracts) A) Conventional B) Refinancings C) Non-occupant Loans on Number Average Value Number Average Value Number Average Value
LOANS ORIGINATED 115 $117,433 80 $135,712 2 $129,755 APPLICATIONS APPROVED, NOT ACCEPTED 17 $118,197 17 $139,888 1 $80,500 APPLICATIONS DENIED 3 $149,713 4 $151,988 0 $0 APPLICATIONS WITHDRAWN 2 $100,215 1 $62,410 0 $0 FILES CLOSED FOR INCOMPLETENESS 1 $81,940 0 $0 0 $0
Aggregated Statistics For Year 2000(Based on 1 full and 5 partial tracts) A) Conventional B) Refinancings C) Non-occupant Loans on Number Average Value Number Average Value Number Average Value
LOANS ORIGINATED 89 $117,508 14 $120,991 5 $91,108 APPLICATIONS APPROVED, NOT ACCEPTED 9 $139,382 6 $112,435 2 $63,060 APPLICATIONS DENIED 7 $163,499 2 $110,145 1 $97,080 APPLICATIONS WITHDRAWN 8 $136,909 1 $119,960 0 $0 FILES CLOSED FOR INCOMPLETENESS 0 $0 1 $69,660 0 $0
Aggregated Statistics For Year 1999(Based on 1 full and 5 partial tracts) A) Conventional B) Refinancings C) Non-occupant Loans on Number Average Value Number Average Value Number Average Value
LOANS ORIGINATED 111 $116,054 50 $122,857 2 $62,695 APPLICATIONS APPROVED, NOT ACCEPTED 11 $107,739 13 $119,704 1 $102,750 APPLICATIONS DENIED 4 $145,285 3 $125,240 1 $59,980 APPLICATIONS WITHDRAWN 3 $126,110 4 $132,885 0 $0 FILES CLOSED FOR INCOMPLETENESS 1 $124,720 0 $0 0 $0
Detailed PMIC statistics for the following Tracts:
8255.03
, 8284.01 , 8284.02 , 8286.01 , 8286.02 , 8298.00
Most common first names in Homewood, IL among deceased individuals Name Count Lived (average)
Mary 216 80.9 years John 206 75.6 years Helen 131 81.8 years William 130 75.4 years Robert 121 71.2 years James 95 72.1 years Margaret 89 81.0 years George 86 77.2 years Charles 84 75.4 years Anna 81 86.1 years
Most common last names in Homewood, IL among deceased individuals Last name Count Lived (average)
Johnson 69 79.9 years Smith 46 80.4 years Anderson 39 78.5 years Brown 33 77.4 years Nelson 29 78.2 years Miller 27 79.1 years Peterson 24 75.9 years Martin 23 79.4 years Williams 23 74.7 years Davis 22 73.1 years
Homewood compared to Illinois state average:
Unemployed percentage significantly below state average. Black race population percentage significantly above state average. Hispanic race population percentage below state average. Foreign-born population percentage significantly below state average. Renting percentage below state average. Length of stay since moving in significantly above state average. Percentage of population with a bachelor's degree or higher above state average.
#60 on the list of "Top 101 cities with the most residents born in Nigeria (population 500+)"
#1 on the list of "Top 101 counties with the most Black Protestant congregations"
#1 on the list of "Top 101 counties with the most Catholic congregations"
#1 on the list of "Top 101 counties with the highest surface withdrawal of fresh water for public supply"
#2 on the list of "Top 101 counties with the most Black Protestant adherents"
#2 on the list of "Top 101 counties with the most Orthodox congregations (pop. 50,000+)"
Top Patent Applicants
Lina Arbash Meinel (6)
John B. Brewster (6)
David A. Shereyk (5)
Carolyn Taylor (4)
Curt Brown (2)
David Rogel (2)
Kenji Suzuki (2)
Monroe Hart (2)
Phillip Norder (1)
Minnie Stinson (1)
Total of 54 patent applications in 2008-2024.
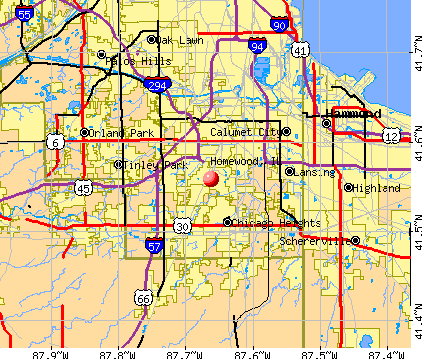


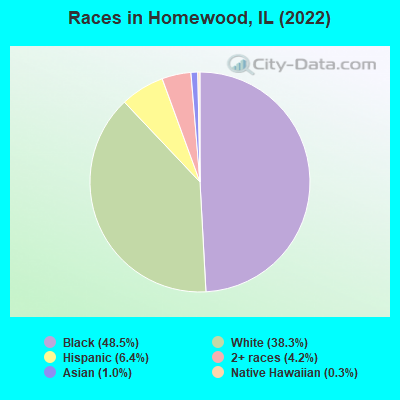
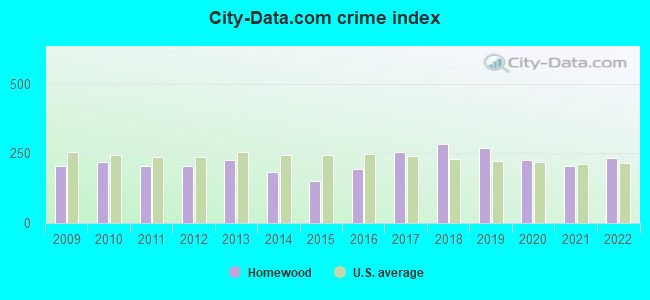
 Recent articles from our blog. Our writers, many of them Ph.D. graduates or candidates, create easy-to-read articles on a wide variety of topics.

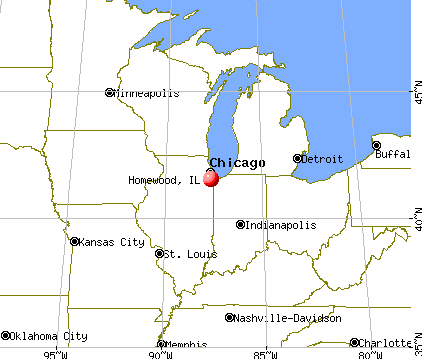
 (9.5 miles
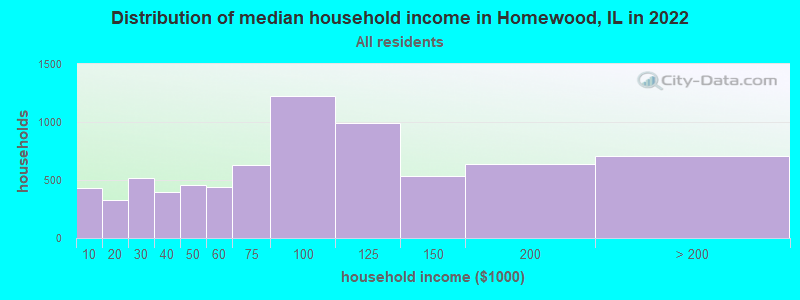
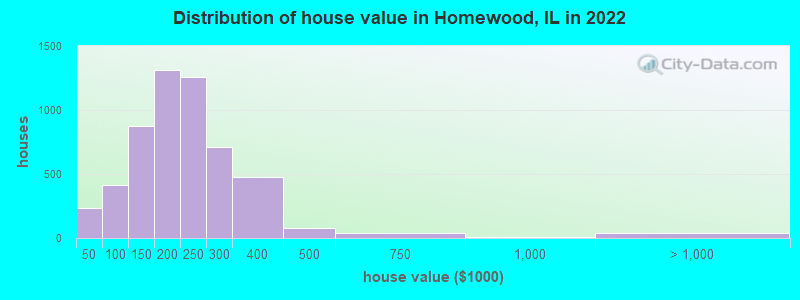
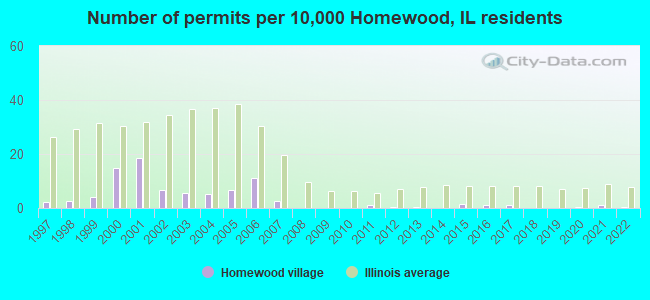
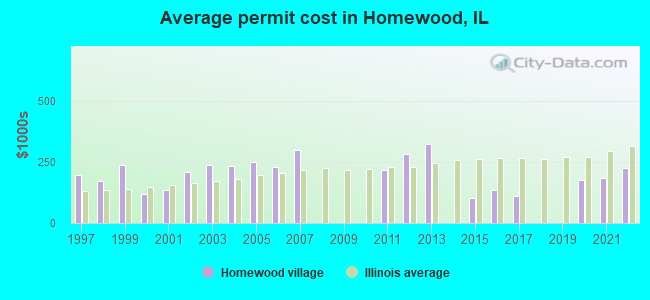
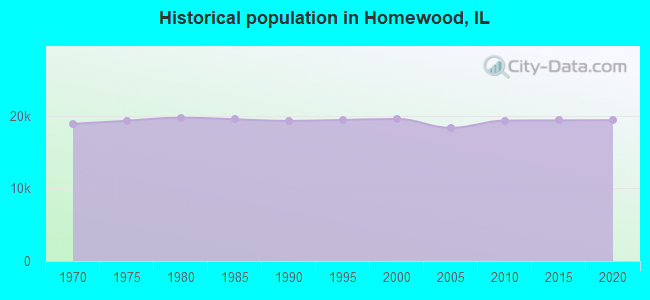
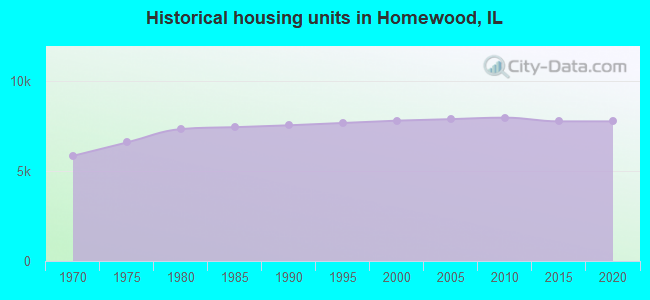
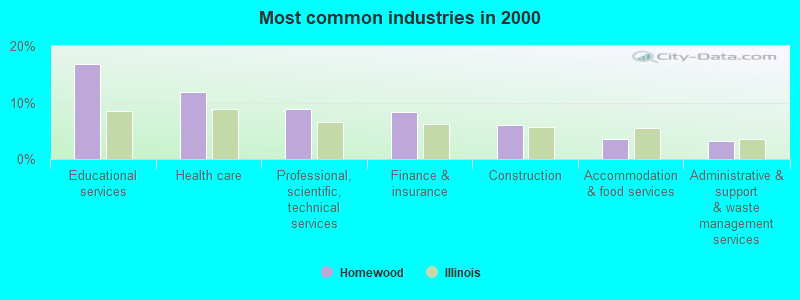
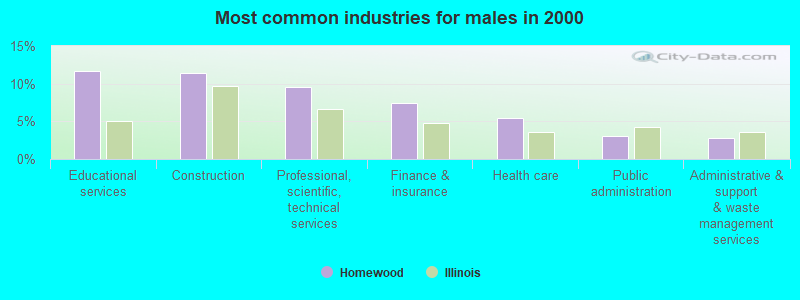
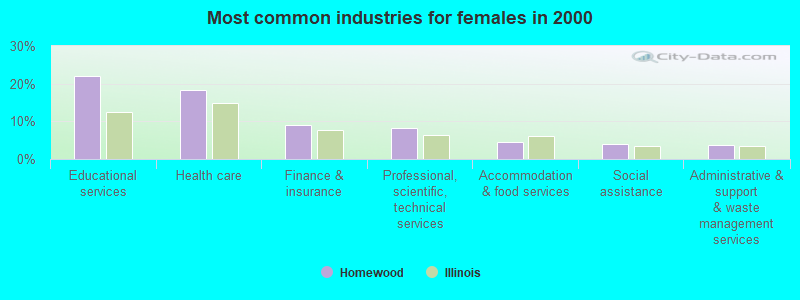
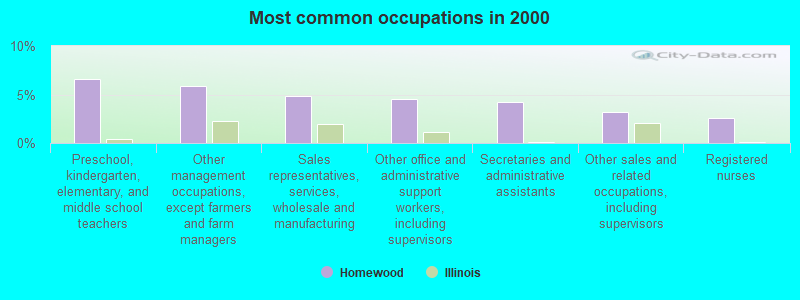
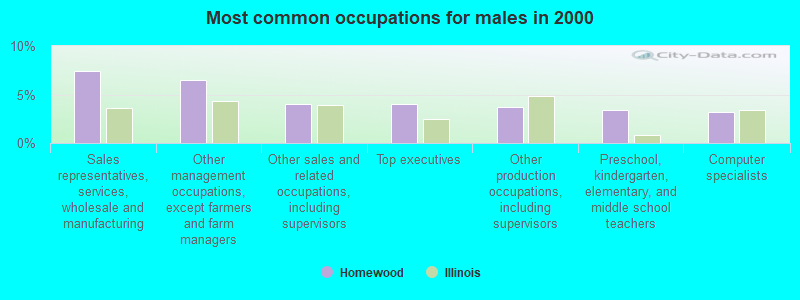
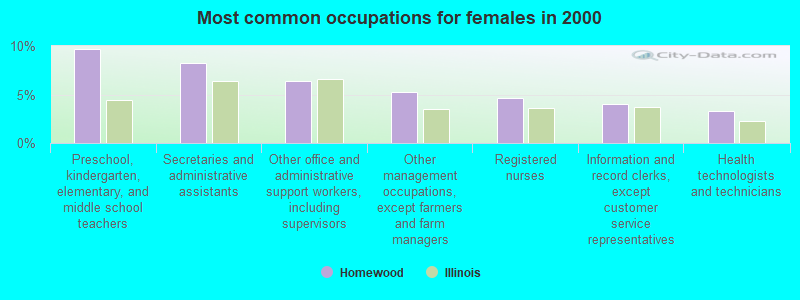


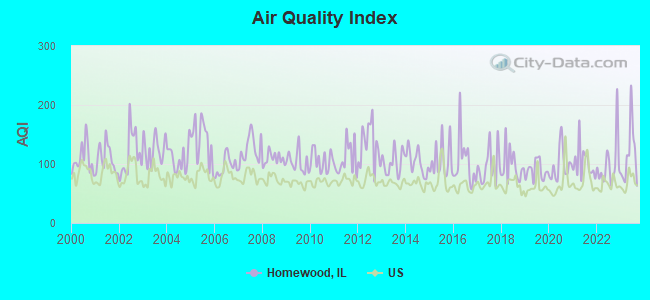
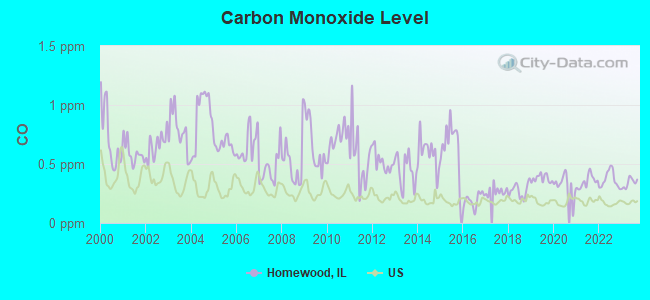
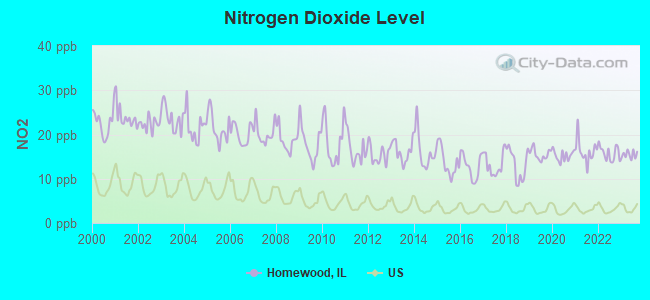
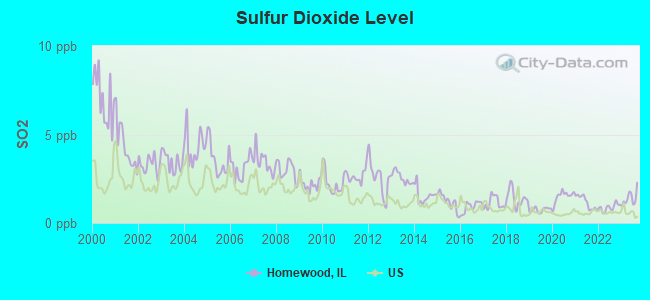
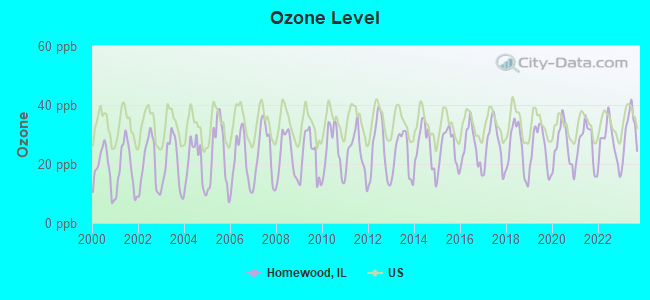
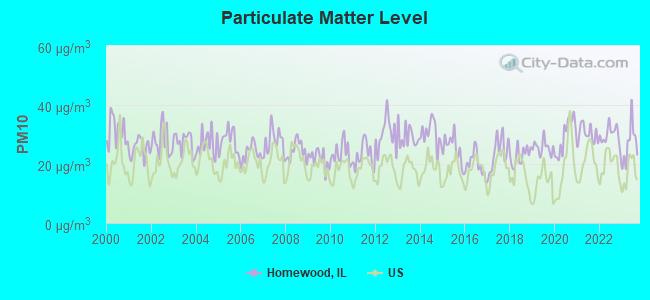
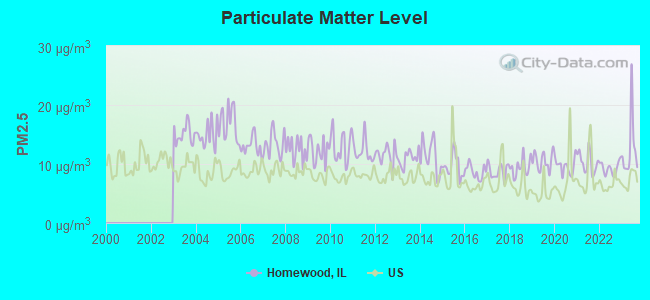
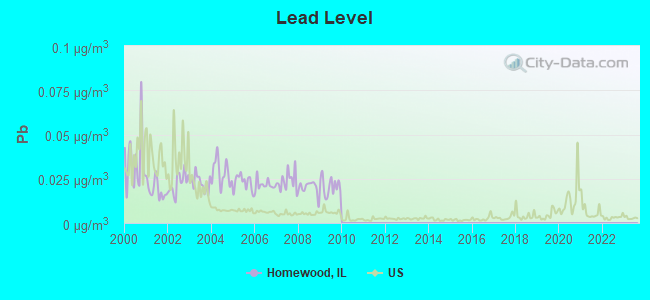

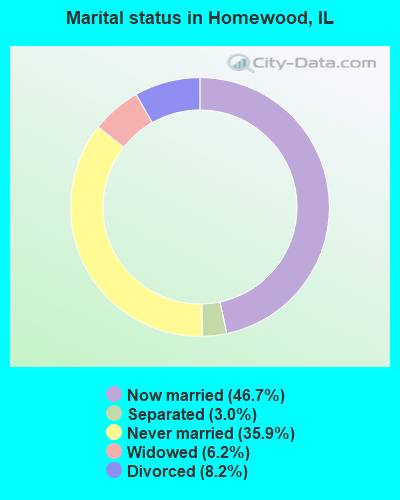
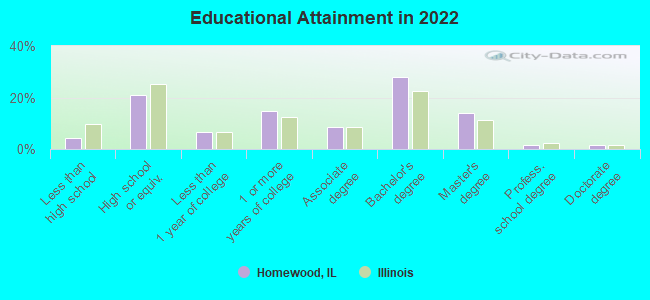
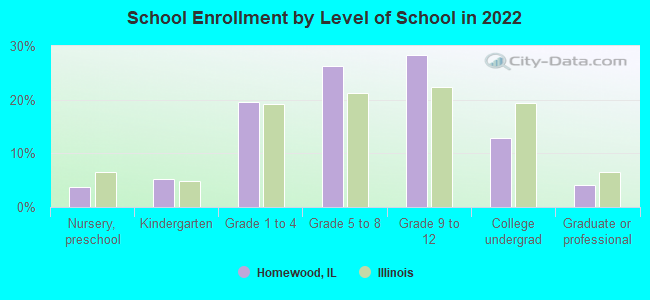
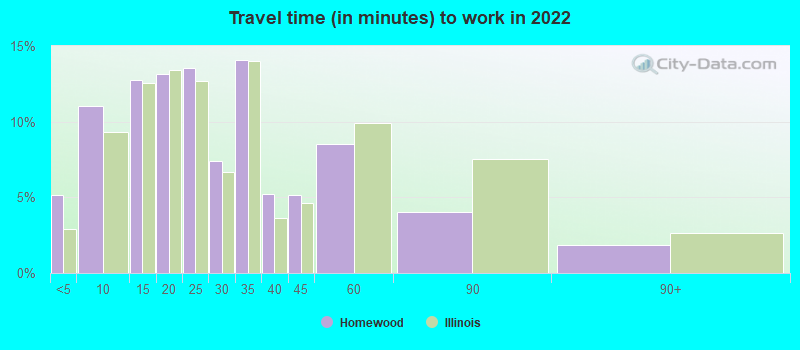
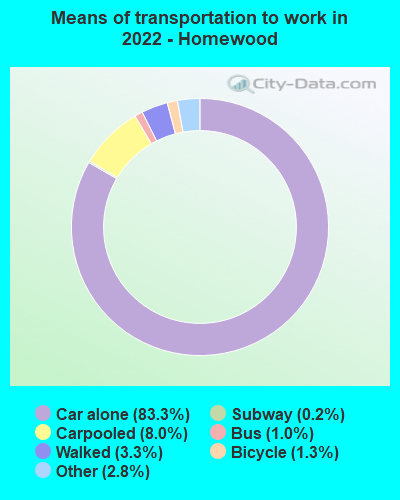


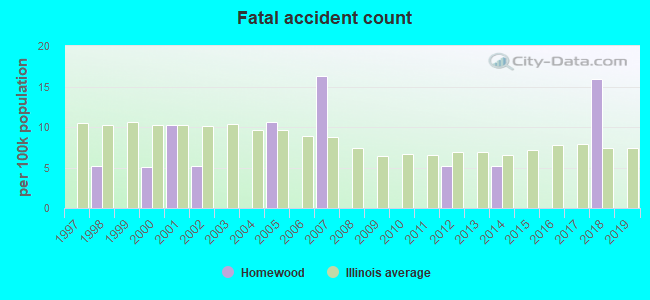
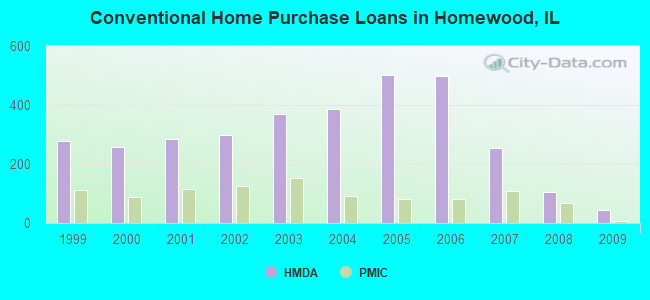
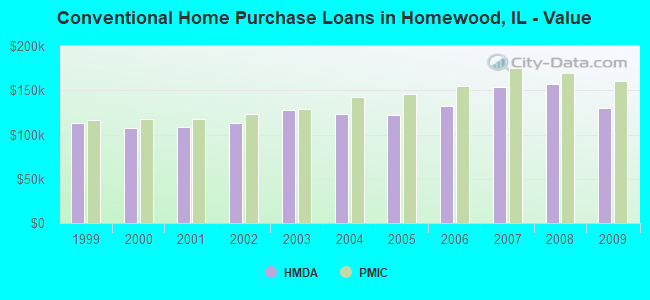
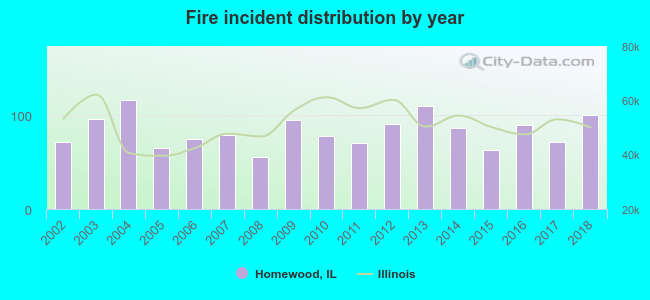 Based on the data from the years 2002 - 2018 the average number of fires per year is 83. The highest number of fires - 116 took place in 2004, and the least - 56 in 2008. The data has a rising trend.
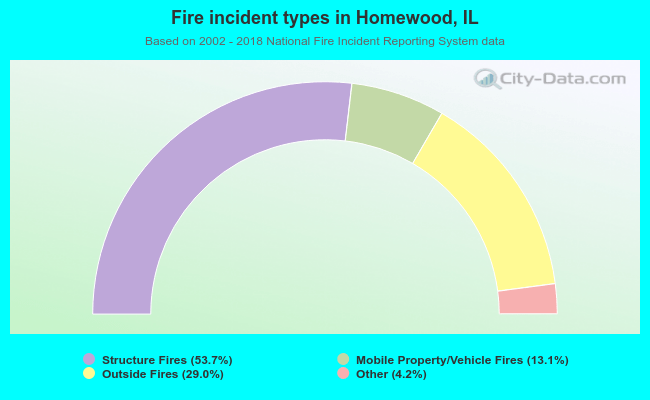 When looking into fire subcategories, the most incidents belonged to: Structure Fires (53.7%), and Outside Fires (29.0%).