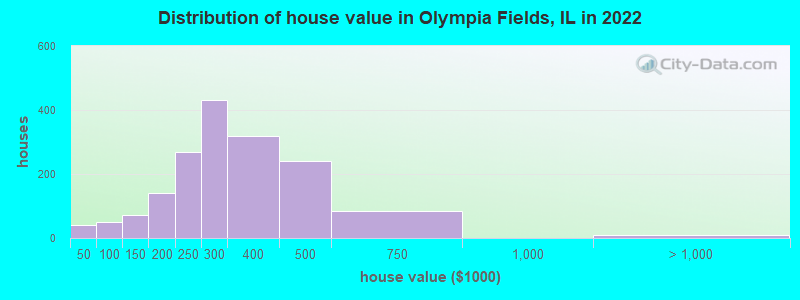
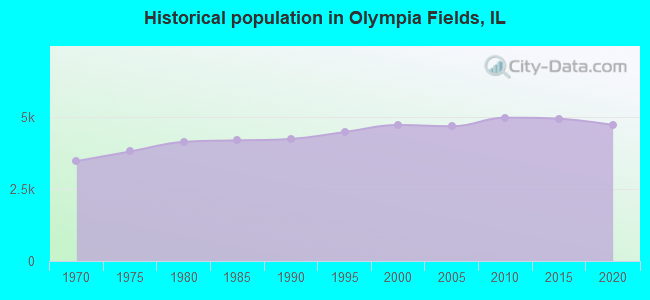
Estimated median house or condo value in 2022: $282,723 (it was $233,200 in 2000)
Olympia Fields:
$282,723
IL:
$251,600
Mean prices in 2022:all housing units: $375,299; detached houses: $398,817; townhouses or other attached units: $348,645; in 2-unit structures: $310,273; in 3-to-4-unit structures: $366,192; in 5-or-more-unit structures: $341,015; mobile homes: $69,289; occupied boats, rvs, vans, etc.: $126,496
Median gross rent in 2022: $3,485.
March 2022 cost of living index in Olympia Fields: 107.5 (more than average, U.S. average is 100)
According to our research of Illinois and other state lists, there were 3 registered sex offenders living in Olympia Fields, Illinois as of June 10, 2024. The ratio of all residents to sex offenders in Olympia Fields is 1,622 to 1. The ratio of registered sex offenders to all residents in this city is lower than the state average.
Crime rates in Olympia Fields by year
Type
2009
2010
2011
2012
2013
2014
2015
2016
2017
2018
2019
2020
2021
2022
Murders (per 100,000)
0 (0.0)
0 (0.0)
0 (0.0)
0 (0.0)
0 (0.0)
0 (0.0)
0 (0.0)
0 (0.0)
0 (0.0)
0 (0.0)
0 (0.0)
1 (20.9)
0 (0.0)
0 (0.0)
Rapes (per 100,000)
0 (0.0)
3 (60.1)
1 (20.0)
0 (0.0)
1 (19.8)
2 (39.6)
4 (79.1)
0 (0.0)
4 (81.4)
1 (20.5)
4 (83.0)
4 (83.8)
0 (0.0)
3 (65.6)
Robberies (per 100,000)
0 (0.0)
4 (80.2)
2 (40.0)
3 (59.9)
2 (39.6)
4 (79.1)
1 (19.8)
2 (39.8)
10 (203.6)
4 (82.0)
7 (145.2)
5 (104.7)
4 (84.6)
1 (21.9)
Assaults (per 100,000)
1 (21.1)
3 (60.1)
0 (0.0)
4 (79.8)
0 (0.0)
1 (19.8)
1 (19.8)
2 (39.8)
5 (101.8)
2 (41.0)
2 (41.5)
2 (41.9)
2 (42.3)
1 (21.9)
Burglaries (per 100,000)
0 (0.0)
23 (461.1)
12 (239.9)
16 (319.2)
8 (158.5)
14 (276.9)
15 (296.6)
11 (218.6)
25 (509.1)
17 (348.5)
11 (228.2)
6 (125.7)
22 (465.2)
15 (328.0)
Thefts (per 100,000)
17 (359.0)
171 (3,428)
108 (2,159)
88 (1,756)
170 (3,369)
102 (2,017)
104 (2,056)
134 (2,663)
204 (4,154)
327 (6,704)
471 (9,770)
268 (5,613)
123 (2,601)
142 (3,105)
Auto thefts (per 100,000)
1 (21.1)
10 (200.5)
6 (119.9)
6 (119.7)
6 (118.9)
3 (59.3)
2 (39.5)
1 (19.9)
11 (224.0)
9 (184.5)
8 (165.9)
16 (335.1)
13 (274.9)
12 (262.4)
Arson (per 100,000)
0 (0.0)
1 (20.0)
2 (40.0)
0 (0.0)
1 (19.8)
0 (0.0)
0 (0.0)
0 (0.0)
0 (0.0)
0 (0.0)
0 (0.0)
1 (20.9)
0 (0.0)
0 (0.0)
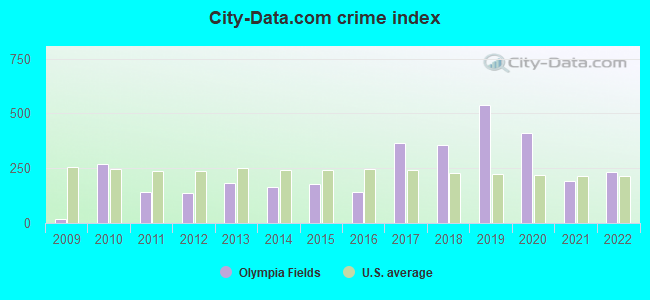
City-Data.com crime index
20.3
269.6
140.7
136.1
183.1
164.2
179.3
143.3
366.3
356.5
538.3
408.8
192.4
231.6
The City-Data.com crime index weighs serious crimes and violent crimes more heavily. Higher means more crime, U.S. average is 246.1. It adjusts for the number of visitors and daily workers commuting into cities.
Latest news from Olympia Fields, IL collected exclusively by city-data.com from local newspapers, TV, and radio stations
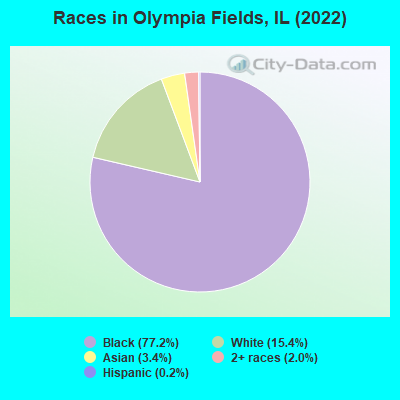
Ancestries: American (3.2%), African (2.2%), Haitian (1.9%), Irish (1.8%), Italian (1.0%).
Current Local Time: CST time zone
Incorporated on 10/05/1927
Elevation: 675 feet
Land area: 2.84 square miles.
Population density: 1,608 people per square mile (low).
221 residents are foreign born (2.7% Asia, 0.9% Latin America).
This village:
4.6%
Illinois:
14.1%
Median real estate property taxes paid for housing units with mortgages in 2022: $7,922 (2.9%) Median real estate property taxes paid for housing units with no mortgage in 2022: $9,033 (3.1%)
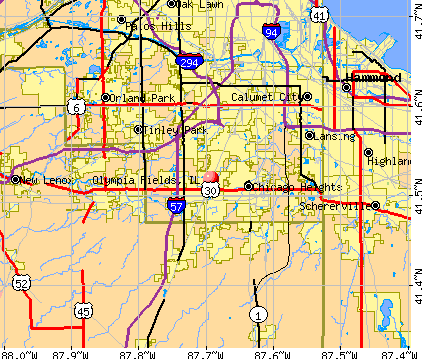
Nearest city with pop. 50,000+: Orland Park, IL (10.6 miles , pop. 51,077).
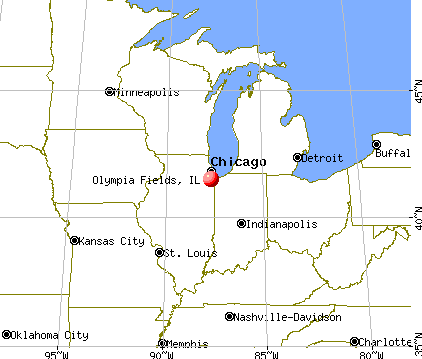
Nearest city with pop. 200,000+: Chicago, IL (22.3 miles , pop. 2,896,016).
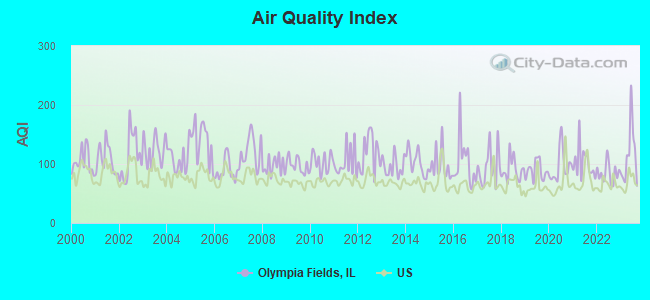
Air Quality Index (AQI) level in 2023 was 115. This is significantly worse than average.
City:
115
U.S.:
73
Carbon Monoxide (CO) [ppm] level in 2023 was 0.339. This is worse than average.Closest monitor was 2.5 miles away from the city center.
City:
0.339
U.S.:
0.251
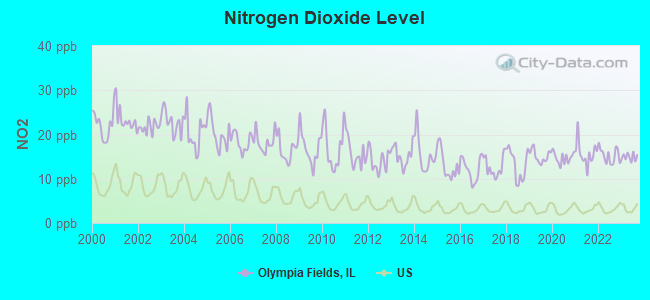
Nitrogen Dioxide (NO2) [ppb] level in 2023 was 14.9. This is significantly worse than average.Closest monitor was 0.5 miles away from the city center.
City:
14.9
U.S.:
5.1
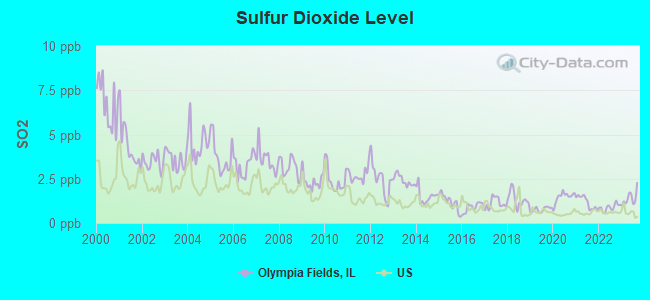
Sulfur Dioxide (SO2) [ppb] level in 2023 was 1.40. This is about average.Closest monitor was 0.5 miles away from the city center.
City:
1.40
U.S.:
1.51
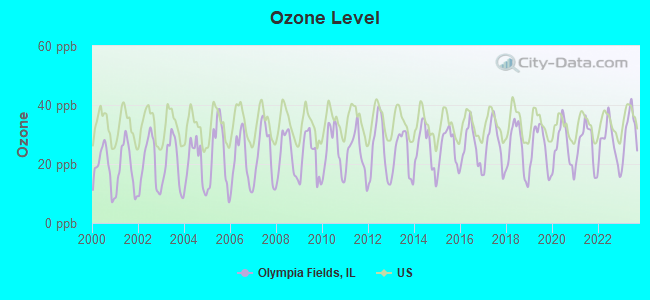
Ozone [ppb] level in 2023 was 31.2. This is about average.Closest monitor was 2.5 miles away from the city center.
City:
31.2
U.S.:
33.3
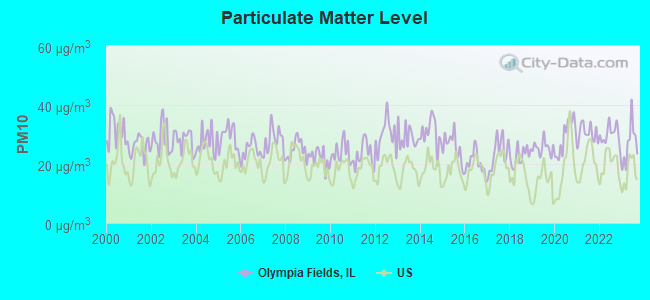
Particulate Matter (PM10) [µg/m3] level in 2023 was 26.7. This is worse than average.Closest monitor was 6.8 miles away from the city center.
City:
26.7
U.S.:
19.2
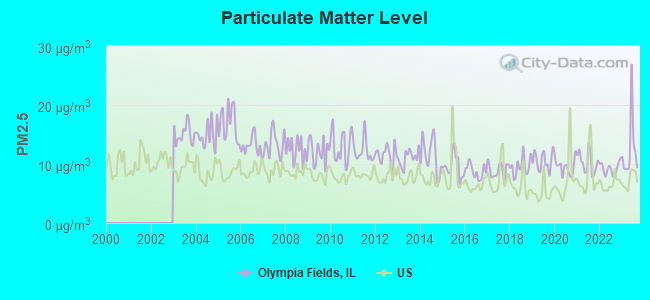
Particulate Matter (PM2.5) [µg/m3] level in 2023 was 12.4. This is significantly worse than average.Closest monitor was 8.2 miles away from the city center.
City:
12.4
U.S.:
8.1
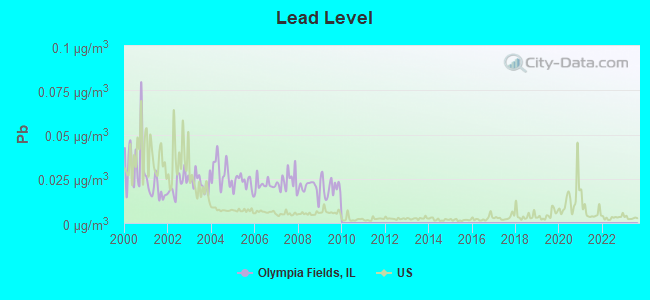
Lead (Pb) [µg/m3] level in 2009 was 0.0203. This is significantly worse than average.Closest monitor was 0.5 miles away from the city center.
City:
0.0203
U.S.:
0.0093
Tornado activity:
Olympia Fields-area historical tornado activity is near Illinois state average. It is 62% greater than the overall U.S. average.
On 8/28/1990, a category F5 (max. wind speeds 261-318 mph) tornado 21.1 miles away from the Olympia Fields village center killed 29 peopleand injured 350 peopleand causedbetween $50,000 and $500,000 in damages.
On 4/21/1967, a category F4 (max. wind speeds 207-260 mph) tornado 12.7 miles away from the village center killed 33 peopleand injured 500 peopleand causedbetween $5,000,000 and $50,000,000 in damages.
Earthquake activity:
Olympia Fields-area historical earthquake activity is significantly above Illinois state average. It is 47% greater than the overall U.S. average.
On 4/18/2008 at 09:36:59, a magnitude 5.4 (5.1 MB, 4.8 MS, 5.4 MW, 5.2 MW, Class: Moderate, Intensity: VI - VII) earthquake occurred 212.3 miles away from Olympia Fields center On 6/10/1987 at 23:48:54, a magnitude 5.1 (4.9 MB, 4.4 MS, 4.6 MS, 5.1 LG) earthquake occurred 186.8 miles away from the city center On 4/18/2008 at 09:36:59, a magnitude 5.2 (5.2 MW, Depth: 8.9 mi) earthquake occurred 212.4 miles away from the city center On 6/28/2004 at 06:10:52, a magnitude 4.2 (4.2 MW, Depth: 6.2 mi, Class: Light, Intensity: IV - V) earthquake occurred 62.7 miles away from the city center On 6/18/2002 at 17:37:15, a magnitude 5.0 (4.3 MB, 4.6 MW, 5.0 LG) earthquake occurred 244.3 miles away from the city center On 4/18/2008 at 15:14:16, a magnitude 4.8 (4.5 MB, 4.8 MW, 4.6 MW) earthquake occurred 210.6 miles away from the city center Magnitude types: regional Lg-wave magnitude (LG), body-wave magnitude (MB), surface-wave magnitude (MS), moment magnitude (MW)
Natural disasters:
The number of natural disasters in Cook County (20) is greater than the US average (15). Major Disasters (Presidential) Declared: 15 Emergencies Declared: 4
Causes of natural disasters: Floods: 13, Storms: 12, Tornadoes: 3, Snowstorms: 2, Winter Storms: 2, Blizzard: 1, Hurricane: 1, Snow: 1, Wind: 1, Other: 1 (Note: some incidents may be assigned to more than one category).
Hospitals and medical centers in Olympia Fields:
FRANCISCAN ST JAMES HEALTH (Proprietary, 20201 S CRAWFORD AVENUE)
FMC - SOUTH SUBURBAN (2609 W LINCOLN HWY)
ADDUS HEALTHCARE (20280 GOVERNORS HIGHWAY)
GATEWAY HEALTH SYSTEMS, INC (2555 WEST LINCOLN HIGHWAY, SUITE 209)
HEALING TO HEAL ANOTHER HOME HEALTHCARE, INC (19900 GOVERNORS DRIVE, STE 101)
Churches in Olympia Fields include: Temple Anshe Sholom (A), Central Baptist Church (B), Olympia Fields United Methodist Church (C), Assumption Greek Orthodox Church (D). Display/hide their locations on the map
Parks in Olympia Fields include: Arcadia Park (1), Spirit Trail Park (2), Tolentine Park (3), Bicentennial Park (4), Sergeant Means Park (5). Display/hide their locations on the map
Birthplace of: Toi Hutchinson - Politician, Jimmie Miles - College basketball player (Valparaiso Crusaders).
Cook County has a predicted average indoor radon screening level between 2 and 4 pCi/L (pico curies per liter) - Moderate Potential
Average household size:
This village:
2.5 people
Illinois:
2.6 people
Percentage of family households:
This village:
70.4%
Whole state:
65.8%
Percentage of households with unmarried partners:
This village:
3.3%
Whole state:
6.3%
Likely homosexual households (counted as self-reported same-sex unmarried-partner households)
Lesbian couples: 0.5% of all households
Gay men: 0.3% of all households
38 people in emergency and transitional shelters (with sleeping facilities) for people experiencing homelessness in 2010
16 people in other noninstitutional facilities in 2010
40 people in nursing homes in 2000
20 people in religious group quarters in 2000
Banks with branches in Olympia Fields (2011 data):
RBS Citizens, National Association: Western Avenue Facility at 20900 South Western Avenue, branch established on 1988/03/03; Olympia Fields Facility at 19950 Governors Highway, branch established on 1975/12/29. Info updated 2007/09/19: Bank assets: $106,940.6 mil, Deposits: $75,690.2 mil, headquarters in Providence, RI, positive income, 1135 total offices, Holding Company: Uk Financial Investments Limited
JPMorgan Chase Bank, National Association: Olympia Fields - Olympia Corners Bra at 2428 W Lincoln Hwy, Suite 3, branch established on 2003/08/25; Olympia Fields Branch at 3302 Vollmer Rd, branch established on 2005/12/06. Info updated 2011/11/10: Bank assets: $1,811,678.0 mil, Deposits: $1,190,738.0 mil, headquarters in Columbus, OH, positive income, International Specialization, 5577 total offices, Holding Company: Jpmorgan Chase & Co.
Fifth Third Bank: Olympia Fields Branch at 2440 Lincoln Hwy, branch established on 2007/12/10. Info updated 2009/10/05: Bank assets: $114,540.4 mil, Deposits: $89,689.1 mil, headquarters in Cincinnati, OH, positive income, Commercial Lending Specialization, 1378 total offices, Holding Company: Fifth Third Bancorp
BankFinancial, FSB: Bankfinancial, Fsb at 21110 South Western Avenue, branch established on 1924/01/01. Info updated 2011/07/21: Bank assets: $1,586.4 mil, Deposits: $1,355.4 mil, local headquarters, negative income in the last year, Commercial Lending Specialization, 23 total offices
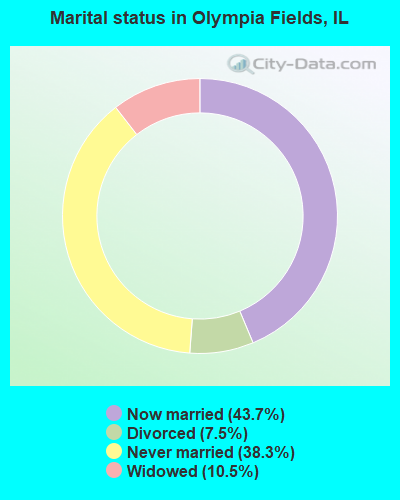
For population 15 years and over in Olympia Fields:
Never married: 38.3%
Now married: 43.7%
Separated: 0.0%
Widowed: 10.5%
Divorced: 7.5%
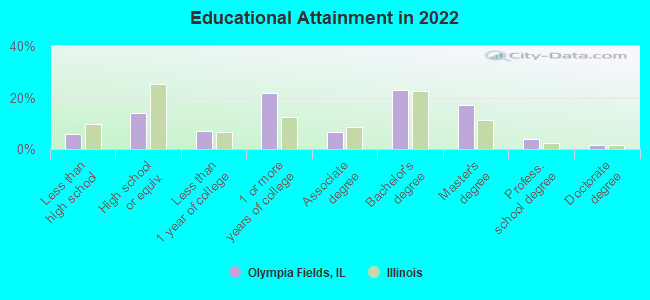
For population 25 years and over in Olympia Fields:
Religion statistics for Olympia Fields, IL (based on Cook County data)
Religion
Adherents
Congregations
Catholic
1,947,223
376
Evangelical Protestant
432,975
1,484
Other
312,636
403
Mainline Protestant
202,114
630
Black Protestant
148,895
395
Orthodox
53,276
66
None
2,097,556
-
Source: Clifford Grammich, Kirk Hadaway, Richard Houseal, Dale E.Jones, Alexei Krindatch, Richie Stanley and Richard H.Taylor. 2012. 2010 U.S.Religion Census: Religious Congregations & Membership Study. Association of Statisticians of American Religious Bodies. Jones, Dale E., et al. 2002. Congregations and Membership in the United States 2000. Nashville, TN: Glenmary Research Center. Graphs represent county-level data
Aircraft: CESSNA T210L (Category: Land, Seats: 6, Weight: Up to 12,499 Pounds, Speed: 141 mph), Engine: CONT MOTOR TSIO-520 SER (300 HP) (Reciprocating) N-Number: 5314V, N5314V, N-5314V, Serial Number: 21060905, Year manufactured: 1975, Certificate Issue Date: 12/09/1985 Registrant (Individual): Sterling M Burke, 20185 Augusta Dr, Olympia Fields, IL 60461
Aircraft: CESSNA P337H (Category: Land, Engines: 2, Seats: 6, Weight: Up to 12,499 Pounds), Engine: Reciprocating N-Number: 6ML, N6ML, N-6ML, Serial Number: P3370351, Airworthiness Date: 03/31/1980, Certificate Issue Date: 06/30/2005 Registrant (Individual): Sterling M Burke, 20185 Augusta Dr, Olympia Fields, IL 60461
Home Mortgage Disclosure Act Aggregated Statistics For Year 2009 (Based on 1 full and 2 partial tracts)
A) FHA, FSA/RHS & VA Home Purchase Loans
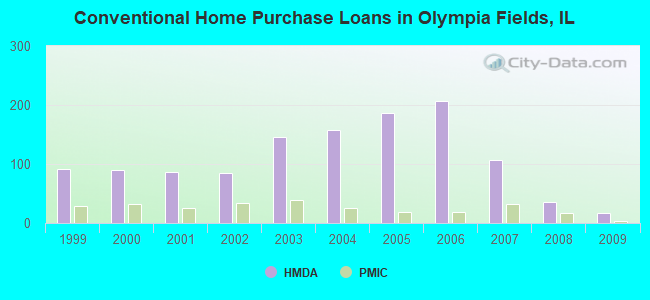
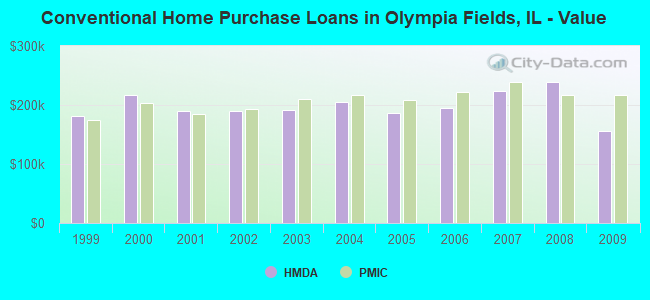
B) Conventional Home Purchase Loans
C) Refinancings
D) Home Improvement Loans
F) Non-occupant Loans on < 5 Family Dwellings (A B C & D)
Number
Average Value
Number
Average Value
Number
Average Value
Number
Average Value
Number
Average Value
LOANS ORIGINATED
38
$197,932
17
$155,612
103
$217,293
4
$115,662
6
$148,065
APPLICATIONS APPROVED, NOT ACCEPTED
3
$178,617
2
$87,690
17
$200,652
0
$0
0
$0
APPLICATIONS DENIED
16
$233,429
5
$173,744
69
$244,313
11
$30,609
2
$46,550
APPLICATIONS WITHDRAWN
10
$168,839
4
$120,040
24
$244,557
1
$103,370
2
$178,090
FILES CLOSED FOR INCOMPLETENESS
5
$171,270
2
$360,375
16
$241,861
1
$11,700
1
$39,240
Aggregated Statistics For Year 2008 (Based on 1 full and 2 partial tracts)
A) FHA, FSA/RHS & VA Home Purchase Loans
B) Conventional Home Purchase Loans
C) Refinancings
D) Home Improvement Loans
E) Loans on Dwellings For 5+ Families
F) Non-occupant Loans on < 5 Family Dwellings (A B C & D)
Number
Average Value
Number
Average Value
Number
Average Value
Number
Average Value
Number
Average Value
Number
Average Value
LOANS ORIGINATED
23
$222,329
35
$238,671
100
$226,622
6
$82,743
1
$504,640
9
$143,147
APPLICATIONS APPROVED, NOT ACCEPTED
6
$254,367
5
$248,596
19
$254,487
2
$40,815
0
$0
2
$171,980
APPLICATIONS DENIED
14
$228,838
23
$275,739
124
$265,857
15
$54,275
0
$0
6
$164,668
APPLICATIONS WITHDRAWN
6
$279,537
6
$211,917
33
$261,250
1
$246,020
0
$0
1
$200,220
FILES CLOSED FOR INCOMPLETENESS
1
$460,600
4
$250,028
20
$319,214
2
$92,500
0
$0
1
$185,460
Aggregated Statistics For Year 2007 (Based on 1 full and 2 partial tracts)
A) FHA, FSA/RHS & VA Home Purchase Loans
B) Conventional Home Purchase Loans
C) Refinancings
D) Home Improvement Loans
F) Non-occupant Loans on < 5 Family Dwellings (A B C & D)
Number
Average Value
Number
Average Value
Number
Average Value
Number
Average Value
Number
Average Value
LOANS ORIGINATED
5
$192,512
106
$223,659
150
$230,461
21
$93,955
14
$185,053
APPLICATIONS APPROVED, NOT ACCEPTED
0
$0
25
$224,623
37
$242,688
6
$63,340
3
$195,820
APPLICATIONS DENIED
3
$207,667
83
$252,576
173
$280,746
27
$114,068
17
$219,432
APPLICATIONS WITHDRAWN
1
$307,320
10
$189,671
55
$251,789
4
$110,778
3
$167,510
FILES CLOSED FOR INCOMPLETENESS
0
$0
11
$282,431
37
$302,330
0
$0
2
$175,180
Aggregated Statistics For Year 2006 (Based on 1 full and 2 partial tracts)
A) FHA, FSA/RHS & VA Home Purchase Loans
B) Conventional Home Purchase Loans
C) Refinancings
D) Home Improvement Loans
F) Non-occupant Loans on < 5 Family Dwellings (A B C & D)
Number
Average Value
Number
Average Value
Number
Average Value
Number
Average Value
Number
Average Value
LOANS ORIGINATED
4
$236,198
206
$195,750
208
$224,934
27
$101,763
13
$173,316
APPLICATIONS APPROVED, NOT ACCEPTED
0
$0
53
$188,282
66
$243,510
8
$119,746
6
$144,240
APPLICATIONS DENIED
1
$172,570
131
$231,214
167
$249,762
22
$102,410
13
$205,495
APPLICATIONS WITHDRAWN
0
$0
38
$211,356
73
$232,623
2
$149,870
4
$120,662
FILES CLOSED FOR INCOMPLETENESS
0
$0
16
$214,473
29
$223,363
0
$0
3
$214,503
Aggregated Statistics For Year 2005 (Based on 1 full and 2 partial tracts)
A) FHA, FSA/RHS & VA Home Purchase Loans
B) Conventional Home Purchase Loans
C) Refinancings
D) Home Improvement Loans
E) Loans on Dwellings For 5+ Families
F) Non-occupant Loans on < 5 Family Dwellings (A B C & D)
G) Loans On Manufactured Home Dwelling (A B C & D)
Number
Average Value
Number
Average Value
Number
Average Value
Number
Average Value
Number
Average Value
Number
Average Value
Number
Average Value
LOANS ORIGINATED
8
$226,154
187
$187,109
190
$214,259
18
$107,659
3
$603,557
17
$168,942
0
$0
APPLICATIONS APPROVED, NOT ACCEPTED
0
$0
47
$211,919
47
$246,215
8
$115,842
0
$0
8
$197,968
0
$0
APPLICATIONS DENIED
2
$265,670
80
$209,595
171
$232,741
19
$78,735
0
$0
13
$236,653
1
$103,630
APPLICATIONS WITHDRAWN
2
$140,190
44
$206,452
70
$257,801
6
$218,583
0
$0
8
$179,835
0
$0
FILES CLOSED FOR INCOMPLETENESS
0
$0
10
$161,705
45
$245,361
1
$36,030
0
$0
2
$271,890
0
$0
Aggregated Statistics For Year 2004 (Based on 1 full and 2 partial tracts)
A) FHA, FSA/RHS & VA Home Purchase Loans
B) Conventional Home Purchase Loans
C) Refinancings
D) Home Improvement Loans
E) Loans on Dwellings For 5+ Families
F) Non-occupant Loans on < 5 Family Dwellings (A B C & D)
Number
Average Value
Number
Average Value
Number
Average Value
Number
Average Value
Number
Average Value
Number
Average Value
LOANS ORIGINATED
8
$154,354
158
$205,876
236
$197,563
21
$73,729
2
$41,289,265
10
$140,203
APPLICATIONS APPROVED, NOT ACCEPTED
0
$0
60
$231,260
46
$210,716
4
$30,242
0
$0
8
$161,969
APPLICATIONS DENIED
1
$187,060
76
$214,999
164
$236,393
20
$59,646
0
$0
12
$149,777
APPLICATIONS WITHDRAWN
1
$131,940
32
$226,066
85
$247,642
3
$163,950
0
$0
3
$225,903
FILES CLOSED FOR INCOMPLETENESS
0
$0
8
$206,849
42
$263,820
1
$32,180
0
$0
0
$0
Aggregated Statistics For Year 2003 (Based on 1 full and 2 partial tracts)
A) FHA, FSA/RHS & VA Home Purchase Loans
B) Conventional Home Purchase Loans
C) Refinancings
D) Home Improvement Loans
E) Loans on Dwellings For 5+ Families
F) Non-occupant Loans on < 5 Family Dwellings (A B C & D)
Number
Average Value
Number
Average Value
Number
Average Value
Number
Average Value
Number
Average Value
Number
Average Value
LOANS ORIGINATED
16
$174,848
146
$191,071
388
$177,318
16
$121,052
1
$382,390
10
$132,356
APPLICATIONS APPROVED, NOT ACCEPTED
3
$125,907
36
$175,571
67
$180,481
2
$53,690
0
$0
4
$105,328
APPLICATIONS DENIED
4
$181,305
48
$207,717
179
$206,288
9
$22,743
0
$0
9
$155,321
APPLICATIONS WITHDRAWN
2
$217,800
23
$231,570
78
$211,832
4
$35,145
0
$0
1
$211,560
FILES CLOSED FOR INCOMPLETENESS
1
$113,160
6
$149,492
20
$200,986
2
$25,000
0
$0
0
$0
Aggregated Statistics For Year 2002 (Based on 1 full and 2 partial tracts)
A) FHA, FSA/RHS & VA Home Purchase Loans
B) Conventional Home Purchase Loans
C) Refinancings
D) Home Improvement Loans
F) Non-occupant Loans on < 5 Family Dwellings (A B C & D)
Number
Average Value
Number
Average Value
Number
Average Value
Number
Average Value
Number
Average Value
LOANS ORIGINATED
20
$162,176
85
$189,177
258
$184,356
15
$24,579
5
$77,356
APPLICATIONS APPROVED, NOT ACCEPTED
1
$264,660
17
$198,910
56
$204,057
2
$27,595
0
$0
APPLICATIONS DENIED
4
$221,668
44
$214,254
104
$220,681
17
$17,961
4
$110,125
APPLICATIONS WITHDRAWN
4
$165,670
22
$169,625
56
$188,450
8
$42,695
2
$81,500
FILES CLOSED FOR INCOMPLETENESS
1
$214,850
9
$173,721
36
$196,677
0
$0
0
$0
Aggregated Statistics For Year 2001 (Based on 1 full and 2 partial tracts)
A) FHA, FSA/RHS & VA Home Purchase Loans
B) Conventional Home Purchase Loans
C) Refinancings
D) Home Improvement Loans
F) Non-occupant Loans on < 5 Family Dwellings (A B C & D)
Number
Average Value
Number
Average Value
Number
Average Value
Number
Average Value
Number
Average Value
LOANS ORIGINATED
30
$157,995
86
$189,682
181
$167,077
12
$31,228
3
$140,453
APPLICATIONS APPROVED, NOT ACCEPTED
1
$123,050
12
$173,729
36
$142,290
5
$23,636
1
$109,070
APPLICATIONS DENIED
3
$183,457
42
$212,860
134
$181,856
16
$21,287
3
$187,003
APPLICATIONS WITHDRAWN
2
$134,190
18
$160,527
46
$212,748
6
$48,740
1
$118,050
FILES CLOSED FOR INCOMPLETENESS
0
$0
6
$158,205
21
$225,949
0
$0
0
$0
Aggregated Statistics For Year 2000 (Based on 1 full and 2 partial tracts)
A) FHA, FSA/RHS & VA Home Purchase Loans
B) Conventional Home Purchase Loans
C) Refinancings
D) Home Improvement Loans
E) Loans on Dwellings For 5+ Families
F) Non-occupant Loans on < 5 Family Dwellings (A B C & D)
Number
Average Value
Number
Average Value
Number
Average Value
Number
Average Value
Number
Average Value
Number
Average Value
LOANS ORIGINATED
18
$141,640
89
$217,037
66
$167,688
19
$75,373
2
$76,160
7
$191,496
APPLICATIONS APPROVED, NOT ACCEPTED
2
$101,130
24
$196,267
16
$133,701
5
$27,702
0
$0
0
$0
APPLICATIONS DENIED
3
$121,270
44
$215,508
91
$192,747
17
$26,763
0
$0
1
$20,170
APPLICATIONS WITHDRAWN
2
$167,665
21
$230,181
38
$174,141
8
$57,449
0
$0
0
$0
FILES CLOSED FOR INCOMPLETENESS
0
$0
16
$196,014
25
$251,104
0
$0
0
$0
3
$170,637
Aggregated Statistics For Year 1999 (Based on 1 full and 2 partial tracts)
A) FHA, FSA/RHS & VA Home Purchase Loans
B) Conventional Home Purchase Loans
C) Refinancings
D) Home Improvement Loans
E) Loans on Dwellings For 5+ Families
F) Non-occupant Loans on < 5 Family Dwellings (A B C & D)
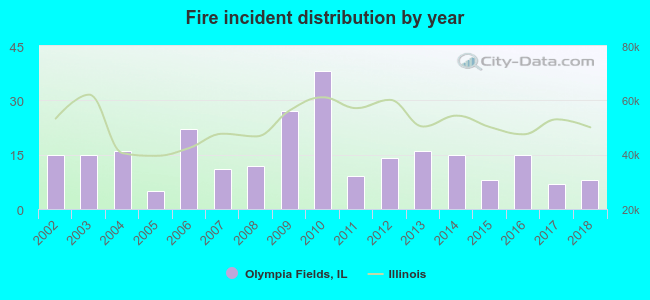
2002 - 2018 National Fire Incident Reporting System (NFIRS) incidents
According to the data from the years 2002 - 2018 the average number of fire incidents per year is 15. The highest number of fires - 38 took place in 2010, and the least - 5 in 2005. The data has a dropping trend.
When looking into fire subcategories, the most reports belonged to: Structure Fires (60.1%), and Outside Fires (20.6%).
Fire incident types reported to NFIRS in Olympia Fields, IL
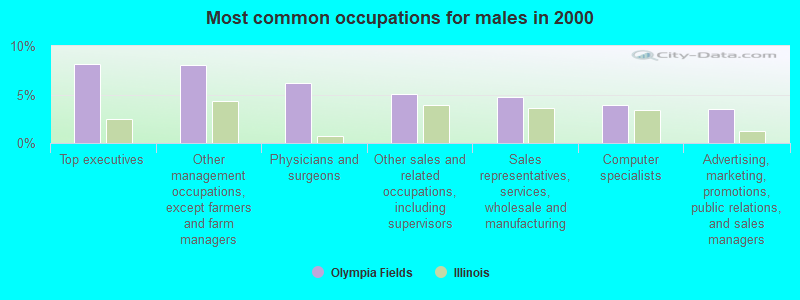
#39 on the list of "Top 101 cities with largest percentage of males in occupations: health diagnosing and treating practitioners and other technical occupations (population 5,000+)"
#43 on the list of "Top 101 cities with largest percentage of males in occupations: architecture and engineering occupations (population 5,000+)"
#48 on the list of "Top 101 cities with the most people taking railroad to work (population 5,000+)"
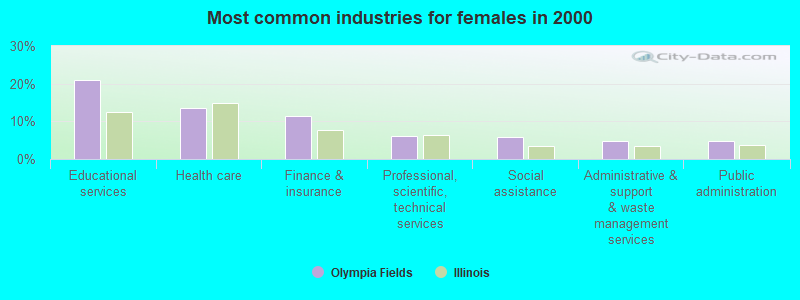
#95 on the list of "Top 101 cities with largest percentage of males in industries: health care and social assistance (population 5,000+)"
#99 on the list of "Top 101 cities with the highest number of police officers per 1000 residents (population 5,000+)"
#1 on the list of "Top 101 counties with the most Black Protestant congregations"
#1 on the list of "Top 101 counties with the most Catholic congregations"
#1 on the list of "Top 101 counties with the highest surface withdrawal of fresh water for public supply"
#2 on the list of "Top 101 counties with the most Black Protestant adherents"
#2 on the list of "Top 101 counties with the most Orthodox congregations (pop. 50,000+)"


 Recent articles from our blog. Our writers, many of them Ph.D. graduates or candidates, create easy-to-read articles on a wide variety of topics.

 (10.6 miles
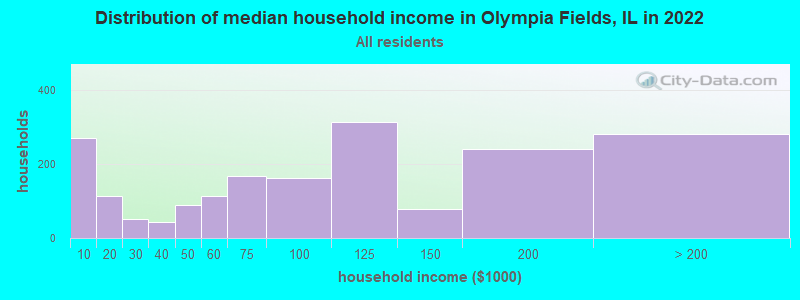


 According to the data from the years 2002 - 2018 the average number of fire incidents per year is 15. The highest number of fires - 38 took place in 2010, and the least - 5 in 2005. The data has a dropping trend.
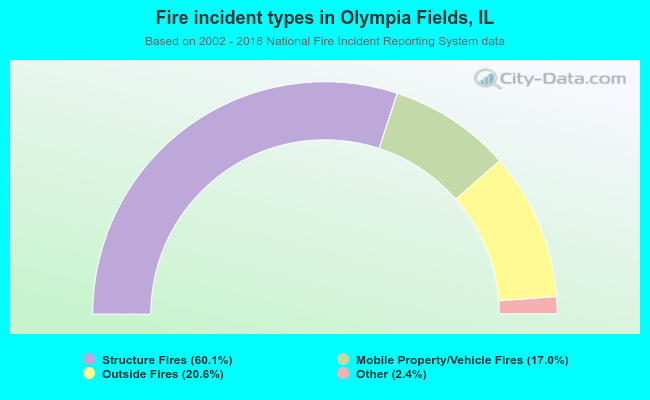 When looking into fire subcategories, the most reports belonged to: Structure Fires (60.1%), and Outside Fires (20.6%).