Johnsburg, Illinois
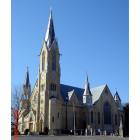
Johnsburg: Historic St. John the Baptist Catholic Church, Johnsburg, Illinois
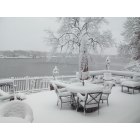
Johnsburg: Overlooking Pistakee Bay
Johnsburg: Boat House on Pistakee Bay
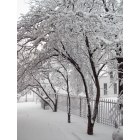
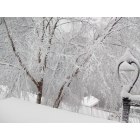
Johnsburg: Spring Weather in Johnsburg
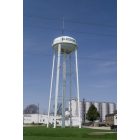
Johnsburg: Johnsburg water tower
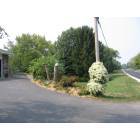
Johnsburg: Late Summer Bloom
- add
your
Submit your own pictures of this village and show them to the world
- OSM Map
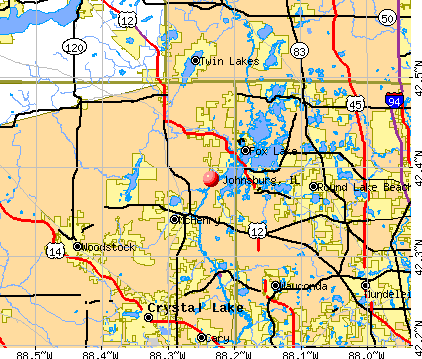
- General Map
- Google Map
- MSN Map
Population change since 2000: +18.0%
 |
| Males: 3,121 | |
| Females: 3,240 |
| Median resident age: | 41.0 years |
| Illinois median age: | 39.1 years |
Zip codes: 60050.
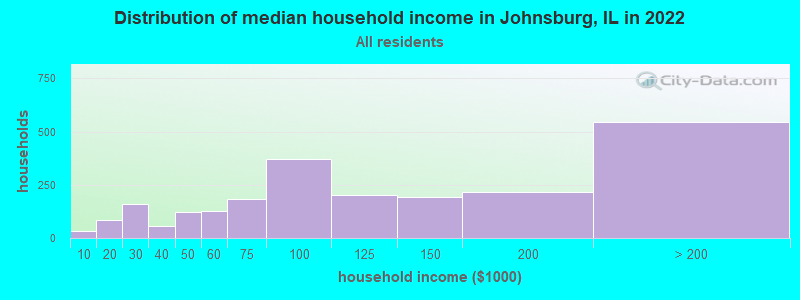
| Johnsburg: | $108,688 |
| IL: | $76,708 |
Estimated per capita income in 2022: $44,257 (it was $27,582 in 2000)
Johnsburg village income, earnings, and wages data
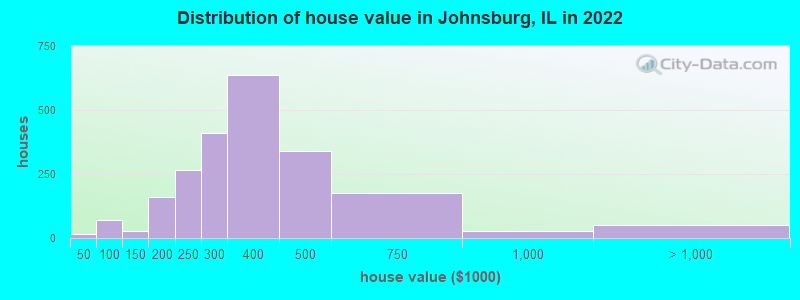
Estimated median house or condo value in 2022: $321,143 (it was $189,100 in 2000)
| Johnsburg: | $321,143 |
| IL: | $251,600 |
Mean prices in 2022: all housing units: $294,221; detached houses: $311,267; townhouses or other attached units: $212,657; in 2-unit structures: $217,098; in 3-to-4-unit structures: $160,017; in 5-or-more-unit structures: $112,491; mobile homes: $106,276; occupied boats, rvs, vans, etc.: $87,058
Median gross rent in 2022: $1,517.
(11.9% for White Non-Hispanic residents, 18.1% for Hispanic or Latino residents, 35.0% for two or more races residents)
Detailed information about poverty and poor residents in Johnsburg, IL


Compare current foreclosures near Johnsburg, IL:
| Photo | Address | Area | Beds / Baths | Price | Details |
|---|---|---|---|---|---|

|
#1
Clover Ct
Round Lake, IL 60073
|
1,682 sq. feet
|
1 baths 3 beds |
$273,000
|
show details |

|
#2
Sunshine Ln
Woodstock, IL 60098
|
2,054 sq. feet
|
2 baths 5 beds |
$217,000
|
show details |

|
#3
W Lake Shore Dr
Spring Grove, IL 60081
|
1,023 sq. feet
|
1 baths 2 beds |
$110,250
|
show details |

|
#4
359th Ave
Twin Lakes, WI 53181
|
1,053 sq. feet
|
1 baths 2 beds |
$212,000
|
show details |

|
#5
Clover Ln
Round Lake, IL 60073
|
- sq. feet
|
2 baths 3 beds |
$130,000
|
show details |

|
#6
Fieldbrook Dr
Wauconda, IL 60084
|
2,286 sq. feet
|
3 baths 3 beds |
show details | |

|
#7
N Old Lake Ave
Antioch, IL 60002
|
2,904 sq. feet
|
2 baths 3 beds |
show details | |

|
#8
N Park Ave
Lake Villa, IL 60046
|
1,184 sq. feet
|
1 baths 3 beds |
show details | |

|
#9
Pleasant St
Woodstock, IL 60098
|
856 sq. feet
|
1 baths 3 beds |
show details | |

|
#10
W Homestead Trl
Crystal Lake, IL 60012
|
4,397 sq. feet
|
3 baths 4 beds |
show details |
| Photo | Address | Area | Beds / Baths | Price | Details |
|---|---|---|---|---|---|

|
#11
Ojibwa Trl
Round Lake, IL 60073
|
1,683 sq. feet
|
2 baths 2 beds |
show details | |

|
#12
W Engle Dr
Lake Villa, IL 60046
|
1,456 sq. feet
|
1 baths 3 beds |
show details | |

|
#13
Wildwood Dr
Mchenry, IL 60051
|
1,340 sq. feet
|
3 baths 2 beds |
show details | |

|
#14
Cameron Dr
Antioch, IL 60002
|
2,427 sq. feet
|
2 baths 4 beds |
show details | |

|
#15
Woodside Ct
Grayslake, IL 60030
|
3,078 sq. feet
|
2 baths 4 beds |
show details | |

|
#16
Hillside Ave
Antioch, IL 60002
|
2,448 sq. feet
|
3 baths 5 beds |
show details | |

|
#17
101st St
Bristol, WI 53104
|
- sq. feet
|
1 baths 4 beds |
show details | |

|
#18
Hillsboro Ln
Lake In The Hills, IL 60156
|
2,196 sq. feet
|
2 baths 4 beds |
show details | |

|
#19
W Westshore Dr
Mchenry, IL 60050
|
1,562 sq. feet
|
1 baths 1 beds |
show details | |

|
#20
Meadow Hill Ln
Round Lake, IL 60073
|
1,176 sq. feet
|
2 baths 3 beds |
show details |
| Photo | Address | Area | Beds / Baths | Price | Details |
|---|---|---|---|---|---|

|
#21
Harbor Rd
Wonder Lake, IL 60097
|
2,100 sq. feet
|
2 baths 4 beds |
show details | |

|
#22
W Kinley Blvd
Mchenry, IL 60050
|
1,068 sq. feet
|
3 baths 3 beds |
show details | |

|
#23
Romin Rd
Lake Geneva, WI 53147
|
1,450 sq. feet
|
1 baths 3 beds |
show details | |

|
#24
N Hidden Trl
Spring Grove, IL 60081
|
2,463 sq. feet
|
2 baths 3 beds |
show details | |

|
#25
Jester Ln
Algonquin, IL 60102
|
1,299 sq. feet
|
2 baths 4 beds |
show details | |

|
#26
Lindy St
Ingleside, IL 60041
|
1,926 sq. feet
|
2 baths 3 beds |
show details | |

|
#27
Sarazen Dr
Vernon Hills, IL 60061
|
3,576 sq. feet
|
2 baths 4 beds |
show details | |

|
#28
Brookwood Trl
Mchenry, IL 60050
|
1,140 sq. feet
|
3 baths 3 beds |
show details | |

|
#29
Fernwood Ln
Algonquin, IL 60102
|
5,776 sq. feet
|
5 baths 5 beds |
show details | |

|
#30
Lippincott Rd
Fox Lake, IL 60020
|
1,247 sq. feet
|
1 baths 3 beds |
show details |
| Photo | Address | Area | Beds / Baths | Price | Details |
|---|---|---|---|---|---|

|
#31
Barharbor Dr
Lake In The Hills, IL 60156
|
1,998 sq. feet
|
2 baths 4 beds |
show details | |

|
#32
W Meadowview Dr
Round Lake, IL 60073
|
2,756 sq. feet
|
2 baths 4 beds |
show details | |

|
#33
Sussex Dr
Mchenry, IL 60050
|
1,110 sq. feet
|
2 baths 2 beds |
show details | |

|
#34
Partridge Ct
Algonquin, IL 60102
|
1,400 sq. feet
|
2 baths 2 beds |
show details | |

|
#35
Cherokee Dr
Round Lake, IL 60073
|
1,136 sq. feet
|
2 baths 4 beds |
show details | |

|
#36
Mallard Pt
Island Lake, IL 60042
|
2,496 sq. feet
|
3 baths 4 beds |
show details | |

|
#37
N Gilmer Rd
Mundelein, IL 60060
|
1,908 sq. feet
|
2 baths 4 beds |
show details | |

|
#38
S Sheridan Rd
Mchenry, IL 60051
|
999 sq. feet
|
1 baths 2 beds |
show details | |

|
#39
Fairway Cir
Barrington, IL 60010
|
1,610 sq. feet
|
2 baths 3 beds |
show details | |

|
#40
Sunnyside Dr
Mchenry, IL 60051
|
508 sq. feet
|
1 baths 1 beds |
show details |
| Photo | Address | Area | Beds / Baths | Price | Details |
|---|---|---|---|---|---|

|
#41
Timber Lake Dr
Antioch, IL 60002
|
3,473 sq. feet
|
3 baths 5 beds |
show details | |

|
#42
Tall Oaks Dr
Antioch, IL 60002
|
2,160 sq. feet
|
2 baths 3 beds |
show details | |

|
#43
Old Barn Rd
Barrington, IL 60010
|
2,371 sq. feet
|
5 baths 4 beds |
show details | |

|
#44
Tappan St
Woodstock, IL 60098
|
925 sq. feet
|
1 baths 3 beds |
show details | |

|
#45
Old Elm Rd
Lake Villa, IL 60046
|
1,052 sq. feet
|
2 baths 3 beds |
show details | |

|
#46
Sprucewood Ln
Lake Villa, IL 60046
|
1,291 sq. feet
|
1 baths 3 beds |
show details | |

|
#47
Blakely St
Woodstock, IL 60098
|
1,008 sq. feet
|
1 baths 3 beds |
show details | |

|
#48
Crossland Dr
Grayslake, IL 60030
|
1,562 sq. feet
|
1 baths 3 beds |
show details | |

|
#49
N Algonquin Dr
Grayslake, IL 60030
|
1,440 sq. feet
|
1 baths 3 beds |
show details | |

|
Check over 1 million property listings on Foreclosure.com!
|
browse all offers | |||


- 5,67288.6%White alone
- 4246.6%Hispanic
- 1412.2%Two or more races
- 841.3%Asian alone
- 490.8%Other race alone
- 90.1%Black alone
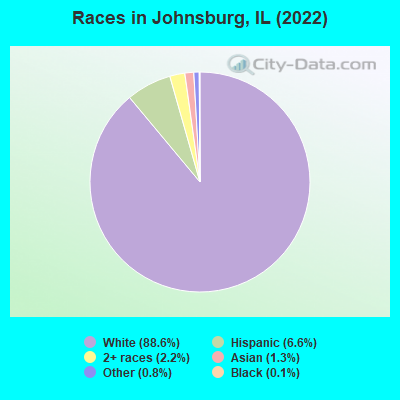
Races in Johnsburg detailed stats: ancestries, foreign born residents, place of birth
According to our research of Illinois and other state lists, there were 2 registered sex offenders living in Johnsburg, Illinois as of May 19, 2024.
The ratio of all residents to sex offenders in Johnsburg is 3,130 to 1.
The ratio of registered sex offenders to all residents in this city is much lower than the state average.
Type |
2009 |
2010 |
2011 |
2012 |
2014 |
2015 |
2016 |
2017 |
2018 |
2019 |
2021 |
2022 |
|---|---|---|---|---|---|---|---|---|---|---|---|---|
| Murders (per 100,000) | 0 (0.0) | 0 (0.0) | 0 (0.0) | 0 (0.0) | 0 (0.0) | 0 (0.0) | 0 (0.0) | 0 (0.0) | 0 (0.0) | 0 (0.0) | 0 (0.0) | 0 (0.0) |
| Rapes (per 100,000) | 0 (0.0) | 0 (0.0) | 2 (31.5) | 1 (15.8) | 1 (15.9) | 2 (31.8) | 3 (47.6) | 0 (0.0) | 2 (31.7) | 2 (31.7) | 1 (15.9) | 0 (0.0) |
| Robberies (per 100,000) | 0 (0.0) | 0 (0.0) | 0 (0.0) | 0 (0.0) | 1 (15.9) | 1 (15.9) | 0 (0.0) | 0 (0.0) | 0 (0.0) | 0 (0.0) | 0 (0.0) | 0 (0.0) |
| Assaults (per 100,000) | 6 (87.0) | 1 (15.8) | 0 (0.0) | 0 (0.0) | 2 (31.8) | 4 (63.6) | 1 (15.9) | 3 (48.0) | 0 (0.0) | 0 (0.0) | 0 (0.0) | 6 (93.8) |
| Burglaries (per 100,000) | 20 (290.1) | 18 (284.0) | 16 (251.7) | 5 (78.8) | 8 (127.1) | 9 (143.2) | 0 (0.0) | 8 (128.0) | 5 (79.2) | 4 (63.3) | 0 (0.0) | 0 (0.0) |
| Thefts (per 100,000) | 81 (1,175) | 108 (1,704) | 125 (1,967) | 10 (157.6) | 110 (1,748) | 130 (2,068) | 126 (1,999) | 115 (1,840) | 102 (1,616) | 29 (459.0) | 64 (1,016) | 54 (844.4) |
| Auto thefts (per 100,000) | 2 (29.0) | 2 (31.6) | 1 (15.7) | 0 (0.0) | 4 (63.6) | 5 (79.6) | 1 (15.9) | 5 (80.0) | 5 (79.2) | 1 (15.8) | 0 (0.0) | 1 (15.6) |
| Arson (per 100,000) | 1 (14.5) | 0 (0.0) | 0 (0.0) | 0 (0.0) | 0 (0.0) | 0 (0.0) | 0 (0.0) | 0 (0.0) | 0 (0.0) | 0 (0.0) | 0 (0.0) | 0 (0.0) |
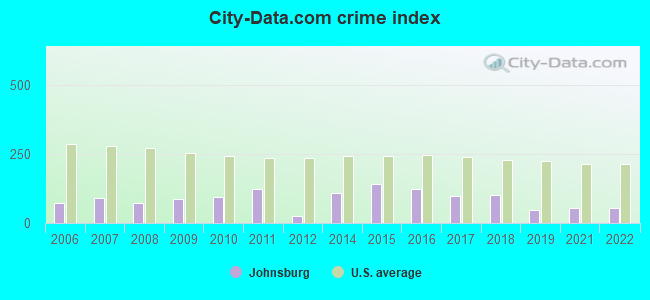
| City-Data.com crime index | 87.0 | 93.7 | 122.7 | 24.4 | 107.7 | 142.1 | 122.5 | 98.5 | 101.9 | 49.4 | 53.4 | 53.8 |
The City-Data.com crime index weighs serious crimes and violent crimes more heavily. Higher means more crime, U.S. average is 246.1. It adjusts for the number of visitors and daily workers commuting into cities.
Crime rate in Johnsburg detailed stats: murders, rapes, robberies, assaults, burglaries, thefts, arson
Full-time law enforcement employees in 2017, including police officers: 13 (11 officers - 9 male; 2 female).
| Officers per 1,000 residents here: | 1.76 |
| Illinois average: | 3.15 |
 Recent articles from our blog. Our writers, many of them Ph.D. graduates or candidates, create easy-to-read articles on a wide variety of topics.

 | Moving to IL - is there any future? (202 replies) |
| Suburbs of Suburbs (32 replies) |
| Antioch, Illinois information (12 replies) |
| Job changing location from Lombard to Wauconda where to move (10 replies) |
| What suburbs do you think are the least mentioned? (46 replies) |
| Nature-filled areas with older homes & young families (23 replies) |
Latest news from Johnsburg, IL collected exclusively by city-data.com from local newspapers, TV, and radio stations
Ancestries: German (37.4%), Polish (10.0%), American (7.3%), Irish (7.3%), Italian (5.1%), European (3.9%).
Current Local Time: CST time zone
Incorporated on 06/29/1956
Elevation: 750 feet
Land area: 5.54 square miles.
Population density: 1,149 people per square mile (low).
135 residents are foreign born (1.3% Asia, 0.8% Europe).
| This village: | 2.1% |
| Illinois: | 14.1% |
Median real estate property taxes paid for housing units with mortgages in 2022: $6,903 (2.2%)
Median real estate property taxes paid for housing units with no mortgage in 2022: $7,615 (2.2%)
Nearest city with pop. 50,000+: Waukegan, IL  (19.2 miles , pop. 87,901).
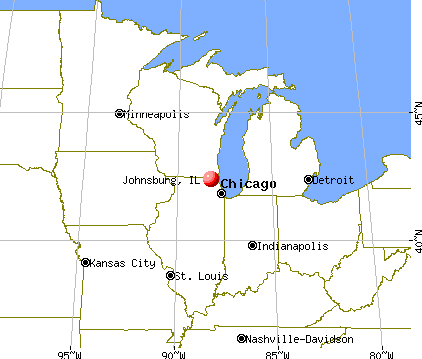
Nearest city with pop. 200,000+: Chicago, IL (47.3 miles , pop. 2,896,016).
Nearest cities:
), ), Latitude: 42.39 N, Longitude: 88.24 W
Daytime population change due to commuting: -775 (-12.1%)
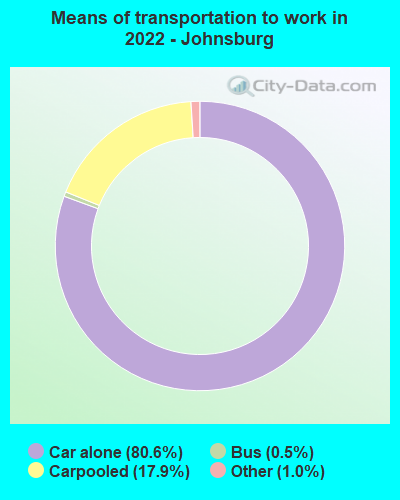
Workers who live and work in this village: 707 (21.8%)

Johnsburg, Illinois accommodation & food services, waste management - Economy and Business Data
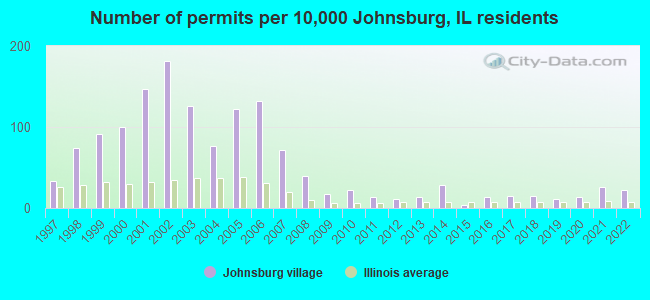
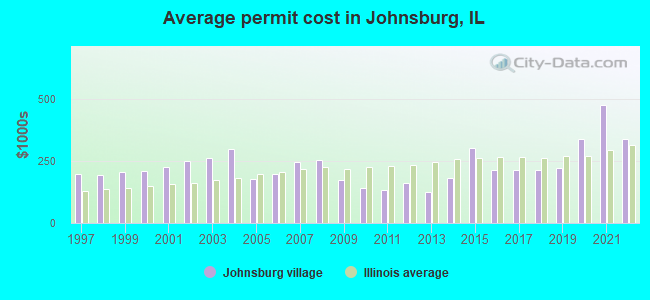
Single-family new house construction building permits:
- 2022: 12 buildings, average cost: $337,800
- 2021: 14 buildings, average cost: $474,800
- 2020: 7 buildings, average cost: $337,900
- 2019: 6 buildings, average cost: $222,400
- 2018: 8 buildings, average cost: $210,700
- 2017: 8 buildings, average cost: $210,700
- 2016: 7 buildings, average cost: $210,700
- 2015: 2 buildings, average cost: $300,000
- 2014: 15 buildings, average cost: $181,200
- 2013: 7 buildings, average cost: $123,300
- 2012: 6 buildings, average cost: $161,100
- 2011: 7 buildings, average cost: $131,400
- 2010: 12 buildings, average cost: $139,200
- 2009: 9 buildings, average cost: $173,900
- 2008: 21 buildings, average cost: $253,600
- 2007: 39 buildings, average cost: $245,500
- 2006: 71 buildings, average cost: $196,100
- 2005: 66 buildings, average cost: $174,700
- 2004: 41 buildings, average cost: $298,200
- 2003: 68 buildings, average cost: $261,100
- 2002: 98 buildings, average cost: $249,000
- 2001: 79 buildings, average cost: $223,400
- 2000: 54 buildings, average cost: $210,200
- 1999: 49 buildings, average cost: $205,300
- 1998: 40 buildings, average cost: $193,700
- 1997: 18 buildings, average cost: $195,100
| Here: | 3.6% |
| Illinois: | 4.2% |
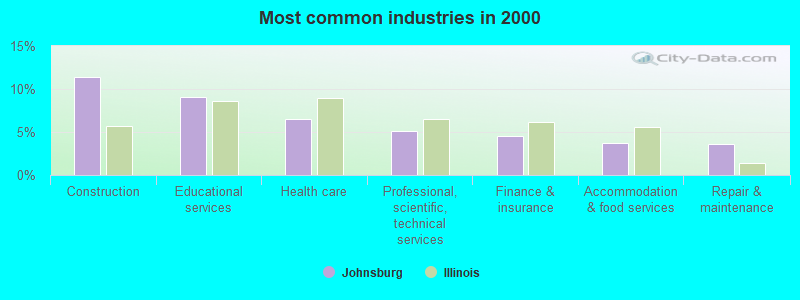
- Construction (11.4%)
- Educational services (9.1%)
- Health care (6.5%)
- Professional, scientific, technical services (5.1%)
- Finance & insurance (4.6%)
- Accommodation & food services (3.8%)
- Repair & maintenance (3.6%)
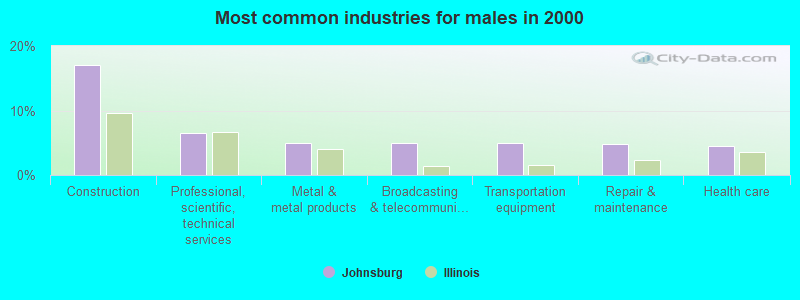
- Construction (17.1%)
- Professional, scientific, technical services (6.6%)
- Metal & metal products (5.0%)
- Broadcasting & telecommunications (4.9%)
- Transportation equipment (4.9%)
- Repair & maintenance (4.8%)
- Health care (4.5%)
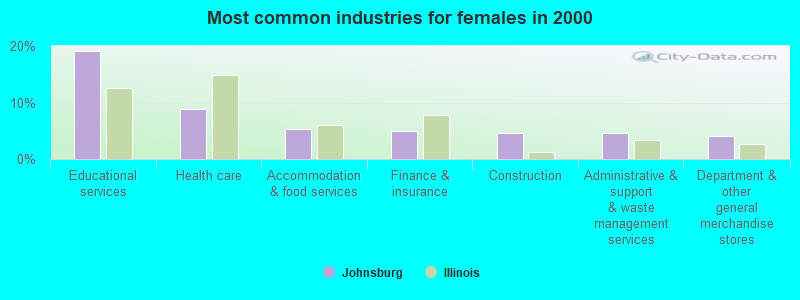
- Educational services (19.2%)
- Health care (8.9%)
- Accommodation & food services (5.4%)
- Finance & insurance (5.0%)
- Construction (4.5%)
- Administrative & support & waste management services (4.5%)
- Department & other general merchandise stores (4.1%)
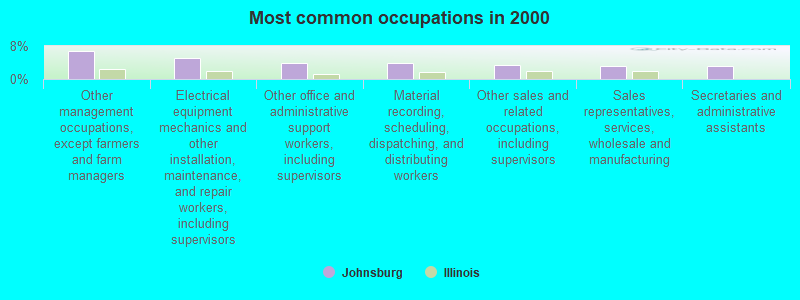
- Other management occupations, except farmers and farm managers (6.8%)
- Electrical equipment mechanics and other installation, maintenance, and repair workers, including supervisors (5.1%)
- Other office and administrative support workers, including supervisors (3.9%)
- Material recording, scheduling, dispatching, and distributing workers (3.9%)
- Other sales and related occupations, including supervisors (3.4%)
- Sales representatives, services, wholesale and manufacturing (3.2%)
- Secretaries and administrative assistants (3.2%)
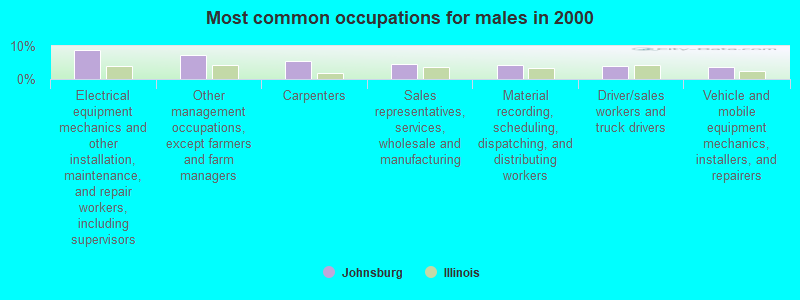
- Electrical equipment mechanics and other installation, maintenance, and repair workers, including supervisors (8.7%)
- Other management occupations, except farmers and farm managers (7.2%)
- Carpenters (5.4%)
- Sales representatives, services, wholesale and manufacturing (4.5%)
- Material recording, scheduling, dispatching, and distributing workers (4.2%)
- Driver/sales workers and truck drivers (3.8%)
- Vehicle and mobile equipment mechanics, installers, and repairers (3.8%)
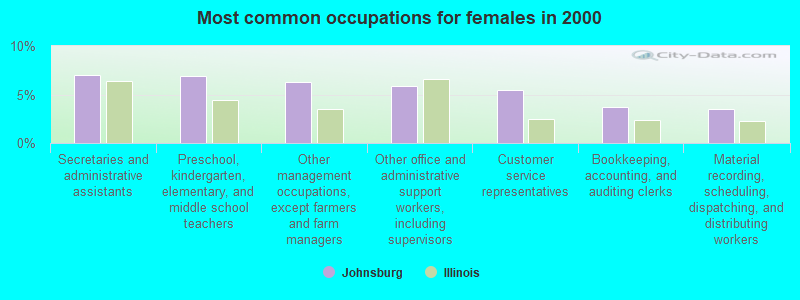
- Secretaries and administrative assistants (7.0%)
- Preschool, kindergarten, elementary, and middle school teachers (6.9%)
- Other management occupations, except farmers and farm managers (6.3%)
- Other office and administrative support workers, including supervisors (5.9%)
- Customer service representatives (5.4%)
- Bookkeeping, accounting, and auditing clerks (3.7%)
- Material recording, scheduling, dispatching, and distributing workers (3.5%)
Average climate in Johnsburg, Illinois
Based on data reported by over 4,000 weather stations


(lower is better)
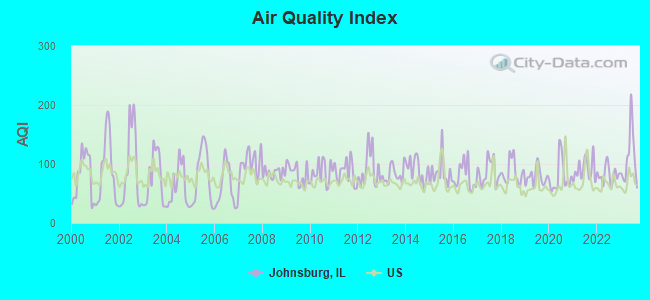
Air Quality Index (AQI) level in 2023 was 109. This is significantly worse than average.
| City: | 109 |
| U.S.: | 73 |
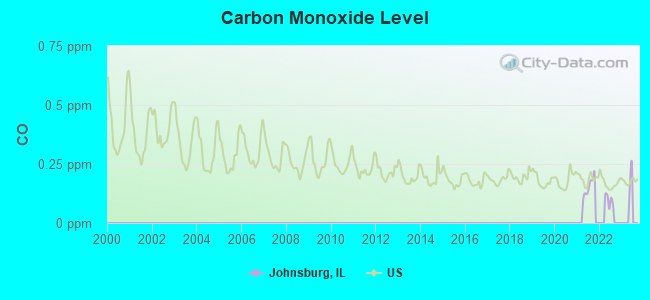
Carbon Monoxide (CO) [ppm] level in 2021 was 0.153. This is significantly better than average. Closest monitor was 23.3 miles away from the city center.
| City: | 0.153 |
| U.S.: | 0.251 |
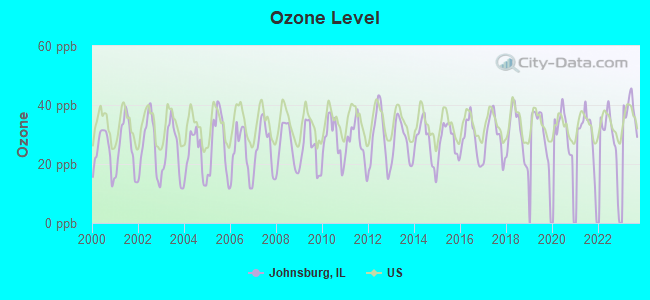
Ozone [ppb] level in 2023 was 38.3. This is about average. Closest monitor was 11.4 miles away from the city center.
| City: | 38.3 |
| U.S.: | 33.3 |
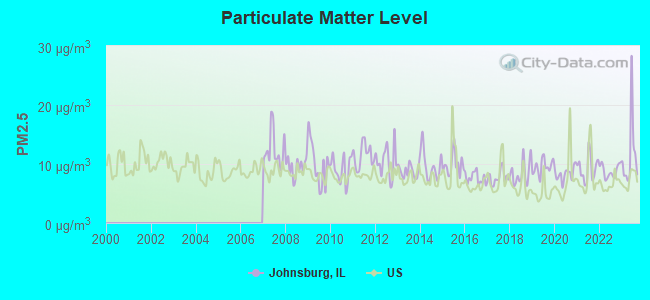
Particulate Matter (PM2.5) [µg/m3] level in 2023 was 11.5. This is significantly worse than average. Closest monitor was 11.4 miles away from the city center.
| City: | 11.5 |
| U.S.: | 8.1 |
Tornado activity:
Johnsburg-area historical tornado activity is slightly below Illinois state average. It is 36% greater than the overall U.S. average.
On 4/11/1965, a category F4 (max. wind speeds 207-260 mph) tornado 7.9 miles away from the Johnsburg village center killed 6 people and injured 75 people.
On 4/21/1967, a category F4 tornado 10.2 miles away from the village center killed 24 people and injured 450 people and caused between $50,000 and $500,000 in damages.
Earthquake activity:
Johnsburg-area historical earthquake activity is significantly above Illinois state average. It is 33% greater than the overall U.S. average.On 4/18/2008 at 09:36:59, a magnitude 5.4 (5.1 MB, 4.8 MS, 5.4 MW, 5.2 MW, Class: Moderate, Intensity: VI - VII) earthquake occurred 272.7 miles away from the city center
On 6/10/1987 at 23:48:54, a magnitude 5.1 (4.9 MB, 4.4 MS, 4.6 MS, 5.1 LG) earthquake occurred 247.3 miles away from the city center
On 6/28/2004 at 06:10:52, a magnitude 4.2 (4.2 MW, Depth: 6.2 mi, Class: Light, Intensity: IV - V) earthquake occurred 72.6 miles away from Johnsburg center
On 4/18/2008 at 09:36:59, a magnitude 5.2 (5.2 MW, Depth: 8.9 mi) earthquake occurred 272.7 miles away from the city center
On 2/10/2010 at 09:59:35, a magnitude 3.8 (3.8 MW, Depth: 6.2 mi, Class: Light, Intensity: II - III) earthquake occurred 31.8 miles away from the city center
On 5/2/2015 at 16:23:07, a magnitude 4.2 (4.2 MW, Depth: 2.8 mi) earthquake occurred 144.0 miles away from the city center
Magnitude types: regional Lg-wave magnitude (LG), body-wave magnitude (MB), surface-wave magnitude (MS), moment magnitude (MW)
Natural disasters:
The number of natural disasters in McHenry County (15) is near the US average (15).Major Disasters (Presidential) Declared: 8
Emergencies Declared: 6
Causes of natural disasters: Storms: 7, Floods: 6, Snows: 3, Snowstorms: 2, Tornadoes: 2, Winter Storms: 2, Blizzard: 1, Hurricane: 1, Wind: 1, Other: 1 (Note: some incidents may be assigned to more than one category).

Hospitals and medical centers near Johnsburg:
- FMC OF MCHENRY (Dialysis Facility, about 4 miles away; MCHENRY, IL)
- ALDEN TERRACE OF MCHENRY REHAB (Nursing Home, about 5 miles away; MCHENRY, IL)
- FMC - NEOMEDICA - ROUND LAKE (Dialysis Facility, about 7 miles away; ROUND LAKE, IL)
- HILLCREST RETIREMENT VILLAGE (Nursing Home, about 8 miles away; ROUND LAKE BEACH, IL)
- SPRINGS AT CRYSTAL LAKE, THE (Nursing Home, about 9 miles away; CRYSTAL LAKE, IL)
- WAUKEGAN ILLINOIS HOSPITAL COMPANY LLC (Hospital, about 10 miles away; LINDENHURST, IL)
- FMC - ANTIOCH (Dialysis Facility, about 10 miles away; ANTIOCH, IL)
Colleges/universities with over 2000 students nearest to Johnsburg:
- McHenry County College (about 12 miles; Crystal Lake, IL; Full-time enrollment: 4,886)
- College of Lake County (about 12 miles; Grayslake, IL; FT enrollment: 11,041)
- Harper College (about 23 miles; Palatine, IL; FT enrollment: 10,800)
- Gateway Technical College (about 26 miles; Kenosha, WI; FT enrollment: 5,089)
- Elgin Community College (about 26 miles; Elgin, IL; FT enrollment: 8,173)
- American InterContinental University-Online (about 27 miles; Schaumburg, IL; FT enrollment: 16,158)
- University of Wisconsin-Parkside (about 27 miles; Kenosha, WI; FT enrollment: 3,843)
Public high school in Johnsburg:
- JOHNSBURG HIGH SCHOOL (Students: 907, Location: 2002 W RINGWOOD RD, Grades: 9-12)
Public elementary/middle schools in Johnsburg:
- JOHNSBURG JR HIGH SCHOOL (Students: 826, Location: 2220 CHURCH ST, Grades: 5-8)
- JAMES C BUSH ELEM SCHOOL (Students: 340, Location: 2117 CHURCH ST, Grades: 3-4)
Private elementary/middle school in Johnsburg:
Library in Johnsburg:
Points of interest:
Notable locations in Johnsburg: Sunnyside Village Hall (A), McHenry Township Fire Protection District Station 2 (B). Display/hide their locations on the map
Church in Johnsburg: Muller Chapel (A). Display/hide its location on the map
Parks in Johnsburg include: McHenry Park (1), Weingart Road Sedge Meadow Nature Preserve (2). Display/hide their locations on the map
Birthplace of: Chuck Hiller - Baseball player.
Drinking water stations with addresses in Johnsburg and their reported violations in the past:
LAYTON ATHLETICS (Population served: 30, Groundwater):Past monitoring violations:RAYMONDS BOWL (Population served: 25, Groundwater):
- 5 routine major monitoring violations
- One regular monitoring violation
Past monitoring violations:
- 3 routine major monitoring violations
- One regular monitoring violation
| This village: | 2.9 people |
| Illinois: | 2.6 people |
| This village: | 81.1% |
| Whole state: | 65.8% |
| This village: | 4.5% |
| Whole state: | 6.3% |
Likely homosexual households (counted as self-reported same-sex unmarried-partner households)
- Lesbian couples: 0.4% of all households
- Gay men: 0.1% of all households
Banks with branches in Johnsburg (2011 data):
- First Midwest Bank: Johnsburg Facility at 3805 N. Johnsburg Road, branch established on 1985/08/26. Info updated 2011/12/22: Bank assets: $7,848.0 mil, Deposits: $6,529.2 mil, headquarters in Itasca, IL, positive income, Commercial Lending Specialization, 100 total offices, Holding Company: First Midwest Bancorp, Inc.
- State Bank: Johnsburg Facility at 3503 North Chapel Hill Road, branch established on 1984/05/01. Info updated 2006/11/03: Bank assets: $174.6 mil, Deposits: $156.5 mil, headquarters in Wonder Lake, IL, negative income in the last year, Mortgage Lending Specialization, 6 total offices, Holding Company: Wonder Bancorp, Inc.
- JPMorgan Chase Bank, National Association: Johnsburg Branch at 2911 Commerce Dr, branch established on 2008/11/26. Info updated 2011/11/10: Bank assets: $1,811,678.0 mil, Deposits: $1,190,738.0 mil, headquarters in Columbus, OH, positive income, International Specialization, 5577 total offices, Holding Company: Jpmorgan Chase & Co.
For population 15 years and over in Johnsburg:
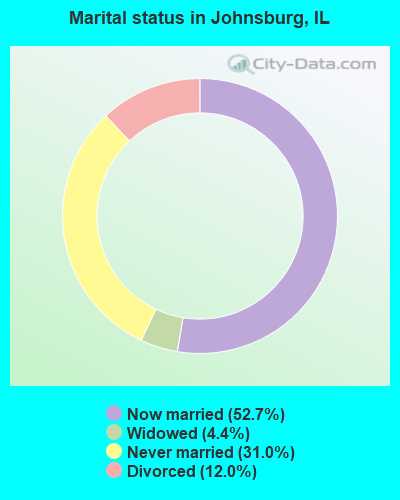
- Never married: 31.0%
- Now married: 52.7%
- Separated: 0.0%
- Widowed: 4.4%
- Divorced: 12.0%
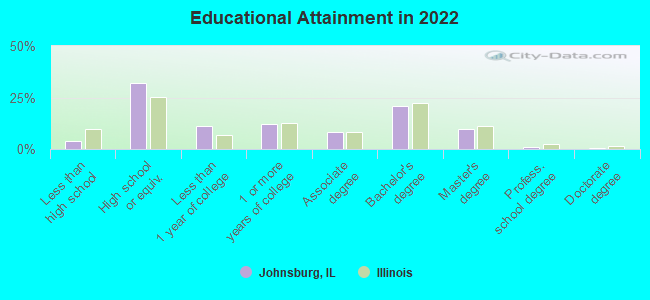
For population 25 years and over in Johnsburg:
- High school or higher: 95.9%
- Bachelor's degree or higher: 32.1%
- Graduate or professional degree: 10.8%
- Unemployed: 2.0%
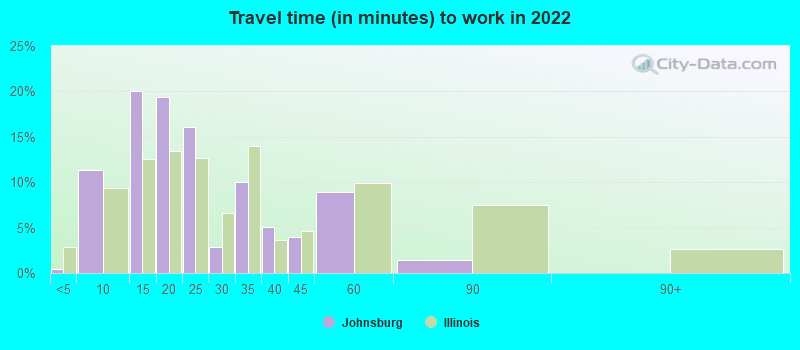
- Mean travel time to work (commute): 25.7 minutes
| Here: | 9.6 |
| Illinois average: | 12.5 |
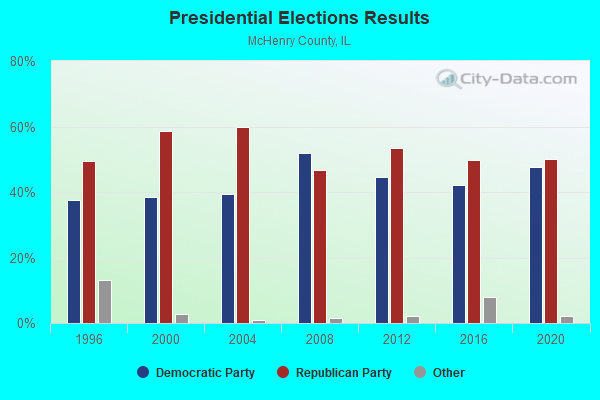
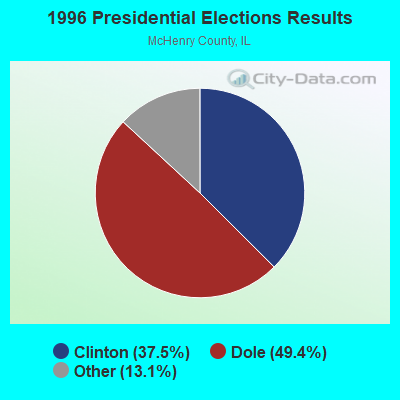
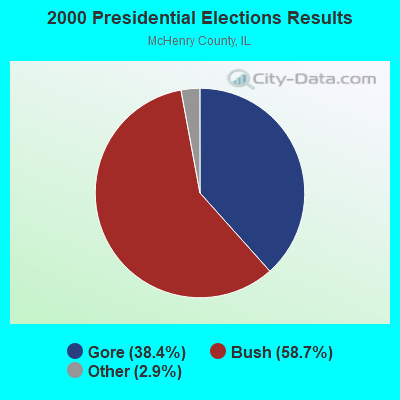
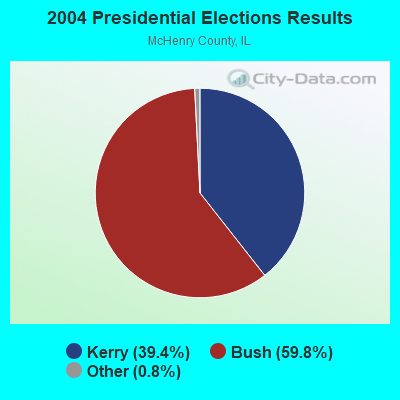
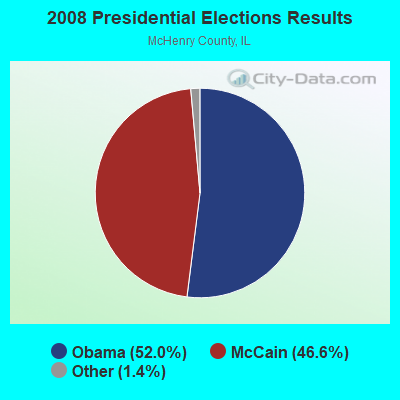
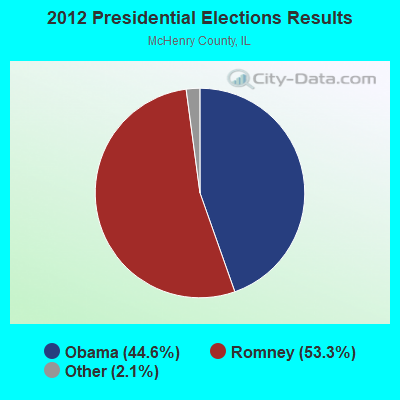
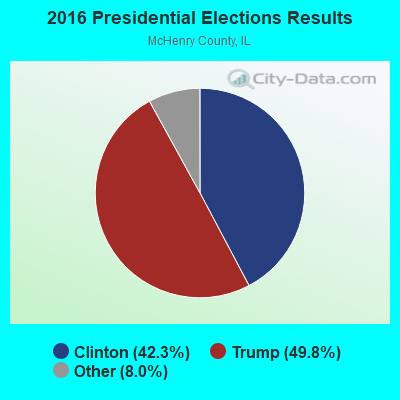
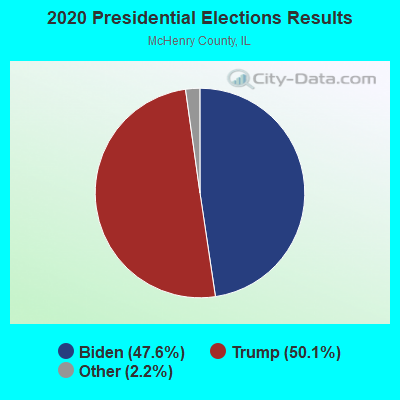
Graphs represent county-level data. Detailed 2008 Election Results
Religion statistics for Johnsburg, IL (based on McHenry County data)
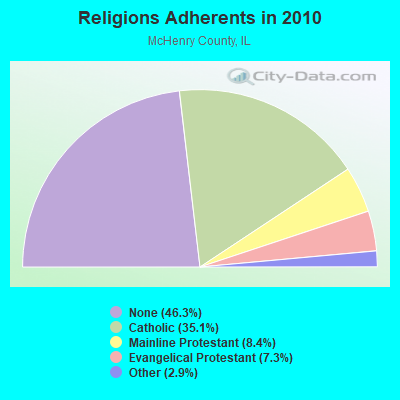
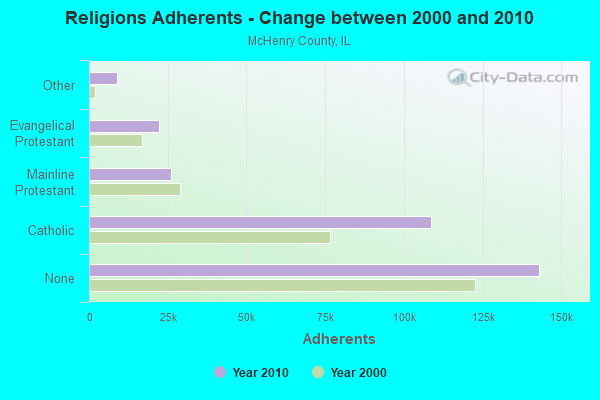
| Religion | Adherents | Congregations |
|---|---|---|
| Catholic | 108,465 | 17 |
| Mainline Protestant | 25,985 | 46 |
| Evangelical Protestant | 22,386 | 76 |
| Other | 8,809 | 20 |
| Orthodox | 54 | 1 |
| None | 143,061 | - |
Food Environment Statistics:
| McHenry County: | 1.40 / 10,000 pop. |
| Illinois: | 2.24 / 10,000 pop. |
| This county: | 0.13 / 10,000 pop. |
| Illinois: | 0.08 / 10,000 pop. |
| McHenry County: | 0.76 / 10,000 pop. |
| Illinois: | 0.75 / 10,000 pop. |
| McHenry County: | 2.03 / 10,000 pop. |
| State: | 2.61 / 10,000 pop. |
| McHenry County: | 6.29 / 10,000 pop. |
| Illinois: | 6.86 / 10,000 pop. |
| This county: | 6.8% |
| Illinois: | 8.3% |
| McHenry County: | 26.5% |
| Illinois: | 25.2% |
| Here: | 17.7% |
| Illinois: | 14.5% |
Health and Nutrition:
| This city: | 51.3% |
| Illinois: | 49.5% |
| Johnsburg: | 48.9% |
| Illinois: | 47.2% |
| Johnsburg: | 29.1 |
| Illinois: | 28.6 |
| Johnsburg: | 21.4% |
| Illinois: | 20.5% |
| Johnsburg: | 11.2% |
| Illinois: | 10.8% |
| This city: | 6.7 |
| State: | 6.8 |
| This city: | 35.2% |
| Illinois: | 33.4% |
| This city: | 57.8% |
| Illinois: | 56.4% |
| Here: | 78.3% |
| Illinois: | 79.9% |
More about Health and Nutrition of Johnsburg, IL Residents
| Local government employment and payroll (March 2022) | |||||
| Function | Full-time employees | Monthly full-time payroll | Average yearly full-time wage | Part-time employees | Monthly part-time payroll |
|---|---|---|---|---|---|
| Police Protection - Officers | 11 | $83,638 | $91,241 | 1 | $1,196 |
| Streets and Highways | 4 | $19,718 | $59,154 | 2 | $427 |
| Other Government Administration | 4 | $26,490 | $79,470 | 8 | $6,754 |
| Police - Other | 2 | $10,069 | $60,414 | 0 | $0 |
| Parks and Recreation | 1 | $4,088 | $49,056 | 0 | $0 |
| Sewerage | 0 | $0 | 1 | $975 | |
| Totals for Government | 22 | $144,003 | $78,547 | 12 | $9,352 |
Johnsburg government finances - Expenditure in 2017 (per resident):
- Construction - Central Staff Services: $623,000 ($97.94)
- Current Operations - Police Protection: $1,716,000 ($269.77)
Central Staff Services: $1,336,000 ($210.03)
Regular Highways: $814,000 ($127.97)
Parks and Recreation: $353,000 ($55.49)
Sewerage: $125,000 ($19.65)
Water Utilities: $47,000 ($7.39)
Financial Administration: $13,000 ($2.04)
Solid Waste Management: $7,000 ($1.10)
- General - Interest on Debt: $157,000 ($24.68)
- Other Capital Outlay - Central Staff Services: $717,000 ($112.72)
Water Utilities: $643,000 ($101.08)
- Total Salaries and Wages: $1,614,000 ($253.73)
Johnsburg government finances - Revenue in 2017 (per resident):
- Charges - Other: $343,000 ($53.92)
- Local Intergovernmental - Other: $7,000 ($1.10)
- Miscellaneous - General Revenue - Other: $840,000 ($132.05)
Fines and Forfeits: $90,000 ($14.15)
Interest Earnings: $7,000 ($1.10)
- Revenue - Water Utilities: $269,000 ($42.29)
- State Intergovernmental - General Local Government Support: $2,237,000 ($351.67)
Highways: $167,000 ($26.25)
- Tax - Property: $865,000 ($135.98)
Public Utilities Sales: $427,000 ($67.13)
Other Selective Sales: $424,000 ($66.66)
Other License: $74,000 ($11.63)
Johnsburg government finances - Debt in 2017 (per resident):
- Long Term Debt - Beginning Outstanding - Unspecified Public Purpose: $2,275,000 ($357.65)
Outstanding Unspecified Public Purpose: $2,035,000 ($319.92)
Retired Unspecified Public Purpose: $240,000 ($37.73)
Johnsburg government finances - Cash and Securities in 2017 (per resident):
- Other Funds - Cash and Securities: $1,742,000 ($273.86)
| Businesses in Johnsburg, IL | ||||
| Name | Count | Name | Count | |
|---|---|---|---|---|
| JCPenney | 1 | Sephora | 1 | |
| Justice | 1 | True Value | 1 | |
| Payless | 1 | Vans | 1 | |
Strongest AM radio stations in Johnsburg:
- WTMJ (620 AM; 50 kW; MILWAUKEE, WI; Owner: JOURNAL BROADCAST CORPORATION)
- WGN (720 AM; 50 kW; CHICAGO, IL; Owner: WGN CONTINENTAL BROADCASTING CO.)
- WBBM (780 AM; 50 kW; CHICAGO, IL; Owner: INFINITY BROADCASTING OPERATIONS, INC.)
- WSCR (670 AM; 50 kW; CHICAGO, IL; Owner: INFINITY BROADCASTING OPERATIONS, INC.)
- WISN (1130 AM; 50 kW; MILWAUKEE, WI; Owner: CAPSTAR TX LIMITED PARTNERSHIP)
- WNVR (1030 AM; 5 kW; VERNON HILLS, IL; Owner: POLNET COMMUNICATIONS, LTD.)
- WMVP (1000 AM; 50 kW; CHICAGO, IL; Owner: ABC, INC.)
- WAIT (850 AM; daytime; 2 kW; CRYSTAL LAKE, IL; Owner: NM LICENSING, LLC)
- WLS (890 AM; 50 kW; CHICAGO, IL; Owner: WLS, INC.)
- WYLL (1160 AM; 50 kW; CHICAGO, IL; Owner: SCA LICENSE CORPORATION)
- WKTA (1330 AM; 5 kW; EVANSTON, IL; Owner: POLNET COMMUNICATIONS, LTD.)
- WVIV (1200 AM; 20 kW; CHICAGO, IL; Owner: WLXX-AM LICENSE CORP.)
- WMBI (1110 AM; daytime; 5 kW; CHICAGO, IL; Owner: THE MOODY BIBLE INSTITUTE OF CHICAGO)
Strongest FM radio stations in Johnsburg:
- WZSR (105.5 FM; WOODSTOCK, IL; Owner: NM LICENSING, LLC)
- W206AI (89.1 FM; LAKE VILLA, IL; Owner: CALVARY CHAPEL OF TWIN FALLS, INC.)
- WCKG (105.9 FM; ELMWOOD PARK, IL; Owner: INFINITY HOLDINGS CORPORATION OF ORLANDO)
- WLIT-FM (93.9 FM; CHICAGO, IL; Owner: AMFM RADIO LICENSES, L.L.C.)
- WJMK (104.3 FM; CHICAGO, IL; Owner: INFINITY BROADCASTING CORP. OF ILLINOIS)
- WNUA (95.5 FM; CHICAGO, IL; Owner: AMFM RADIO LICENSES, L.L.C.)
- WTMX (101.9 FM; SKOKIE, IL; Owner: BONNEVILLE HOLDING COMPANY)
- WGCI-FM (107.5 FM; CHICAGO, IL; Owner: AMFM RADIO LICENSES, L.L.C.)
- WBBM-FM (96.3 FM; CHICAGO, IL; Owner: INFINITY BROADCASTING OPERATIONS, INC.)
- WKSC-FM (103.5 FM; CHICAGO, IL; Owner: AMFM RADIO LICENSES, L.L.C.)
- WWDV (96.9 FM; ZION, IL; Owner: BONNEVILLE HOLDING COMPANY)
- WFMT (98.7 FM; CHICAGO, IL; Owner: WINDOW TO THE WORLD COMMUNICATIONS)
- WZZN (94.7 FM; CHICAGO, IL; Owner: ABC CHICAGO FM RADIO,INC.)
- WBEZ (91.5 FM; CHICAGO, IL; Owner: THE WBEZ ALLIANCE, INC.)
- WKQX (101.1 FM; CHICAGO, IL; Owner: EMMIS RADIO LICENSE CORPORATION)
- WLUP-FM (97.9 FM; CHICAGO, IL; Owner: BONNEVILLE HOLDING COMPANY)
- WNND (100.3 FM; CHICAGO, IL; Owner: BONNEVILLE HOLDING COMPANY)
- WOJO (105.1 FM; EVANSTON, IL; Owner: TICHENOR LICENSE CORPORATION ("TLC"))
- WUSN (99.5 FM; CHICAGO, IL; Owner: INFINITY BROADCASTING CORPORATION OF CHICAGO)
- WVAZ (102.7 FM; OAK PARK, IL; Owner: AMFM RADIO LICENSES, L.L.C.)
TV broadcast stations around Johnsburg:
- W64CQ (Channel 64; ARLINGTON HEIGHTS, IL; Owner: TRINITY BROADCASTING NETWORK)
- W34CK (Channel 34; ARLINGTON HEIGHTS, IL; Owner: FIRST UNITED, INC.)
- WLS-TV (Channel 7; CHICAGO, IL; Owner: WLS TELEVISION, INC.)
- WMAQ-TV (Channel 5; CHICAGO, IL; Owner: NBC SUBSIDIARY (WMAQ-TV), INC.)
- WTTW (Channel 11; CHICAGO, IL; Owner: WINDOW TO THE WORLD COMMUNICATIONS, INC.)
- WGBO-TV (Channel 66; JOLIET, IL; Owner: WGBO LICENSE PARTNERSHIP, G.P.)
- WGN-TV (Channel 9; CHICAGO, IL; Owner: WGN CONTINENTAL BROADCASTING COMPANY)
- WBBM-TV (Channel 2; CHICAGO, IL; Owner: CBS BROADCASTING INC.)
- WPWR-TV (Channel 50; GARY, IN; Owner: FOX TELEVISION STATIONS, INC.)
- WXFT (Channel 60; AURORA, IL; Owner: TELEFUTURA CHICAGO LLC)
- WCIU-TV (Channel 26; CHICAGO, IL; Owner: WCIU-TV LIMITED PARTNERSHIP)
- WCPX (Channel 38; CHICAGO, IL; Owner: PAXSON CHICAGO LICENSE, INC.)
- WSNS-TV (Channel 44; CHICAGO, IL; Owner: TELEMUNDO OF CHICAGO, INC.)
- WFLD (Channel 32; CHICAGO, IL; Owner: FOX TELEVISION STATIONS, INC.)
- W68DO (Channel 68; PALATINE, IL; Owner: TRINITY BROADCASTING NETWORK)
- WFBT-CA (Channel 23; CHICAGO, IL; Owner: CHANNEL 23 LIMITED PARTNERSHIP)
- WJYS (Channel 62; HAMMOND, IN; Owner: JOVON BROADCASTING CORPORATION)
- WJJA (Channel 49; RACINE, WI; Owner: TV-49, INC.)
- WOCH-LP (Channel 28; CHICAGO, IL; Owner: KM LPTV OF CHICAGO-28, L.L.C.)
- WYCC (Channel 20; CHICAGO, IL; Owner: COLLEGE DIST. #508, COUNTY OF COOK)
- WOCK-CA (Channel 13; CHICAGO, IL; Owner: KM LPTV OF CHICAGO-13, L.L.C.)
- W57DN (Channel 57; ELGIN, IL; Owner: TRINITY BROADCASTING NETWORK)
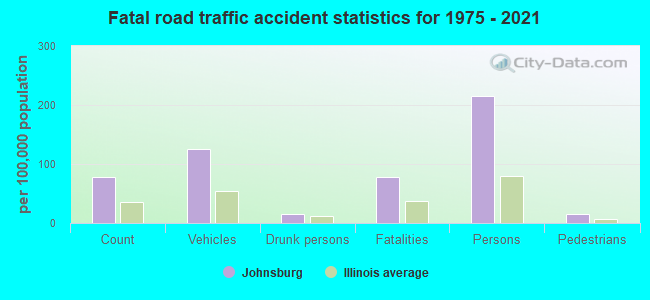
Johnsburg fatal accident list:
Dec 15, 2015 01:24 PM, Ringwood Rd, Mccullom Lake Rd, Lat: 42.376858, Lon: -88.306114, Vehicles: 2, Persons: 2, Fatalities: 1
Nov 24, 2012 10:20 PM, Ringwood Road, Lat: 42.376717, Lon: -88.306169, Vehicles: 1, Persons: 1, Fatalities: 1, Drunk persons involved: 1
Dec 25, 2010 09:09 PM, Johnsburg Road, Lat: 42.379111, Lon: -88.255083, Vehicles: 2, Persons: 4, Fatalities: 1
Mar 1, 2009 09:38 PM, Sr-31, Diamond, Lat: 42.366614, Lon: -88.267594, Vehicles: 1, Persons: 5, Pedestrians: 1, Fatalities: 1
- National Bridge Inventory (NBI) Statistics
- 5Number of bridges
- 92ft / 28.2mTotal length
- 49,750Total average daily traffic
- 2,700Total average daily truck traffic
- 49,189Total future (year 2032) average daily traffic
FCC Registered Antenna Towers:
3- Jennifer Brown, 815 Bay Rd (Lat: 42.364778 Lon: -88.214167), Type: 39.6, Structure height: 17111 m, Overall height: 38.1 m, Registrant: Pi Tower Development, LLC C/O Lendlease Americas LLC, Jennifer.Brown@lendlease.Com, Suite 260, Irvin-g, Phone: (585) 402-0632
- Jennifer Brown, 815 Bay Rd (Lat: 42.364778 Lon: -88.214167), Type: 39.6, Structure height: 17111 m, Overall height: 38.1 m, Registrant: Pi Tower Development, LLC C/O Lendlease Americas LLC, Jennifer.Brown@lendlease.Com, Suite 260, Irvin-g, Phone: (585) 402-0632
- Jennifer Brown, 815 Bay Rd (Lat: 42.364778 Lon: -88.214167), Type: 39.6, Structure height: 17111 m, Overall height: 38.1 m, Registrant: Pi Tower Development, LLC C/O Lendlease Americas LLC, Jennifer.Brown@lendlease.Com, Suite 260, Irvin-g, Phone: (585) 402-0632
FCC Registered Broadcast Land Mobile Towers:
3- Lat: 42.386056 Lon: -88.207833, Call Sign: WPZN857,
Assigned Frequencies: 469.675 MHz, Grant Date: 02/26/2014, Expiration Date: 02/10/2024, Certifier: William R Wehrs Jr, Registrant: Professional Licensing Consultants Inc, Rockville, MD 20849, Phone: (301) 309-2380, Fax: (301) 309-1996
- 2940 Commerce Rd (Lat: 42.354278 Lon: -88.269778), Call Sign: WQHC236,
Assigned Frequencies: 467.225 MHz, 466.962 MHz, 451.487 MHz, 451.587 MHz, 451.737 MHz, Grant Date: 06/06/2017, Expiration Date: 06/26/2027, Certifier: Luann Perryman, Registrant: Bearcom Operating LLC, ., Dallas, TX 75355-9001, Phone: (800) 458-9887, Fax: (214) 355-4954, Email:
- Lat: 42.379917 Lon: -88.243833, Call Sign: WRAJ361,
Assigned Frequencies: 452.187 MHz, 452.637 MHz, 457.087 MHz, 457.187 MHz, 457.637 MHz, Grant Date: 12/04/2017, Expiration Date: 12/04/2027, Certifier: Fritz Larson, Registrant: Radicom, Inc., 2604 North Chapel Hill Road, Mchenry, IL 60051, Phone: (815) 385-4224, Email:
FCC Registered Microwave Towers:
2- Johnsburg Tower, Lat: 42.380556 Lon: -88.271111, Type: Tank, Structure height: 42 m, Overall height: 45 m, Call Sign: WQJL371,
Assigned Frequencies: 3650.00 MHz, Grant Date: 12/27/2018, Expiration Date: 10/17/2020, Cancellation Date: 12/19/2020, Certifier: Michael Hasten, Registrant: Lerman Senter Pllc, 2000 K Street, Nw, Suite 600, Washington, DC 20006, Phone: (202) 429-8970, Fax: (202) 293-7783, Email:
- GARFIELD, 3707 Garfield Rd (Lat: 42.380444 Lon: -88.270917), Type: Tank, Structure height: 39 m, Overall height: 40 m, Call Sign: WQXP238,
Assigned Frequencies: 11075.0 MHz, 11075.0 MHz, 11075.0 MHz, 11075.0 MHz, 11075.0 MHz, 11075.0 MHz, 11075.0 MHz, 11075.0 MHz, 11075.0 MHz, 11075.0 MHz... (+10 more), Grant Date: 04/27/2016, Expiration Date: 04/27/2026, Certifier: Greg Green, Registrant: Keller And Heckman LLP, 1001 G Street Nw, Suite 500 West, Washington, DC 20001, Phone: (202) 434-4100, Fax: (202) 434-4646, Email:
FCC Registered Amateur Radio Licenses:
10 (See the full list of FCC Registered Amateur Radio Licenses in Johnsburg)FAA Registered Aircraft Manufacturers and Dealers:
1- JANSEN AVIATION SERVICES AND SALES LLC, 3905 Dutch Creek Ln, Johnsburg, IL 60051
Certificate: D007115 (LLC), Certificate Issue Date: 11/18/2020, Expiration Date: 11/17/2021
FAA Registered Aircraft:
4- Aircraft: CESSNA 210L (Category: Land, Seats: 6, Weight: Up to 12,499 Pounds, Speed: 87 mph), Engine: CONT MOTOR IO 520 SERIES (285 HP) (Reciprocating)
N-Number: 210JV, N210JV, N-210JV, Serial Number: 21059850, Year manufactured: 1973, Airworthiness Date: 03/15/1973, Certificate Issue Date: 04/20/1999
Registrant (Co-Owned): James B Vyduna, 2015 W Bryn Mawr Ct, Johnsburg, IL 60050, Other Owners: Jeanette M Vyduna - Aircraft: CESSNA 182P (Category: Land, Seats: 4, Weight: Up to 12,499 Pounds, Speed: 120 mph), Engine: CONT MOTOR O-470 SERIES (230 HP) (Reciprocating)
N-Number: 52859, N52859, N-52859, Serial Number: 18262903, Year manufactured: 1974, Airworthiness Date: 02/28/1974, Certificate Issue Date: 12/17/2019
Registrant (LLC): Wehrs Aviation LLC, 1012 Pistakee View Ct, Johnsburg, IL 60051 - Aircraft: BEECH V35 (Category: Land, Seats: 6, Weight: Up to 12,499 Pounds, Speed: 150 mph), Engine: CONT MOTOR IO-550-B (300 HP) (Reciprocating)
N-Number: 6263V, N6263V, N-6263V, Serial Number: D-8594, Year manufactured: 1967, Airworthiness Date: 09/27/1967, Certificate Issue Date: 09/10/2018
Registrant (LLC): Jansen Aviation Services And Sales LLC, 3905 Dutch Creek Ln, Johnsburg, IL 60051 - Aircraft: COLDEN MWP (Category: Land, Seats: 2, Weight: Up to 12,499 Pounds, Speed: 85 mph), Engine: LYCOMING 0-145B SERIES (65 HP) (Reciprocating)
N-Number: 12C, N12C, N-12C, Serial Number: C-1, Year manufactured: 1961, Airworthiness Date: 06/10/1981, Certificate Issue Date: 10/14/2008
Registrant (Individual): Charles Williams, 1316 Hayden Dr, Johnsburg, IL 60051
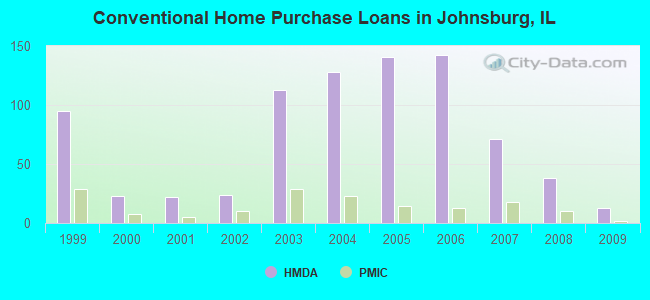
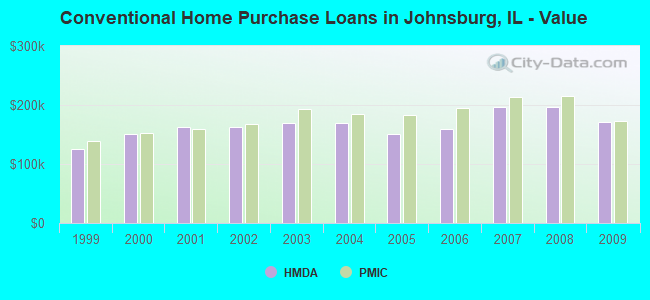
| Home Mortgage Disclosure Act Aggregated Statistics For Year 2009 (Based on 4 partial tracts) | ||||||||||
| A) FHA, FSA/RHS & VA Home Purchase Loans | B) Conventional Home Purchase Loans | C) Refinancings | D) Home Improvement Loans | F) Non-occupant Loans on < 5 Family Dwellings (A B C & D) | ||||||
|---|---|---|---|---|---|---|---|---|---|---|
| Number | Average Value | Number | Average Value | Number | Average Value | Number | Average Value | Number | Average Value | |
| LOANS ORIGINATED | 18 | $162,054 | 13 | $171,488 | 153 | $199,748 | 3 | $222,007 | 13 | $206,062 |
| APPLICATIONS APPROVED, NOT ACCEPTED | 1 | $284,730 | 2 | $209,275 | 16 | $214,214 | 0 | $0 | 2 | $137,955 |
| APPLICATIONS DENIED | 2 | $207,875 | 4 | $138,145 | 40 | $202,572 | 3 | $67,540 | 2 | $200,620 |
| APPLICATIONS WITHDRAWN | 2 | $182,575 | 2 | $273,630 | 26 | $202,991 | 1 | $101,400 | 2 | $221,370 |
| FILES CLOSED FOR INCOMPLETENESS | 1 | $177,270 | 1 | $153,530 | 10 | $209,718 | 0 | $0 | 1 | $54,240 |
Detailed HMDA statistics for the following Tracts: 8706.03 , 8706.04, 8707.02, 8707.03
| Private Mortgage Insurance Companies Aggregated Statistics For Year 2009 (Based on 4 partial tracts) | ||||
| A) Conventional Home Purchase Loans | B) Refinancings | |||
|---|---|---|---|---|
| Number | Average Value | Number | Average Value | |
| LOANS ORIGINATED | 2 | $172,170 | 3 | $196,307 |
| APPLICATIONS APPROVED, NOT ACCEPTED | 2 | $173,315 | 2 | $138,440 |
| APPLICATIONS DENIED | 0 | $0 | 3 | $278,877 |
| APPLICATIONS WITHDRAWN | 0 | $0 | 1 | $241,210 |
| FILES CLOSED FOR INCOMPLETENESS | 0 | $0 | 0 | $0 |
Detailed PMIC statistics for the following Tracts: 8706.03 , 8706.04, 8707.02, 8707.03
2005 - 2018 National Fire Incident Reporting System (NFIRS) incidents
- Fire incident types reported to NFIRS in Johnsburg, IL
- 5946.8%Structure Fires
- 4434.9%Outside Fires
- 1814.3%Mobile Property/Vehicle Fires
- 54.0%Other
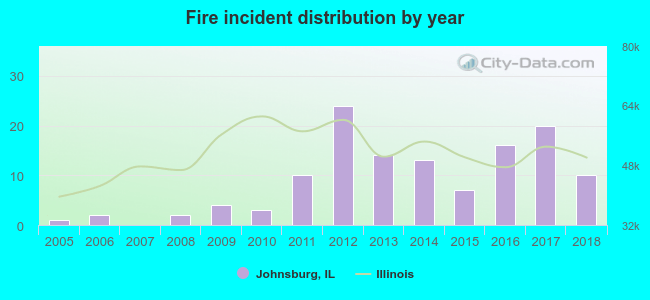 According to the data from the years 2005 - 2018 the average number of fire incidents per year is 9. The highest number of reported fires - 24 took place in 2012, and the least - 0 in 2007. The data has a growing trend.
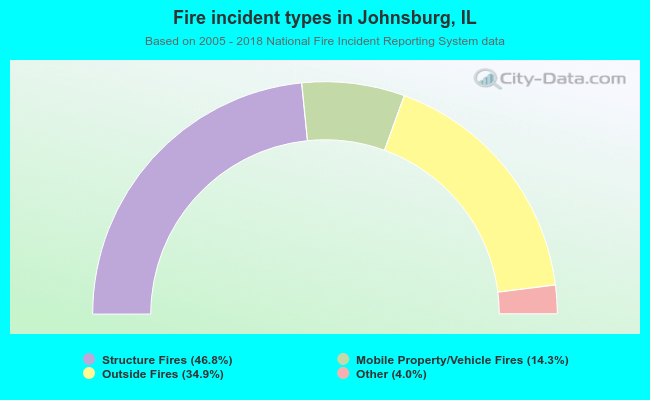 When looking into fire subcategories, the most incidents belonged to: Structure Fires (46.8%), and Outside Fires (34.9%).
Johnsburg compared to Illinois state average:
- Unemployed percentage significantly below state average.
- Black race population percentage significantly below state average.
- Hispanic race population percentage below state average.
- Foreign-born population percentage significantly below state average.
- Renting percentage significantly below state average.
- Number of rooms per house above state average.
Johnsburg on our top lists:
- #51 on the list of "Top 101 cities with the lowest number of assaults per 100,000 residents (population 5,000+)"
- #83 on the list of "Top 101 cities with the most residents born in Bangladesh (population 500+)"
- #6 on the list of "Top 101 counties with the largest decrease in the number of births per 1000 residents 2000-2006 to 2007-2013 (pop 50,000+)"
- #10 on the list of "Top 101 counties with the lowest number of infant deaths per 1000 residents 2007-2013 (pop. 50,000+)"
- #10 on the list of "Top 101 counties with the largest decrease in the number of infant deaths per 1000 residents 2000-2006 to 2007-2013 (pop. 50,000+)"
- #30 on the list of "Top 101 counties with the lowest percentage of residents relocating to foreign countries in 2011"
- #36 on the list of "Top 101 counties with the largest number of people moving out compared to moving in (pop. 50,000+)"

|
|
Total of 84 patent applications in 2008-2024.