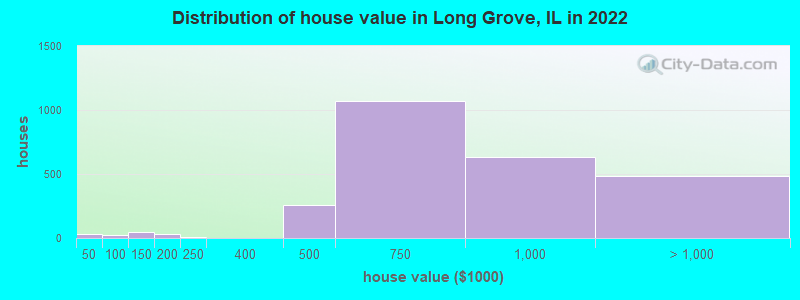
Estimated median house or condo value in 2022: $753,512 (it was $554,000 in 2000)
Long Grove:
$753,512
IL:
$251,600
Mean prices in 2022:all housing units: $394,651; detached houses: $427,728; townhouses or other attached units: $254,368; in 2-unit structures: $280,026; in 3-to-4-unit structures: $258,063; in 5-or-more-unit structures: $301,665; mobile homes: $80,100
Median gross rent in 2022: $3,544.
March 2022 cost of living index in Long Grove: 111.4 (more than average, U.S. average is 100)
Percentage of residents living in poverty in 2022: 1.4%
(1.3% for White Non-Hispanic residents, 6.4% for Hispanic or Latino residents, 5.5% for two or more races residents)
According to our research of Illinois and other state lists, there were 4 registered sex offenders living in Long Grove, Illinois as of May 19, 2024. The ratio of all residents to sex offenders in Long Grove is 2,017 to 1. The ratio of registered sex offenders to all residents in this city is much lower than the state average.
Recent articles from our blog. Our writers, many of them Ph.D. graduates or candidates, create easy-to-read articles on a wide variety of topics.
Latest news from Long Grove, IL collected exclusively by city-data.com from local newspapers, TV, and radio stations
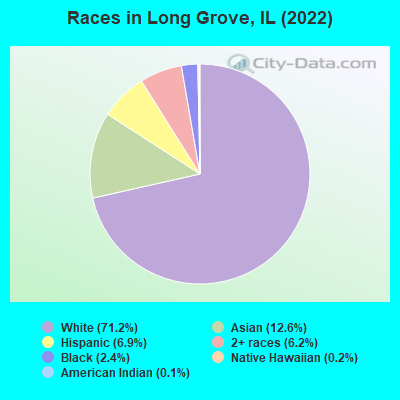
Ancestries: German (9.1%), Russian (6.6%), Italian (6.4%), English (6.4%), Polish (6.3%), Irish (5.3%).
Current Local Time: CST time zone
Incorporated on 03/27/1957
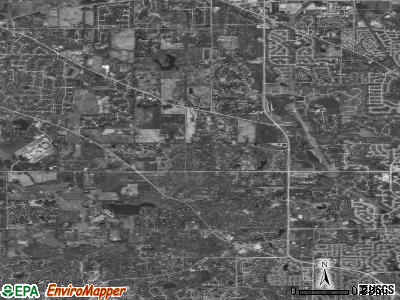
Elevation: 730 feet
Land area: 12.3 square miles.
Population density: 674 people per square mile (low).
1,517 residents are foreign born (8.2% Asia, 7.0% Europe, 2.6% Latin America).
This village:
18.4%
Illinois:
14.1%
Median real estate property taxes paid for housing units with mortgages in 2022: $9,637 (1.3%) Median real estate property taxes paid for housing units with no mortgage in 2022: $9,494 (1.3%)
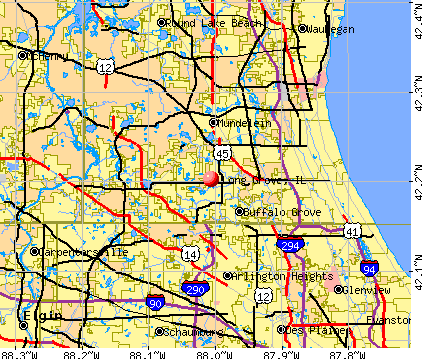
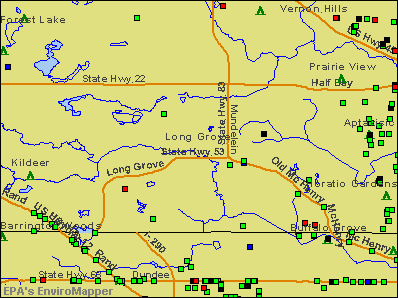
Nearest city with pop. 50,000+: Palatine, IL (6.2 miles , pop. 65,479).
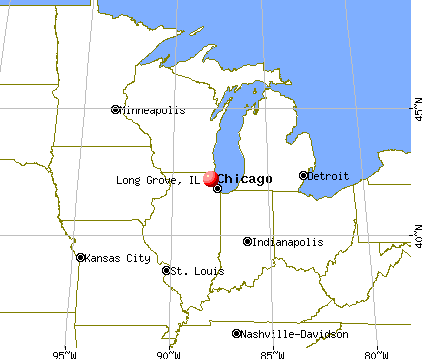
Nearest city with pop. 200,000+: Chicago, IL (30.1 miles , pop. 2,896,016).
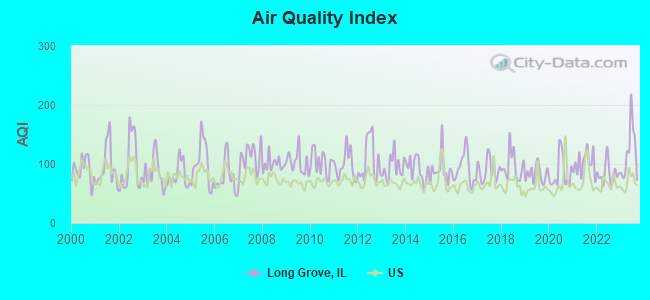
Air Quality Index (AQI) level in 2023 was 120. This is significantly worse than average.
City:
120
U.S.:
73
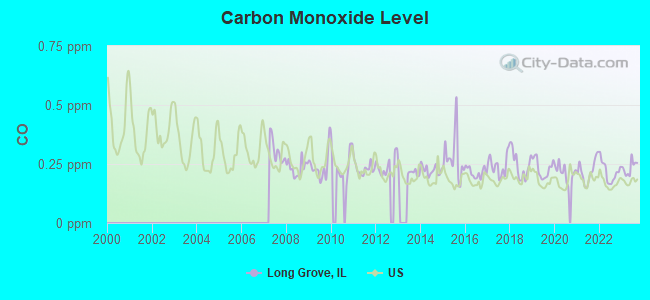
Carbon Monoxide (CO) [ppm] level in 2023 was 0.235. This is about average.Closest monitor was 11.5 miles away from the city center.
City:
0.235
U.S.:
0.251
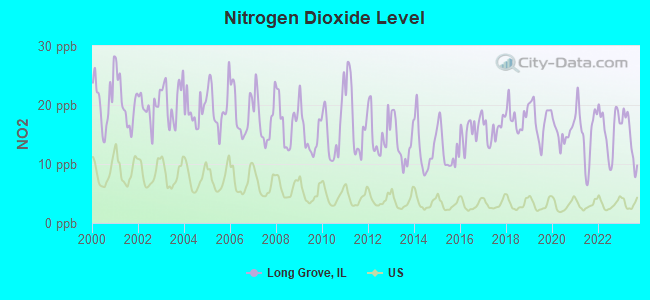
Nitrogen Dioxide (NO2) [ppb] level in 2023 was 14.5. This is significantly worse than average.Closest monitor was 11.5 miles away from the city center.
City:
14.5
U.S.:
5.1
Sulfur Dioxide (SO2) [ppb] level in 2023 was 0.912. This is significantly better than average.Closest monitor was 11.5 miles away from the city center.
City:
0.912
U.S.:
1.515
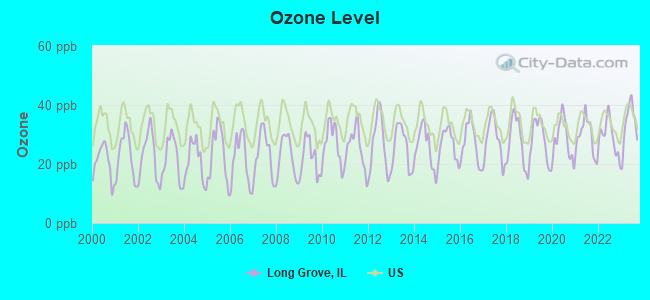
Ozone [ppb] level in 2023 was 33.5. This is about average.Closest monitor was 7.5 miles away from the city center.
City:
33.5
U.S.:
33.3
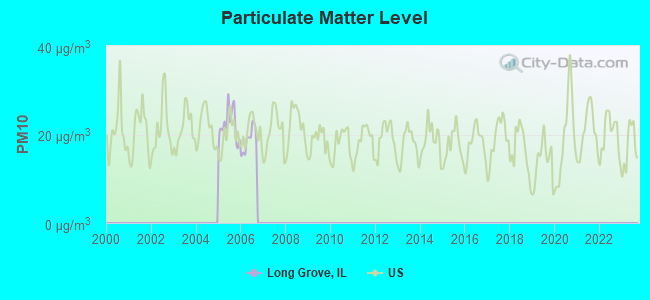
Particulate Matter (PM10) [µg/m3] level in 2006 was 18.6. This is about average.Closest monitor was 11.5 miles away from the city center.
City:
18.6
U.S.:
19.2
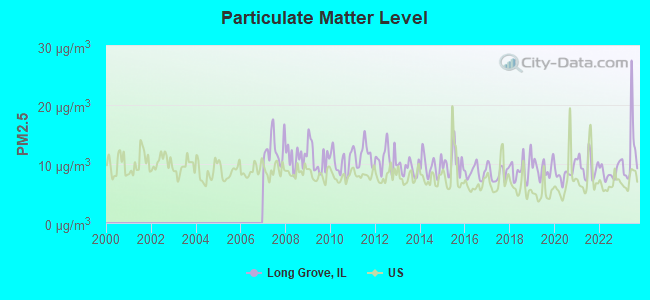
Particulate Matter (PM2.5) [µg/m3] level in 2023 was 11.8. This is significantly worse than average.Closest monitor was 11.5 miles away from the city center.
City:
11.8
U.S.:
8.1
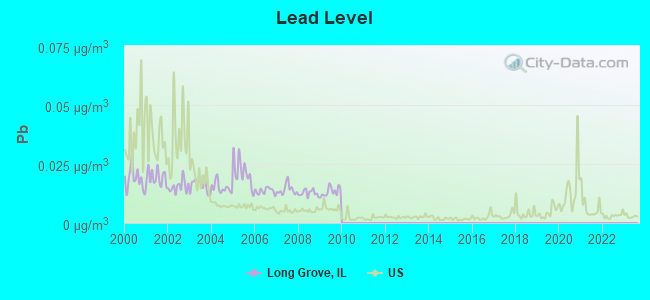
Lead (Pb) [µg/m3] level in 2009 was 0.0133. This is significantly worse than average.Closest monitor was 8.4 miles away from the city center.
City:
0.0133
U.S.:
0.0093
Tornado activity:
Long Grove-area historical tornado activity is slightly below Illinois state average. It is 34% greater than the overall U.S. average.
On 4/21/1967, a category F4 (max. wind speeds 207-260 mph) tornado 4.9 miles away from the Long Grove village center killed one personand injured 100 peopleand causedbetween $500,000 and $5,000,000 in damages.
On 9/28/1972, a category F4 tornado 8.8 miles away from the village center injured 20 peopleand causedbetween $500,000 and $5,000,000 in damages.
Earthquake activity:
Long Grove-area historical earthquake activity is significantly above Illinois state average. It is 34% greater than the overall U.S. average.
On 4/18/2008 at 09:36:59, a magnitude 5.4 (5.1 MB, 4.8 MS, 5.4 MW, 5.2 MW, Class: Moderate, Intensity: VI - VII) earthquake occurred 259.5 miles away from the city center On 6/10/1987 at 23:48:54, a magnitude 5.1 (4.9 MB, 4.4 MS, 4.6 MS, 5.1 LG) earthquake occurred 234.0 miles away from the city center On 4/18/2008 at 09:36:59, a magnitude 5.2 (5.2 MW, Depth: 8.9 mi) earthquake occurred 259.5 miles away from the city center On 6/28/2004 at 06:10:52, a magnitude 4.2 (4.2 MW, Depth: 6.2 mi, Class: Light, Intensity: IV - V) earthquake occurred 69.0 miles away from Long Grove center On 2/10/2010 at 09:59:35, a magnitude 3.8 (3.8 MW, Depth: 6.2 mi, Class: Light, Intensity: II - III) earthquake occurred 30.0 miles away from the city center On 5/2/2015 at 16:23:07, a magnitude 4.2 (4.2 MW, Depth: 2.8 mi) earthquake occurred 132.1 miles away from the city center Magnitude types: regional Lg-wave magnitude (LG), body-wave magnitude (MB), surface-wave magnitude (MS), moment magnitude (MW)
Natural disasters:
The number of natural disasters in Lake County (16) is near the US average (15). Major Disasters (Presidential) Declared: 10 Emergencies Declared: 5
Causes of natural disasters: Storms: 9, Floods: 7, Tornadoes: 3, Snows: 2, Snowstorms: 2, Winter Storms: 2, Blizzard: 1, Hurricane: 1, Wind: 1, Other: 1 (Note: some incidents may be assigned to more than one category).
Hospitals and medical centers in Long Grove:
ALDEN LONG GROVE REHAB ANDHC CTR (BOX 2308 RFD HICKS ROAD)
ARLINGTON REHAB AND LIVING CTR (1666 CHECKER ROAD)
MAPLE HILL NH (BOX 2308 RFD)
Amtrak station near Long Grove:
14 miles: GLENVIEW (1116 DEPOT ST.) . Services: ticket office, fully wheelchair accessible, enclosed waiting area, public restrooms, public payphones, free short-term parking, free long-term parking, call for car rental service, taxi stand, public transit connection.
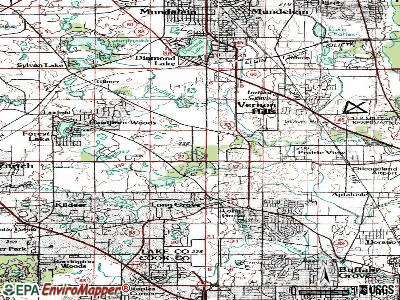
Notable locations in Long Grove: Twin Orchard Country Club (A), Town Orchard Country Club (B), Indian Valley Country Club (C), Long Grove Village Hall (D), Long Grove Fire Protection District (E). Display/hide their locations on the map
Churches in Long Grove include: Christ Church of Long Grove (A), Congregation Beth Judea (B), Hope Lutheran Church of Buffalo Grove (C), Twin Grove Baptist Church (D), Long Grove Church (E). Display/hide their locations on the map
Likely homosexual households (counted as self-reported same-sex unmarried-partner households)
Lesbian couples: 0.6% of all households
Gay men: 0.2% of all households
331 people in nursing facilities/skilled-nursing facilities in 2010
304 people in nursing homes in 2000
28 people in agriculture workers' dormitories on farms in 2000
Banks with branches in Long Grove (2011 data):
PNC Bank, National Association: Long Grove Branch at 3980 Route 22, branch established on 2006/01/09. Info updated 2012/03/20: Bank assets: $263,309.6 mil, Deposits: $197,343.0 mil, headquarters in Wilmington, DE, positive income, Commercial Lending Specialization, 3085 total offices, Holding Company: Pnc Financial Services Group, Inc., The
Firstmerit Bank, National Association: Long Grove Branch at 1190 Old Mchenry Road, branch established on 1901/01/01. Info updated 2010/05/17: Bank assets: $14,420.6 mil, Deposits: $11,497.6 mil, headquarters in Akron, OH, positive income, Commercial Lending Specialization, 213 total offices, Holding Company: Firstmerit Corporation
JPMorgan Chase Bank, National Association: Long Grove Banking Center Branch at 4198 Illinois 83, branch established on 2011/07/06. Info updated 2011/11/10: Bank assets: $1,811,678.0 mil, Deposits: $1,190,738.0 mil, headquarters in Columbus, OH, positive income, International Specialization, 5577 total offices, Holding Company: Jpmorgan Chase & Co.
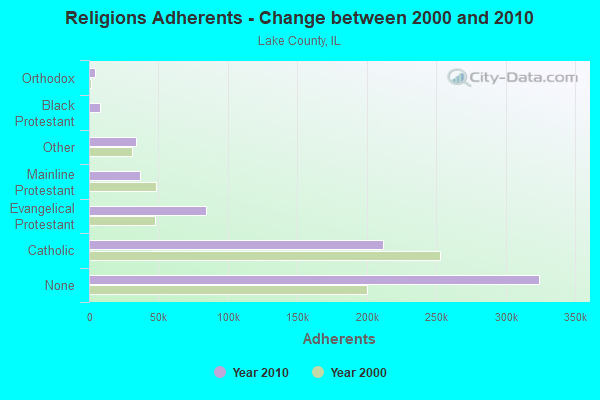
Religion statistics for Long Grove, IL (based on Lake County data)
Religion
Adherents
Congregations
Catholic
211,380
29
Evangelical Protestant
84,501
211
Mainline Protestant
36,967
76
Other
33,822
62
Black Protestant
7,824
16
Orthodox
4,610
8
None
324,358
-
Source: Clifford Grammich, Kirk Hadaway, Richard Houseal, Dale E.Jones, Alexei Krindatch, Richie Stanley and Richard H.Taylor. 2012. 2010 U.S.Religion Census: Religious Congregations & Membership Study. Association of Statisticians of American Religious Bodies. Jones, Dale E., et al. 2002. Congregations and Membership in the United States 2000. Nashville, TN: Glenmary Research Center. Graphs represent county-level data
Aircraft: CESSNA 310N (Category: Land, Engines: 2, Seats: 6, Weight: Up to 12,499 Pounds, Speed: 167 mph), Engine: CONT MOTOR I0-470 SERIES (260 HP) (Reciprocating) N-Number: 4120Q, N4120Q, N-4120Q, Serial Number: 310N-0020, Year manufactured: 1967, Airworthiness Date: 11/15/1967, Certificate Issue Date: 07/13/2015 Registrant (Individual): Vartan Seferian, 6740 Lakeridge Dr, Long Grove, IL 60047
Aircraft: CESSNA 172N (Category: Land, Seats: 4, Weight: Up to 12,499 Pounds, Speed: 105 mph), Engine: LYCOMING 0-320 SERIES (180 HP) (Reciprocating) N-Number: 733XM, N733XM, N-733XM, Serial Number: 17268631, Year manufactured: 1977, Airworthiness Date: 02/07/1977, Certificate Issue Date: 10/16/2018 Registrant (Co-Owned): Calin Roatis, 3284 Monitor Ln, Long Grove, IL 60047, Other Owners: Florentina Roatis
Aircraft: DIAMOND AIRCRAFT IND GMBH DA 42 NG (Category: Land, Engines: 2, Seats: 4, Weight: Up to 12,499 Pounds), Engine: AUSTRO E4 SERIES (168 HP) (Reciprocating) N-Number: 821ZB, N821ZB, N-821ZB, Serial Number: 42.N003, Year manufactured: 2009, Airworthiness Date: 12/03/2010, Certificate Issue Date: 04/15/2015 Registrant (Corporation): American General Aviation Corp, Attn: Bo Zhang / 4748 Wellington Dr, Long Grove, IL 60047
Aircraft: BEECH M35 (Category: Land, Seats: 5, Weight: Up to 12,499 Pounds, Speed: 150 mph), Engine: CONT MOTOR I0-470 SERIES (260 HP) (Reciprocating) N-Number: 9814R, N9814R, N-9814R, Serial Number: D-6325, Year manufactured: 1960, Airworthiness Date: 02/09/1960, Certificate Issue Date: 08/18/1986 Registrant (Individual): John R Chitjian, 3266 Middlesax Dr, Long Grove, IL 60047
Aircraft: CESSNA 177RG (Category: Land, Seats: 4, Weight: Up to 12,499 Pounds, Speed: 120 mph), Engine: LYCOMING IO-360-A1B6D (200 HP) (Reciprocating) N-Number: 1912Q, N1912Q, N-1912Q, Serial Number: 177RG0312, Year manufactured: 1972, Airworthiness Date: 01/16/1973, Certificate Issue Date: 12/28/2012 Registrant (Corporation): Partners For Neighborhood Group Inc, 6740 Lakeridge Dr, Long Grove, IL 60047 Deregistered:Cancel Date: 02/26/2018
Aircraft: DIAMOND AIRCRAFT IND GMBH DA 40 (Category: Land, Seats: 4, Weight: Up to 12,499 Pounds), Engine: LYCOMING I0360 SER A&C (200 HP) (Reciprocating) N-Number: 843DK, N843DK, N-843DK, Serial Number: 40036, Year manufactured: 2001, Airworthiness Date: 07/13/2001, Certificate Issue Date: 04/05/2007 Registrant (Corporation): Kmbe Trading LLC, 4720 Wellington Dr, Long Grove, IL 60047 Deregistered:Cancel Date: 01/09/2018
Home Mortgage Disclosure Act Aggregated Statistics For Year 2009 (Based on 8 partial tracts)
A) FHA, FSA/RHS & VA Home Purchase Loans
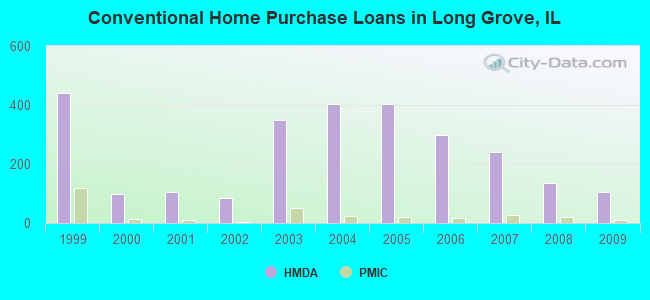
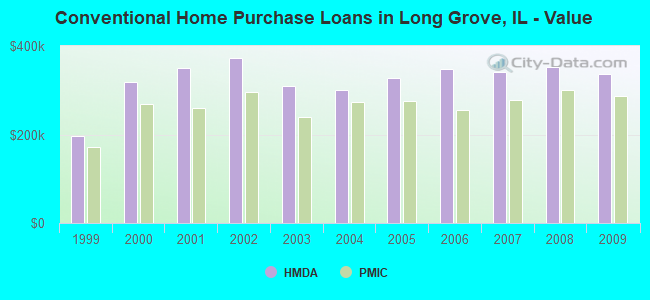
B) Conventional Home Purchase Loans
C) Refinancings
D) Home Improvement Loans
E) Loans on Dwellings For 5+ Families
F) Non-occupant Loans on < 5 Family Dwellings (A B C & D)
G) Loans On Manufactured Home Dwelling (A B C & D)
Number
Average Value
Number
Average Value
Number
Average Value
Number
Average Value
Number
Average Value
Number
Average Value
Number
Average Value
LOANS ORIGINATED
16
$229,328
105
$335,995
847
$306,910
15
$205,908
1
$322,830
14
$303,141
2
$399,540
APPLICATIONS APPROVED, NOT ACCEPTED
2
$190,385
12
$310,787
82
$325,736
0
$0
0
$0
1
$97,010
1
$156,070
APPLICATIONS DENIED
3
$265,383
19
$373,000
150
$357,880
5
$107,192
0
$0
5
$281,968
0
$0
APPLICATIONS WITHDRAWN
2
$247,540
11
$328,523
77
$348,976
2
$108,815
0
$0
1
$145,310
0
$0
FILES CLOSED FOR INCOMPLETENESS
0
$0
1
$376,600
42
$307,698
2
$269,485
0
$0
0
$0
0
$0
Aggregated Statistics For Year 2008 (Based on 8 partial tracts)
A) FHA, FSA/RHS & VA Home Purchase Loans
B) Conventional Home Purchase Loans
C) Refinancings
D) Home Improvement Loans
F) Non-occupant Loans on < 5 Family Dwellings (A B C & D)
Number
Average Value
Number
Average Value
Number
Average Value
Number
Average Value
Number
Average Value
LOANS ORIGINATED
5
$235,226
137
$353,046
515
$349,364
9
$108,024
11
$236,166
APPLICATIONS APPROVED, NOT ACCEPTED
0
$0
24
$425,842
47
$359,316
3
$90,993
2
$386,750
APPLICATIONS DENIED
1
$299,260
24
$365,243
133
$379,892
9
$112,781
7
$239,134
APPLICATIONS WITHDRAWN
1
$401,380
12
$381,103
50
$311,164
4
$289,535
0
$0
FILES CLOSED FOR INCOMPLETENESS
0
$0
5
$403,860
22
$352,603
0
$0
1
$224,080
Aggregated Statistics For Year 2007 (Based on 8 partial tracts)
A) FHA, FSA/RHS & VA Home Purchase Loans
B) Conventional Home Purchase Loans
C) Refinancings
D) Home Improvement Loans
F) Non-occupant Loans on < 5 Family Dwellings (A B C & D)
Number
Average Value
Number
Average Value
Number
Average Value
Number
Average Value
Number
Average Value
LOANS ORIGINATED
2
$180,440
242
$341,775
536
$364,999
30
$194,818
32
$291,400
APPLICATIONS APPROVED, NOT ACCEPTED
0
$0
35
$340,359
50
$338,449
8
$186,215
4
$255,185
APPLICATIONS DENIED
0
$0
43
$322,235
147
$367,540
11
$141,085
7
$312,827
APPLICATIONS WITHDRAWN
0
$0
17
$349,036
45
$383,790
5
$178,318
1
$491,370
FILES CLOSED FOR INCOMPLETENESS
0
$0
5
$321,986
36
$361,302
3
$179,433
1
$267,150
Aggregated Statistics For Year 2006 (Based on 8 partial tracts)
A) FHA, FSA/RHS & VA Home Purchase Loans
B) Conventional Home Purchase Loans
C) Refinancings
D) Home Improvement Loans
E) Loans on Dwellings For 5+ Families
F) Non-occupant Loans on < 5 Family Dwellings (A B C & D)
Number
Average Value
Number
Average Value
Number
Average Value
Number
Average Value
Number
Average Value
Number
Average Value
LOANS ORIGINATED
1
$185,440
299
$347,288
561
$355,599
45
$172,313
9
$281,700
29
$249,045
APPLICATIONS APPROVED, NOT ACCEPTED
0
$0
44
$340,610
56
$345,383
5
$238,640
0
$0
2
$486,665
APPLICATIONS DENIED
0
$0
36
$343,075
143
$355,100
12
$196,135
0
$0
7
$236,706
APPLICATIONS WITHDRAWN
1
$149,390
25
$426,299
78
$345,420
3
$288,467
0
$0
3
$194,927
FILES CLOSED FOR INCOMPLETENESS
0
$0
8
$295,925
26
$372,564
2
$287,295
0
$0
1
$196,810
Aggregated Statistics For Year 2005 (Based on 8 partial tracts)
A) FHA, FSA/RHS & VA Home Purchase Loans
B) Conventional Home Purchase Loans
C) Refinancings
D) Home Improvement Loans
E) Loans on Dwellings For 5+ Families
F) Non-occupant Loans on < 5 Family Dwellings (A B C & D)
Number
Average Value
Number
Average Value
Number
Average Value
Number
Average Value
Number
Average Value
Number
Average Value
LOANS ORIGINATED
2
$234,865
403
$326,983
620
$334,968
37
$207,565
2
$614,390
35
$226,031
APPLICATIONS APPROVED, NOT ACCEPTED
0
$0
40
$342,617
56
$333,043
6
$119,257
1
$279,790
4
$294,220
APPLICATIONS DENIED
0
$0
48
$356,034
143
$350,201
22
$166,853
1
$243,710
9
$257,802
APPLICATIONS WITHDRAWN
0
$0
45
$300,561
125
$344,005
11
$273,305
0
$0
7
$222,763
FILES CLOSED FOR INCOMPLETENESS
0
$0
12
$317,965
35
$399,184
3
$114,263
0
$0
3
$227,853
Aggregated Statistics For Year 2004 (Based on 8 partial tracts)
A) FHA, FSA/RHS & VA Home Purchase Loans
B) Conventional Home Purchase Loans
C) Refinancings
D) Home Improvement Loans
E) Loans on Dwellings For 5+ Families
F) Non-occupant Loans on < 5 Family Dwellings (A B C & D)
G) Loans On Manufactured Home Dwelling (A B C & D)
Number
Average Value
Number
Average Value
Number
Average Value
Number
Average Value
Number
Average Value
Number
Average Value
Number
Average Value
LOANS ORIGINATED
4
$174,345
405
$300,928
784
$298,411
32
$132,237
6
$308,025
36
$207,771
0
$0
APPLICATIONS APPROVED, NOT ACCEPTED
0
$0
36
$331,509
66
$293,711
5
$89,268
0
$0
5
$193,520
0
$0
APPLICATIONS DENIED
1
$165,570
44
$286,018
147
$305,897
17
$105,761
0
$0
12
$270,466
1
$57,750
APPLICATIONS WITHDRAWN
0
$0
53
$274,139
103
$329,261
5
$191,478
0
$0
14
$166,501
0
$0
FILES CLOSED FOR INCOMPLETENESS
0
$0
13
$361,803
48
$318,011
3
$231,747
0
$0
1
$175,780
0
$0
Aggregated Statistics For Year 2003 (Based on 8 partial tracts)
A) FHA, FSA/RHS & VA Home Purchase Loans
B) Conventional Home Purchase Loans
C) Refinancings
D) Home Improvement Loans
E) Loans on Dwellings For 5+ Families
F) Non-occupant Loans on < 5 Family Dwellings (A B C & D)
Number
Average Value
Number
Average Value
Number
Average Value
Number
Average Value
Number
Average Value
Number
Average Value
LOANS ORIGINATED
10
$172,180
348
$309,938
2,021
$252,774
21
$104,335
3
$399,700
26
$195,542
APPLICATIONS APPROVED, NOT ACCEPTED
0
$0
33
$364,165
161
$257,160
7
$74,176
0
$0
4
$266,490
APPLICATIONS DENIED
0
$0
33
$324,958
210
$280,998
9
$51,013
1
$148,760
5
$238,060
APPLICATIONS WITHDRAWN
1
$88,170
29
$351,194
169
$255,092
3
$73,770
0
$0
6
$278,885
FILES CLOSED FOR INCOMPLETENESS
1
$86,560
8
$422,928
57
$321,511
2
$39,760
0
$0
1
$166,010
Aggregated Statistics For Year 2002 (Based on 2 partial tracts)
B) Conventional Home Purchase Loans
C) Refinancings
D) Home Improvement Loans
F) Non-occupant Loans on < 5 Family Dwellings (A B C & D)
Number
Average Value
Number
Average Value
Number
Average Value
Number
Average Value
LOANS ORIGINATED
86
$372,940
378
$308,520
5
$82,852
3
$264,413
APPLICATIONS APPROVED, NOT ACCEPTED
10
$406,740
36
$309,905
1
$48,400
0
$0
APPLICATIONS DENIED
6
$459,363
32
$290,319
2
$83,140
0
$0
APPLICATIONS WITHDRAWN
8
$385,821
26
$295,616
0
$0
1
$49,670
FILES CLOSED FOR INCOMPLETENESS
4
$412,498
20
$296,780
1
$88,250
0
$0
Aggregated Statistics For Year 2001 (Based on 2 partial tracts)
A) FHA, FSA/RHS & VA Home Purchase Loans
B) Conventional Home Purchase Loans
C) Refinancings
D) Home Improvement Loans
F) Non-occupant Loans on < 5 Family Dwellings (A B C & D)
Number
Average Value
Number
Average Value
Number
Average Value
Number
Average Value
Number
Average Value
LOANS ORIGINATED
1
$119,500
104
$350,227
264
$289,569
12
$101,794
2
$197,040
APPLICATIONS APPROVED, NOT ACCEPTED
0
$0
9
$337,390
26
$311,533
4
$64,168
1
$97,760
APPLICATIONS DENIED
0
$0
5
$253,726
26
$297,034
3
$20,303
1
$288,820
APPLICATIONS WITHDRAWN
0
$0
10
$267,526
23
$257,545
2
$37,880
0
$0
FILES CLOSED FOR INCOMPLETENESS
0
$0
1
$425,670
3
$233,897
1
$66,800
0
$0
Aggregated Statistics For Year 2000 (Based on 2 partial tracts)
A) FHA, FSA/RHS & VA Home Purchase Loans
B) Conventional Home Purchase Loans
C) Refinancings
D) Home Improvement Loans
F) Non-occupant Loans on < 5 Family Dwellings (A B C & D)
Number
Average Value
Number
Average Value
Number
Average Value
Number
Average Value
Number
Average Value
LOANS ORIGINATED
1
$125,790
98
$317,960
50
$280,337
12
$68,973
3
$159,663
APPLICATIONS APPROVED, NOT ACCEPTED
0
$0
9
$313,550
10
$212,106
4
$36,135
0
$0
APPLICATIONS DENIED
0
$0
8
$438,451
9
$255,096
3
$70,877
1
$260,800
APPLICATIONS WITHDRAWN
0
$0
8
$263,971
6
$197,308
1
$31,150
0
$0
FILES CLOSED FOR INCOMPLETENESS
0
$0
0
$0
3
$348,567
0
$0
0
$0
Aggregated Statistics For Year 1999 (Based on 6 partial tracts)
A) FHA, FSA/RHS & VA Home Purchase Loans
B) Conventional Home Purchase Loans
C) Refinancings
D) Home Improvement Loans
E) Loans on Dwellings For 5+ Families
F) Non-occupant Loans on < 5 Family Dwellings (A B C & D)
2002 - 2018 National Fire Incident Reporting System (NFIRS) incidents
Based on the data from the years 2002 - 2018 the average number of fires per year is 44. The highest number of reported fires - 83 took place in 2003, and the least - 17 in 2015. The data has a declining trend.
When looking into fire subcategories, the most reports belonged to: Structure Fires (53.9%), and Outside Fires (34.0%).
Fire incident types reported to NFIRS in Long Grove, IL
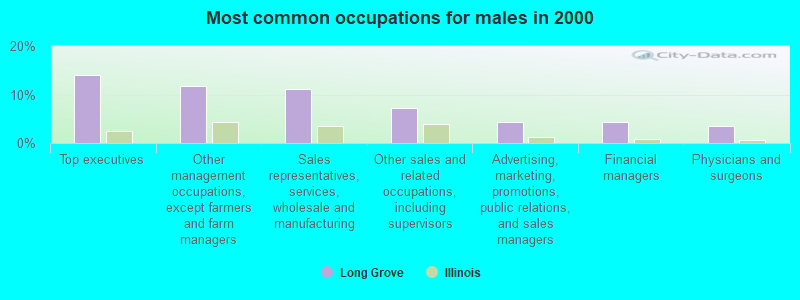
#21 on the list of "Top 101 cities with largest percentage of males in occupations: management occupations (population 5,000+)"
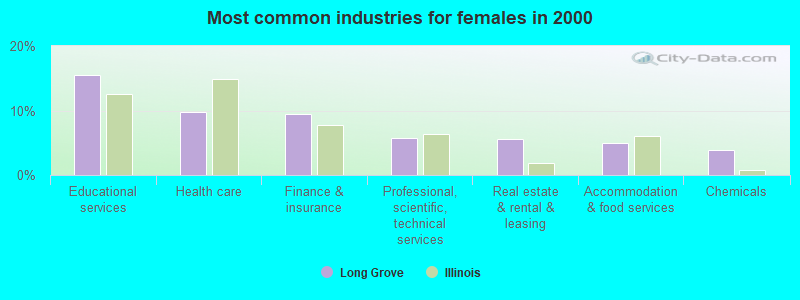
#50 on the list of "Top 101 cities with largest percentage of females in industries: management of companies and enterprises (population 5,000+)"
#60 on the list of "Top 101 cities with the most residents born in Russia (population 500+)"
#63 on the list of "Top 100 cities with biggest houses (pop. 5,000+)"
#64 on the list of "Top 101 cities with the most residents born in Belarus (population 500+)"
#76 on the list of "Top 101 cities with largest percentage of females in occupations: business and financial operations occupations (population 5,000+)"
#81 on the list of "Top 100 cities with highest median household income"
#97 on the list of "Top 101 cities with the most residents born in Eastern Europe (population 500+)"
#4 on the list of "Top 101 counties with the highest average weight of females"
#22 on the list of "Top 101 counties with the largest decrease in the number of births per 1000 residents 2000-2006 to 2007-2013 (pop 50,000+)"
#24 on the list of "Top 101 counties with the largest increase in the number of infant deaths per 1000 residents 2000-2006 to 2007-2013 (pop. 50,000+)"
#29 on the list of "Top 101 counties with the highest percentage of residents that exercised in the past month"
#31 on the list of "Top 101 counties with the largest number of people moving out compared to moving in (pop. 50,000+)"


 Recent articles from our blog. Our writers, many of them Ph.D. graduates or candidates, create easy-to-read articles on a wide variety of topics.

 (6.2 miles


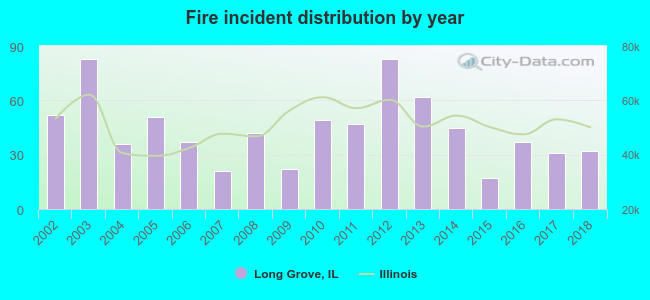 Based on the data from the years 2002 - 2018 the average number of fires per year is 44. The highest number of reported fires - 83 took place in 2003, and the least - 17 in 2015. The data has a declining trend.
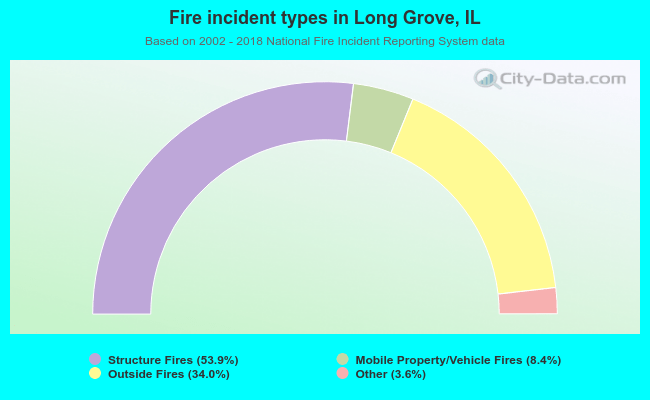 When looking into fire subcategories, the most reports belonged to: Structure Fires (53.9%), and Outside Fires (34.0%).