Freeport, Texas Submit your own pictures of this city and show them to the world
OSM Map
General Map
Google Map
MSN Map
OSM Map
General Map
Google Map
MSN Map
OSM Map
General Map
Google Map
MSN Map
OSM Map
General Map
Google Map
MSN Map
Please wait while loading the map...
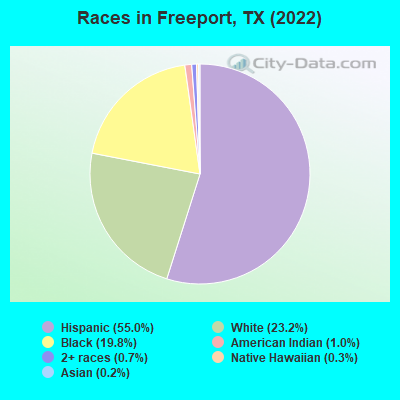
Population in 2022: 10,546 (97% urban, 3% rural). Population change since 2000: -17.0%Males: 5,039 Females: 5,507
March 2022 cost of living index in Freeport: 90.8 (less than average, U.S. average is 100) Percentage of residents living in poverty in 2022: 18.1%for White Non-Hispanic residents , 12.8% for Black residents , 20.0% for Hispanic or Latino residents , 20.5% for other race residents , 14.6% for two or more races residents )Business Search - 14 Million verified businesses
Data:
Median household income ($)
Median household income (% change since 2000)
Household income diversity
Ratio of average income to average house value (%)
Ratio of average income to average rent
Median household income ($) - White
Median household income ($) - Black or African American
Median household income ($) - Asian
Median household income ($) - Hispanic or Latino
Median household income ($) - American Indian and Alaska Native
Median household income ($) - Multirace
Median household income ($) - Other Race
Median household income for houses/condos with a mortgage ($)
Median household income for apartments without a mortgage ($)
Races - White alone (%)
Races - White alone (% change since 2000)
Races - Black alone (%)
Races - Black alone (% change since 2000)
Races - American Indian alone (%)
Races - American Indian alone (% change since 2000)
Races - Asian alone (%)
Races - Asian alone (% change since 2000)
Races - Hispanic (%)
Races - Hispanic (% change since 2000)
Races - Native Hawaiian and Other Pacific Islander alone (%)
Races - Native Hawaiian and Other Pacific Islander alone (% change since 2000)
Races - Two or more races (%)
Races - Two or more races (% change since 2000)
Races - Other race alone (%)
Races - Other race alone (% change since 2000)
Racial diversity
Unemployment (%)
Unemployment (% change since 2000)
Unemployment (%) - White
Unemployment (%) - Black or African American
Unemployment (%) - Asian
Unemployment (%) - Hispanic or Latino
Unemployment (%) - American Indian and Alaska Native
Unemployment (%) - Multirace
Unemployment (%) - Other Race
Population density (people per square mile)
Population - Males (%)
Population - Females (%)
Population - Males (%) - White
Population - Males (%) - Black or African American
Population - Males (%) - Asian
Population - Males (%) - Hispanic or Latino
Population - Males (%) - American Indian and Alaska Native
Population - Males (%) - Multirace
Population - Males (%) - Other Race
Population - Females (%) - White
Population - Females (%) - Black or African American
Population - Females (%) - Asian
Population - Females (%) - Hispanic or Latino
Population - Females (%) - American Indian and Alaska Native
Population - Females (%) - Multirace
Population - Females (%) - Other Race
Coronavirus confirmed cases (Jun 10, 2024)
Deaths caused by coronavirus (Jun 10, 2024)
Coronavirus confirmed cases (per 100k population) (Jun 10, 2024)
Deaths caused by coronavirus (per 100k population) (Jun 10, 2024)
Daily increase in number of cases (Jun 10, 2024)
Weekly increase in number of cases (Jun 10, 2024)
Cases doubled (in days) (Jun 10, 2024)
Hospitalized patients (Apr 18, 2022)
Negative test results (Apr 18, 2022)
Total test results (Apr 18, 2022)
COVID Vaccine doses distributed (per 100k population) (Sep 19, 2023)
COVID Vaccine doses administered (per 100k population) (Sep 19, 2023)
COVID Vaccine doses distributed (Sep 19, 2023)
COVID Vaccine doses administered (Sep 19, 2023)
Likely homosexual households (%)
Likely homosexual households (% change since 2000)
Likely homosexual households - Lesbian couples (%)
Likely homosexual households - Lesbian couples (% change since 2000)
Likely homosexual households - Gay men (%)
Likely homosexual households - Gay men (% change since 2000)
Cost of living index
Median gross rent ($)
Median contract rent ($)
Median monthly housing costs ($)
Median house or condo value ($)
Median house or condo value ($ change since 2000)
Mean house or condo value by units in structure - 1, detached ($)
Mean house or condo value by units in structure - 1, attached ($)
Mean house or condo value by units in structure - 2 ($)
Mean house or condo value by units in structure by units in structure - 3 or 4 ($)
Mean house or condo value by units in structure - 5 or more ($)
Mean house or condo value by units in structure - Boat, RV, van, etc. ($)
Mean house or condo value by units in structure - Mobile home ($)
Median house or condo value ($) - White
Median house or condo value ($) - Black or African American
Median house or condo value ($) - Asian
Median house or condo value ($) - Hispanic or Latino
Median house or condo value ($) - American Indian and Alaska Native
Median house or condo value ($) - Multirace
Median house or condo value ($) - Other Race
Median resident age
Resident age diversity
Median resident age - Males
Median resident age - Females
Median resident age - White
Median resident age - Black or African American
Median resident age - Asian
Median resident age - Hispanic or Latino
Median resident age - American Indian and Alaska Native
Median resident age - Multirace
Median resident age - Other Race
Median resident age - Males - White
Median resident age - Males - Black or African American
Median resident age - Males - Asian
Median resident age - Males - Hispanic or Latino
Median resident age - Males - American Indian and Alaska Native
Median resident age - Males - Multirace
Median resident age - Males - Other Race
Median resident age - Females - White
Median resident age - Females - Black or African American
Median resident age - Females - Asian
Median resident age - Females - Hispanic or Latino
Median resident age - Females - American Indian and Alaska Native
Median resident age - Females - Multirace
Median resident age - Females - Other Race
Commute - mean travel time to work (minutes)
Travel time to work - Less than 5 minutes (%)
Travel time to work - Less than 5 minutes (% change since 2000)
Travel time to work - 5 to 9 minutes (%)
Travel time to work - 5 to 9 minutes (% change since 2000)
Travel time to work - 10 to 19 minutes (%)
Travel time to work - 10 to 19 minutes (% change since 2000)
Travel time to work - 20 to 29 minutes (%)
Travel time to work - 20 to 29 minutes (% change since 2000)
Travel time to work - 30 to 39 minutes (%)
Travel time to work - 30 to 39 minutes (% change since 2000)
Travel time to work - 40 to 59 minutes (%)
Travel time to work - 40 to 59 minutes (% change since 2000)
Travel time to work - 60 to 89 minutes (%)
Travel time to work - 60 to 89 minutes (% change since 2000)
Travel time to work - 90 or more minutes (%)
Travel time to work - 90 or more minutes (% change since 2000)
Marital status - Never married (%)
Marital status - Now married (%)
Marital status - Separated (%)
Marital status - Widowed (%)
Marital status - Divorced (%)
Median family income ($)
Median family income (% change since 2000)
Median non-family income ($)
Median non-family income (% change since 2000)
Median per capita income ($)
Median per capita income (% change since 2000)
Median family income ($) - White
Median family income ($) - Black or African American
Median family income ($) - Asian
Median family income ($) - Hispanic or Latino
Median family income ($) - American Indian and Alaska Native
Median family income ($) - Multirace
Median family income ($) - Other Race
Median year house/condo built
Median year apartment built
Year house built - Built 2005 or later (%)
Year house built - Built 2000 to 2004 (%)
Year house built - Built 1990 to 1999 (%)
Year house built - Built 1980 to 1989 (%)
Year house built - Built 1970 to 1979 (%)
Year house built - Built 1960 to 1969 (%)
Year house built - Built 1950 to 1959 (%)
Year house built - Built 1940 to 1949 (%)
Year house built - Built 1939 or earlier (%)
Average household size
Household density (households per square mile)
Average household size - White
Average household size - Black or African American
Average household size - Asian
Average household size - Hispanic or Latino
Average household size - American Indian and Alaska Native
Average household size - Multirace
Average household size - Other Race
Occupied housing units (%)
Vacant housing units (%)
Owner occupied housing units (%)
Renter occupied housing units (%)
Vacancy status - For rent (%)
Vacancy status - For sale only (%)
Vacancy status - Rented or sold, not occupied (%)
Vacancy status - For seasonal, recreational, or occasional use (%)
Vacancy status - For migrant workers (%)
Vacancy status - Other vacant (%)
Residents with income below the poverty level (%)
Residents with income below 50% of the poverty level (%)
Children below poverty level (%)
Poor families by family type - Married-couple family (%)
Poor families by family type - Male, no wife present (%)
Poor families by family type - Female, no husband present (%)
Poverty status for native-born residents (%)
Poverty status for foreign-born residents (%)
Poverty among high school graduates not in families (%)
Poverty among people who did not graduate high school not in families (%)
Residents with income below the poverty level (%) - White
Residents with income below the poverty level (%) - Black or African American
Residents with income below the poverty level (%) - Asian
Residents with income below the poverty level (%) - Hispanic or Latino
Residents with income below the poverty level (%) - American Indian and Alaska Native
Residents with income below the poverty level (%) - Multirace
Residents with income below the poverty level (%) - Other Race
Air pollution - Air Quality Index (AQI)
Air pollution - CO
Air pollution - NO2
Air pollution - SO2
Air pollution - Ozone
Air pollution - PM10
Air pollution - PM25
Air pollution - Pb
Crime - Murders per 100,000 population
Crime - Rapes per 100,000 population
Crime - Robberies per 100,000 population
Crime - Assaults per 100,000 population
Crime - Burglaries per 100,000 population
Crime - Thefts per 100,000 population
Crime - Auto thefts per 100,000 population
Crime - Arson per 100,000 population
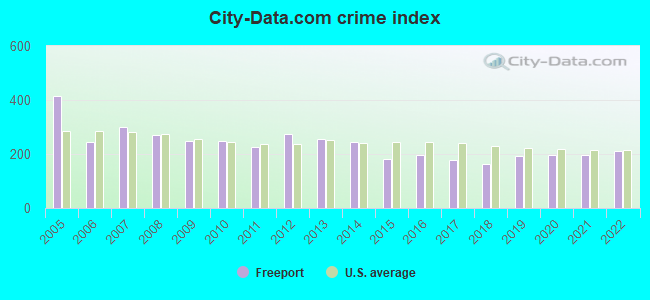
Crime - City-data.com crime index
Crime - Violent crime index
Crime - Property crime index
Crime - Murders per 100,000 population (5 year average)
Crime - Rapes per 100,000 population (5 year average)
Crime - Robberies per 100,000 population (5 year average)
Crime - Assaults per 100,000 population (5 year average)
Crime - Burglaries per 100,000 population (5 year average)
Crime - Thefts per 100,000 population (5 year average)
Crime - Auto thefts per 100,000 population (5 year average)
Crime - Arson per 100,000 population (5 year average)
Crime - City-data.com crime index (5 year average)
Crime - Violent crime index (5 year average)
Crime - Property crime index (5 year average)
1996 Presidential Elections Results (%) - Democratic Party (Clinton)
1996 Presidential Elections Results (%) - Republican Party (Dole)
1996 Presidential Elections Results (%) - Other
2000 Presidential Elections Results (%) - Democratic Party (Gore)
2000 Presidential Elections Results (%) - Republican Party (Bush)
2000 Presidential Elections Results (%) - Other
2004 Presidential Elections Results (%) - Democratic Party (Kerry)
2004 Presidential Elections Results (%) - Republican Party (Bush)
2004 Presidential Elections Results (%) - Other
2008 Presidential Elections Results (%) - Democratic Party (Obama)
2008 Presidential Elections Results (%) - Republican Party (McCain)
2008 Presidential Elections Results (%) - Other
2012 Presidential Elections Results (%) - Democratic Party (Obama)
2012 Presidential Elections Results (%) - Republican Party (Romney)
2012 Presidential Elections Results (%) - Other
2016 Presidential Elections Results (%) - Democratic Party (Clinton)
2016 Presidential Elections Results (%) - Republican Party (Trump)
2016 Presidential Elections Results (%) - Other
2020 Presidential Elections Results (%) - Democratic Party (Biden)
2020 Presidential Elections Results (%) - Republican Party (Trump)
2020 Presidential Elections Results (%) - Other
Ancestries Reported - Arab (%)
Ancestries Reported - Czech (%)
Ancestries Reported - Danish (%)
Ancestries Reported - Dutch (%)
Ancestries Reported - English (%)
Ancestries Reported - French (%)
Ancestries Reported - French Canadian (%)
Ancestries Reported - German (%)
Ancestries Reported - Greek (%)
Ancestries Reported - Hungarian (%)
Ancestries Reported - Irish (%)
Ancestries Reported - Italian (%)
Ancestries Reported - Lithuanian (%)
Ancestries Reported - Norwegian (%)
Ancestries Reported - Polish (%)
Ancestries Reported - Portuguese (%)
Ancestries Reported - Russian (%)
Ancestries Reported - Scotch-Irish (%)
Ancestries Reported - Scottish (%)
Ancestries Reported - Slovak (%)
Ancestries Reported - Subsaharan African (%)
Ancestries Reported - Swedish (%)
Ancestries Reported - Swiss (%)
Ancestries Reported - Ukrainian (%)
Ancestries Reported - United States (%)
Ancestries Reported - Welsh (%)
Ancestries Reported - West Indian (%)
Ancestries Reported - Other (%)
Educational Attainment - No schooling completed (%)
Educational Attainment - Less than high school (%)
Educational Attainment - High school or equivalent (%)
Educational Attainment - Less than 1 year of college (%)
Educational Attainment - 1 or more years of college (%)
Educational Attainment - Associate degree (%)
Educational Attainment - Bachelor's degree (%)
Educational Attainment - Master's degree (%)
Educational Attainment - Professional school degree (%)
Educational Attainment - Doctorate degree (%)
School Enrollment - Nursery, preschool (%)
School Enrollment - Kindergarten (%)
School Enrollment - Grade 1 to 4 (%)
School Enrollment - Grade 5 to 8 (%)
School Enrollment - Grade 9 to 12 (%)
School Enrollment - College undergrad (%)
School Enrollment - Graduate or professional (%)
School Enrollment - Not enrolled in school (%)
School enrollment - Public schools (%)
School enrollment - Private schools (%)
School enrollment - Not enrolled (%)
Median number of rooms in houses and condos
Median number of rooms in apartments
Housing units lacking complete plumbing facilities (%)
Housing units lacking complete kitchen facilities (%)
Density of houses
Urban houses (%)
Rural houses (%)
Households with people 60 years and over (%)
Households with people 65 years and over (%)
Households with people 75 years and over (%)
Households with one or more nonrelatives (%)
Households with no nonrelatives (%)
Population in households (%)
Family households (%)
Nonfamily households (%)
Population in families (%)
Family households with own children (%)
Median number of bedrooms in owner occupied houses
Mean number of bedrooms in owner occupied houses
Median number of bedrooms in renter occupied houses
Mean number of bedrooms in renter occupied houses
Median number of vehichles in owner occupied houses
Mean number of vehichles in owner occupied houses
Median number of vehichles in renter occupied houses
Mean number of vehichles in renter occupied houses
Mortgage status - with mortgage (%)
Mortgage status - with second mortgage (%)
Mortgage status - with home equity loan (%)
Mortgage status - with both second mortgage and home equity loan (%)
Mortgage status - without a mortgage (%)
Average family size
Average family size - White
Average family size - Black or African American
Average family size - Asian
Average family size - Hispanic or Latino
Average family size - American Indian and Alaska Native
Average family size - Multirace
Average family size - Other Race
Geographical mobility - Same house 1 year ago (%)
Geographical mobility - Moved within same county (%)
Geographical mobility - Moved from different county within same state (%)
Geographical mobility - Moved from different state (%)
Geographical mobility - Moved from abroad (%)
Place of birth - Born in state of residence (%)
Place of birth - Born in other state (%)
Place of birth - Native, outside of US (%)
Place of birth - Foreign born (%)
Housing units in structures - 1, detached (%)
Housing units in structures - 1, attached (%)
Housing units in structures - 2 (%)
Housing units in structures - 3 or 4 (%)
Housing units in structures - 5 to 9 (%)
Housing units in structures - 10 to 19 (%)
Housing units in structures - 20 to 49 (%)
Housing units in structures - 50 or more (%)
Housing units in structures - Mobile home (%)
Housing units in structures - Boat, RV, van, etc. (%)
House/condo owner moved in on average (years ago)
Renter moved in on average (years ago)
Year householder moved into unit - Moved in 1999 to March 2000 (%)
Year householder moved into unit - Moved in 1995 to 1998 (%)
Year householder moved into unit - Moved in 1990 to 1994 (%)
Year householder moved into unit - Moved in 1980 to 1989 (%)
Year householder moved into unit - Moved in 1970 to 1979 (%)
Year householder moved into unit - Moved in 1969 or earlier (%)
Means of transportation to work - Drove car alone (%)
Means of transportation to work - Carpooled (%)
Means of transportation to work - Public transportation (%)
Means of transportation to work - Bus or trolley bus (%)
Means of transportation to work - Streetcar or trolley car (%)
Means of transportation to work - Subway or elevated (%)
Means of transportation to work - Railroad (%)
Means of transportation to work - Ferryboat (%)
Means of transportation to work - Taxicab (%)
Means of transportation to work - Motorcycle (%)
Means of transportation to work - Bicycle (%)
Means of transportation to work - Walked (%)
Means of transportation to work - Other means (%)
Working at home (%)
Industry diversity
Most Common Industries - Agriculture, forestry, fishing and hunting, and mining (%)
Most Common Industries - Agriculture, forestry, fishing and hunting (%)
Most Common Industries - Mining, quarrying, and oil and gas extraction (%)
Most Common Industries - Construction (%)
Most Common Industries - Manufacturing (%)
Most Common Industries - Wholesale trade (%)
Most Common Industries - Retail trade (%)
Most Common Industries - Transportation and warehousing, and utilities (%)
Most Common Industries - Transportation and warehousing (%)
Most Common Industries - Utilities (%)
Most Common Industries - Information (%)
Most Common Industries - Finance and insurance, and real estate and rental and leasing (%)
Most Common Industries - Finance and insurance (%)
Most Common Industries - Real estate and rental and leasing (%)
Most Common Industries - Professional, scientific, and management, and administrative and waste management services (%)
Most Common Industries - Professional, scientific, and technical services (%)
Most Common Industries - Management of companies and enterprises (%)
Most Common Industries - Administrative and support and waste management services (%)
Most Common Industries - Educational services, and health care and social assistance (%)
Most Common Industries - Educational services (%)
Most Common Industries - Health care and social assistance (%)
Most Common Industries - Arts, entertainment, and recreation, and accommodation and food services (%)
Most Common Industries - Arts, entertainment, and recreation (%)
Most Common Industries - Accommodation and food services (%)
Most Common Industries - Other services, except public administration (%)
Most Common Industries - Public administration (%)
Occupation diversity
Most Common Occupations - Management, business, science, and arts occupations (%)
Most Common Occupations - Management, business, and financial occupations (%)
Most Common Occupations - Management occupations (%)
Most Common Occupations - Business and financial operations occupations (%)
Most Common Occupations - Computer, engineering, and science occupations (%)
Most Common Occupations - Computer and mathematical occupations (%)
Most Common Occupations - Architecture and engineering occupations (%)
Most Common Occupations - Life, physical, and social science occupations (%)
Most Common Occupations - Education, legal, community service, arts, and media occupations (%)
Most Common Occupations - Community and social service occupations (%)
Most Common Occupations - Legal occupations (%)
Most Common Occupations - Education, training, and library occupations (%)
Most Common Occupations - Arts, design, entertainment, sports, and media occupations (%)
Most Common Occupations - Healthcare practitioners and technical occupations (%)
Most Common Occupations - Health diagnosing and treating practitioners and other technical occupations (%)
Most Common Occupations - Health technologists and technicians (%)
Most Common Occupations - Service occupations (%)
Most Common Occupations - Healthcare support occupations (%)
Most Common Occupations - Protective service occupations (%)
Most Common Occupations - Fire fighting and prevention, and other protective service workers including supervisors (%)
Most Common Occupations - Law enforcement workers including supervisors (%)
Most Common Occupations - Food preparation and serving related occupations (%)
Most Common Occupations - Building and grounds cleaning and maintenance occupations (%)
Most Common Occupations - Personal care and service occupations (%)
Most Common Occupations - Sales and office occupations (%)
Most Common Occupations - Sales and related occupations (%)
Most Common Occupations - Office and administrative support occupations (%)
Most Common Occupations - Natural resources, construction, and maintenance occupations (%)
Most Common Occupations - Farming, fishing, and forestry occupations (%)
Most Common Occupations - Construction and extraction occupations (%)
Most Common Occupations - Installation, maintenance, and repair occupations (%)
Most Common Occupations - Production, transportation, and material moving occupations (%)
Most Common Occupations - Production occupations (%)
Most Common Occupations - Transportation occupations (%)
Most Common Occupations - Material moving occupations (%)
People in Group quarters - Institutionalized population (%)
People in Group quarters - Correctional institutions (%)
People in Group quarters - Federal prisons and detention centers (%)
People in Group quarters - Halfway houses (%)
People in Group quarters - Local jails and other confinement facilities (including police lockups) (%)
People in Group quarters - Military disciplinary barracks (%)
People in Group quarters - State prisons (%)
People in Group quarters - Other types of correctional institutions (%)
People in Group quarters - Nursing homes (%)
People in Group quarters - Hospitals/wards, hospices, and schools for the handicapped (%)
People in Group quarters - Hospitals/wards and hospices for chronically ill (%)
People in Group quarters - Hospices or homes for chronically ill (%)
People in Group quarters - Military hospitals or wards for chronically ill (%)
People in Group quarters - Other hospitals or wards for chronically ill (%)
People in Group quarters - Hospitals or wards for drug/alcohol abuse (%)
People in Group quarters - Mental (Psychiatric) hospitals or wards (%)
People in Group quarters - Schools, hospitals, or wards for the mentally retarded (%)
People in Group quarters - Schools, hospitals, or wards for the physically handicapped (%)
People in Group quarters - Institutions for the deaf (%)
People in Group quarters - Institutions for the blind (%)
People in Group quarters - Orthopedic wards and institutions for the physically handicapped (%)
People in Group quarters - Wards in general hospitals for patients who have no usual home elsewhere (%)
People in Group quarters - Wards in military hospitals for patients who have no usual home elsewhere (%)
People in Group quarters - Juvenile institutions (%)
People in Group quarters - Long-term care (%)
People in Group quarters - Homes for abused, dependent, and neglected children (%)
People in Group quarters - Residential treatment centers for emotionally disturbed children (%)
People in Group quarters - Training schools for juvenile delinquents (%)
People in Group quarters - Short-term care, detention or diagnostic centers for delinquent children (%)
People in Group quarters - Type of juvenile institution unknown (%)
People in Group quarters - Noninstitutionalized population (%)
People in Group quarters - College dormitories (includes college quarters off campus) (%)
People in Group quarters - Military quarters (%)
People in Group quarters - On base (%)
People in Group quarters - Barracks, unaccompanied personnel housing (UPH), (Enlisted/Officer), ;and similar group living quarters for military personnel (%)
People in Group quarters - Transient quarters for temporary residents (%)
People in Group quarters - Military ships (%)
People in Group quarters - Group homes (%)
People in Group quarters - Homes or halfway houses for drug/alcohol abuse (%)
People in Group quarters - Homes for the mentally ill (%)
People in Group quarters - Homes for the mentally retarded (%)
People in Group quarters - Homes for the physically handicapped (%)
People in Group quarters - Other group homes (%)
People in Group quarters - Religious group quarters (%)
People in Group quarters - Dormitories (%)
People in Group quarters - Agriculture workers' dormitories on farms (%)
People in Group quarters - Job Corps and vocational training facilities (%)
People in Group quarters - Other workers' dormitories (%)
People in Group quarters - Crews of maritime vessels (%)
People in Group quarters - Other nonhousehold living situations (%)
People in Group quarters - Other noninstitutional group quarters (%)
Residents speaking English at home (%)
Residents speaking English at home - Born in the United States (%)
Residents speaking English at home - Native, born elsewhere (%)
Residents speaking English at home - Foreign born (%)
Residents speaking Spanish at home (%)
Residents speaking Spanish at home - Born in the United States (%)
Residents speaking Spanish at home - Native, born elsewhere (%)
Residents speaking Spanish at home - Foreign born (%)
Residents speaking other language at home (%)
Residents speaking other language at home - Born in the United States (%)
Residents speaking other language at home - Native, born elsewhere (%)
Residents speaking other language at home - Foreign born (%)
Class of Workers - Employee of private company (%)
Class of Workers - Self-employed in own incorporated business (%)
Class of Workers - Private not-for-profit wage and salary workers (%)
Class of Workers - Local government workers (%)
Class of Workers - State government workers (%)
Class of Workers - Federal government workers (%)
Class of Workers - Self-employed workers in own not incorporated business and Unpaid family workers (%)
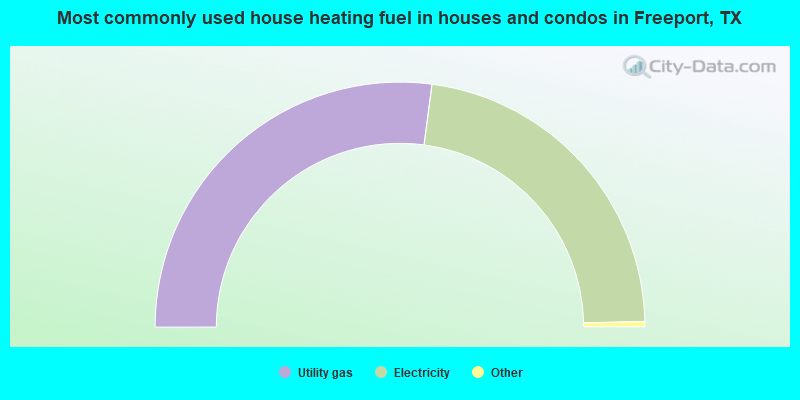
House heating fuel used in houses and condos - Utility gas (%)
House heating fuel used in houses and condos - Bottled, tank, or LP gas (%)
House heating fuel used in houses and condos - Electricity (%)
House heating fuel used in houses and condos - Fuel oil, kerosene, etc. (%)
House heating fuel used in houses and condos - Coal or coke (%)
House heating fuel used in houses and condos - Wood (%)
House heating fuel used in houses and condos - Solar energy (%)
House heating fuel used in houses and condos - Other fuel (%)
House heating fuel used in houses and condos - No fuel used (%)
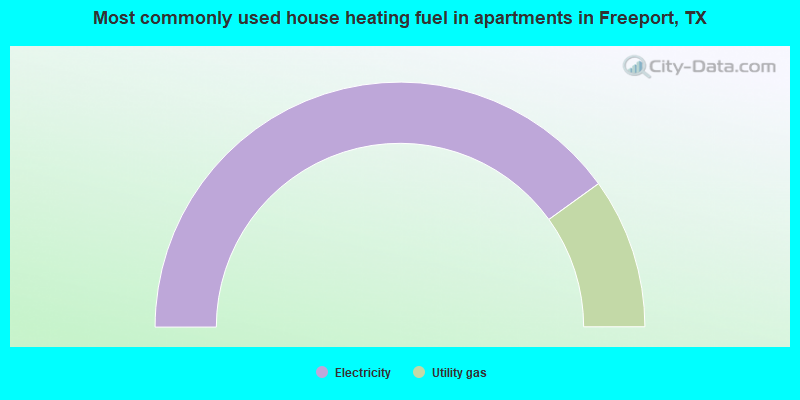
House heating fuel used in apartments - Utility gas (%)
House heating fuel used in apartments - Bottled, tank, or LP gas (%)
House heating fuel used in apartments - Electricity (%)
House heating fuel used in apartments - Fuel oil, kerosene, etc. (%)
House heating fuel used in apartments - Coal or coke (%)
House heating fuel used in apartments - Wood (%)
House heating fuel used in apartments - Solar energy (%)
House heating fuel used in apartments - Other fuel (%)
House heating fuel used in apartments - No fuel used (%)
Armed forces status - In Armed Forces (%)
Armed forces status - Civilian (%)
Armed forces status - Civilian - Veteran (%)
Armed forces status - Civilian - Nonveteran (%)
Fatal accidents locations in years 2005-2021
Fatal accidents locations in 2005
Fatal accidents locations in 2006
Fatal accidents locations in 2007
Fatal accidents locations in 2008
Fatal accidents locations in 2009
Fatal accidents locations in 2010
Fatal accidents locations in 2011
Fatal accidents locations in 2012
Fatal accidents locations in 2013
Fatal accidents locations in 2014
Fatal accidents locations in 2015
Fatal accidents locations in 2016
Fatal accidents locations in 2017
Fatal accidents locations in 2018
Fatal accidents locations in 2019
Fatal accidents locations in 2020
Fatal accidents locations in 2021
Alcohol use - People drinking some alcohol every month (%)
Alcohol use - People not drinking at all (%)
Alcohol use - Average days/month drinking alcohol
Alcohol use - Average drinks/week
Alcohol use - Average days/year people drink much
Audiometry - Average condition of hearing (%)
Audiometry - People that can hear a whisper from across a quiet room (%)
Audiometry - People that can hear normal voice from across a quiet room (%)
Audiometry - Ears ringing, roaring, buzzing (%)
Audiometry - Had a job exposure to loud noise (%)
Audiometry - Had off-work exposure to loud noise (%)
Blood Pressure & Cholesterol - Has high blood pressure (%)
Blood Pressure & Cholesterol - Checking blood pressure at home (%)
Blood Pressure & Cholesterol - Frequently checking blood cholesterol (%)
Blood Pressure & Cholesterol - Has high cholesterol level (%)
Consumer Behavior - Money monthly spent on food at supermarket/grocery store
Consumer Behavior - Money monthly spent on food at other stores
Consumer Behavior - Money monthly spent on eating out
Consumer Behavior - Money monthly spent on carryout/delivered foods
Consumer Behavior - Income spent on food at supermarket/grocery store (%)
Consumer Behavior - Income spent on food at other stores (%)
Consumer Behavior - Income spent on eating out (%)
Consumer Behavior - Income spent on carryout/delivered foods (%)
Current Health Status - General health condition (%)
Current Health Status - Blood donors (%)
Current Health Status - Has blood ever tested for HIV virus (%)
Current Health Status - Left-handed people (%)
Dermatology - People using sunscreen (%)
Diabetes - Diabetics (%)
Diabetes - Had a blood test for high blood sugar (%)
Diabetes - People taking insulin (%)
Diet Behavior & Nutrition - Diet health (%)
Diet Behavior & Nutrition - Milk product consumption (# of products/month)
Diet Behavior & Nutrition - Meals not home prepared (#/week)
Diet Behavior & Nutrition - Meals from fast food or pizza place (#/week)
Diet Behavior & Nutrition - Ready-to-eat foods (#/month)
Diet Behavior & Nutrition - Frozen meals/pizza (#/month)
Drug Use - People that ever used marijuana or hashish (%)
Drug Use - Ever used hard drugs (%)
Drug Use - Ever used any form of cocaine (%)
Drug Use - Ever used heroin (%)
Drug Use - Ever used methamphetamine (%)
Health Insurance - People covered by health insurance (%)
Kidney Conditions-Urology - Avg. # of times urinating at night
Medical Conditions - People with asthma (%)
Medical Conditions - People with anemia (%)
Medical Conditions - People with psoriasis (%)
Medical Conditions - People with overweight (%)
Medical Conditions - Elderly people having difficulties in thinking or remembering (%)
Medical Conditions - People who ever received blood transfusion (%)
Medical Conditions - People having trouble seeing even with glass/contacts (%)
Medical Conditions - People with arthritis (%)
Medical Conditions - People with gout (%)
Medical Conditions - People with congestive heart failure (%)
Medical Conditions - People with coronary heart disease (%)
Medical Conditions - People with angina pectoris (%)
Medical Conditions - People who ever had heart attack (%)
Medical Conditions - People who ever had stroke (%)
Medical Conditions - People with emphysema (%)
Medical Conditions - People with thyroid problem (%)
Medical Conditions - People with chronic bronchitis (%)
Medical Conditions - People with any liver condition (%)
Medical Conditions - People who ever had cancer or malignancy (%)
Mental Health - People who have little interest in doing things (%)
Mental Health - People feeling down, depressed, or hopeless (%)
Mental Health - People who have trouble sleeping or sleeping too much (%)
Mental Health - People feeling tired or having little energy (%)
Mental Health - People with poor appetite or overeating (%)
Mental Health - People feeling bad about themself (%)
Mental Health - People who have trouble concentrating on things (%)
Mental Health - People moving or speaking slowly or too fast (%)
Mental Health - People having thoughts they would be better off dead (%)
Oral Health - Average years since last visit a dentist
Oral Health - People embarrassed because of mouth (%)
Oral Health - People with gum disease (%)
Oral Health - General health of teeth and gums (%)
Oral Health - Average days a week using dental floss/device
Oral Health - Average days a week using mouthwash for dental problem
Oral Health - Average number of teeth
Pesticide Use - Households using pesticides to control insects (%)
Pesticide Use - Households using pesticides to kill weeds (%)
Physical Activity - People doing vigorous-intensity work activities (%)
Physical Activity - People doing moderate-intensity work activities (%)
Physical Activity - People walking or bicycling (%)
Physical Activity - People doing vigorous-intensity recreational activities (%)
Physical Activity - People doing moderate-intensity recreational activities (%)
Physical Activity - Average hours a day doing sedentary activities
Physical Activity - Average hours a day watching TV or videos
Physical Activity - Average hours a day using computer
Physical Functioning - People having limitations keeping them from working (%)
Physical Functioning - People limited in amount of work they can do (%)
Physical Functioning - People that need special equipment to walk (%)
Physical Functioning - People experiencing confusion/memory problems (%)
Physical Functioning - People requiring special healthcare equipment (%)
Prescription Medications - Average number of prescription medicines taking
Preventive Aspirin Use - Adults 40+ taking low-dose aspirin (%)
Reproductive Health - Vaginal deliveries (%)
Reproductive Health - Cesarean deliveries (%)
Reproductive Health - Deliveries resulted in a live birth (%)
Reproductive Health - Pregnancies resulted in a delivery (%)
Reproductive Health - Women breastfeeding newborns (%)
Reproductive Health - Women that had a hysterectomy (%)
Reproductive Health - Women that had both ovaries removed (%)
Reproductive Health - Women that have ever taken birth control pills (%)
Reproductive Health - Women taking birth control pills (%)
Reproductive Health - Women that have ever used Depo-Provera or injectables (%)
Reproductive Health - Women that have ever used female hormones (%)
Sexual Behavior - People 18+ that ever had sex (vaginal, anal, or oral) (%)
Sexual Behavior - Males 18+ that ever had vaginal sex with a woman (%)
Sexual Behavior - Males 18+ that ever performed oral sex on a woman (%)
Sexual Behavior - Males 18+ that ever had anal sex with a woman (%)
Sexual Behavior - Males 18+ that ever had any sex with a man (%)
Sexual Behavior - Females 18+ that ever had vaginal sex with a man (%)
Sexual Behavior - Females 18+ that ever performed oral sex on a man (%)
Sexual Behavior - Females 18+ that ever had anal sex with a man (%)
Sexual Behavior - Females 18+ that ever had any kind of sex with a woman (%)
Sexual Behavior - Average age people first had sex
Sexual Behavior - Average number of female sex partners in lifetime (males 18+)
Sexual Behavior - Average number of female vaginal sex partners in lifetime (males 18+)
Sexual Behavior - Average age people first performed oral sex on a woman (18+)
Sexual Behavior - Average number of woman performed oral sex on in lifetime (18+)
Sexual Behavior - Average number of male sex partners in lifetime (males 18+)
Sexual Behavior - Average number of male anal sex partners in lifetime (males 18+)
Sexual Behavior - Average age people first performed oral sex on a man (18+)
Sexual Behavior - Average number of male oral sex partners in lifetime (18+)
Sexual Behavior - People using protection when performing oral sex (%)
Sexual Behavior - Average number of times people have vaginal or anal sex a year
Sexual Behavior - People having sex without condom (%)
Sexual Behavior - Average number of male sex partners in lifetime (females 18+)
Sexual Behavior - Average number of male vaginal sex partners in lifetime (females 18+)
Sexual Behavior - Average number of female sex partners in lifetime (females 18+)
Sexual Behavior - Circumcised males 18+ (%)
Sleep Disorders - Average hours sleeping at night
Sleep Disorders - People that has trouble sleeping (%)
Smoking-Cigarette Use - People smoking cigarettes (%)
Taste & Smell - People 40+ having problems with smell (%)
Taste & Smell - People 40+ having problems with taste (%)
Taste & Smell - People 40+ that ever had wisdom teeth removed (%)
Taste & Smell - People 40+ that ever had tonsils teeth removed (%)
Taste & Smell - People 40+ that ever had a loss of consciousness because of a head injury (%)
Taste & Smell - People 40+ that ever had a broken nose or other serious injury to face or skull (%)
Taste & Smell - People 40+ that ever had two or more sinus infections (%)
Weight - Average height (inches)
Weight - Average weight (pounds)
Weight - Average BMI
Weight - People that are obese (%)
Weight - People that ever were obese (%)
Weight - People trying to lose weight (%)
Officers per 1,000 residents here:
2.64Texas average:
2.07
Latest news from Freeport, TX collected exclusively by city-data.com from local newspapers, TV, and radio stations
Ancestries: American (9.1%), English (2.7%), Irish (1.4%).
Current Local Time:
Land area: 11.9 square miles.
Population density: 888 people per square mile (low).
1,102 residents are foreign born (9.7% Latin America ).
This city:
9.9%Texas:
17.1%
Median real estate property taxes paid for housing units with mortgages in 2022: $3,465 (1.7%)Median real estate property taxes paid for housing units with no mortgage in 2022: $971 (0.8%)
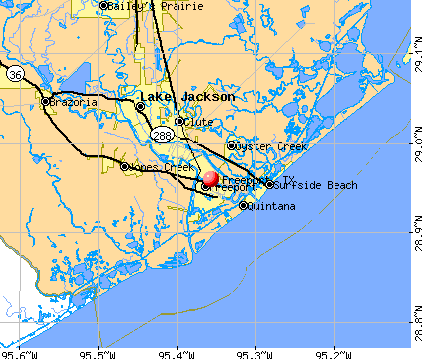
Nearest city with pop. 50,000+: Brazosport, TX (2.9 miles
Nearest city with pop. 200,000+: Houston, TX
Nearest cities:
Quintana, TX (1.8 miles),
Latitude: 28.96 N, Longitude: 95.36 W
Freeport nicknames or aliases (official or unofficial):
Da Watta, Watta Town, F.P.T, El AguaDaytime population change due to commuting: +7,800 (+70.1%)Workers who live and work in this city: 984 (23.2%)
Single-family new house construction building permits:
2022: 7 buildings , average cost: $200,0002021: 18 buildings , average cost: $173,3002020: 16 buildings , average cost: $143,6002019: 20 buildings , average cost: $180,8002018: 26 buildings , average cost: $162,0002017: 33 buildings , average cost: $156,0002016: 30 buildings , average cost: $150,5002015: 11 buildings , average cost: $166,9002014: 6 buildings , average cost: $289,8002013: 7 buildings , average cost: $139,3002012: 5 buildings , average cost: $91,9002011: 7 buildings , average cost: $71,3002010: 9 buildings , average cost: $76,4002009: 7 buildings , average cost: $85,9002008: 4 buildings , average cost: $87,0002007: 10 buildings , average cost: $105,9002006: 7 buildings , average cost: $54,7002005: 7 buildings , average cost: $52,4002004: 4 buildings , average cost: $60,5002003: 8 buildings , average cost: $92,2002002: 10 buildings , average cost: $99,4002001: 5 buildings , average cost: $70,7002000: 9 buildings , average cost: $80,9001999: 6 buildings , average cost: $57,7001998: 6 buildings , average cost: $75,5001997: 7 buildings , average cost: $91,400Unemployment in December 2023:
Population change in the 1990s: +1,035 (+8.9%).
Most common occupations in Freeport, TX (%)
Both Males Females
Building and grounds cleaning and maintenance occupations (7.1%)
Other production occupations, including supervisors (6.5%)
Cashiers (4.6%)
Other management occupations, except farmers and farm managers (4.5%)
Retail sales workers, except cashiers (4.5%)
Carpenters (4.4%)
Construction traders workers except carpenters, electricians, painters, plumbers, and construction laborers (4.2%)
Other production occupations, including supervisors (9.8%)
Carpenters (7.7%)
Construction traders workers except carpenters, electricians, painters, plumbers, and construction laborers (6.9%)
Building and grounds cleaning and maintenance occupations (5.4%)
Other management occupations, except farmers and farm managers (5.1%)
Construction laborers (4.9%)
Laborers and material movers, hand (4.9%)
Cashiers (9.7%)
Building and grounds cleaning and maintenance occupations (9.3%)
Other office and administrative support workers, including supervisors (6.9%)
Retail sales workers, except cashiers (6.7%)
Preschool, kindergarten, elementary, and middle school teachers (4.7%)
Information and record clerks, except customer service representatives (3.7%)
Other management occupations, except farmers and farm managers (3.7%)
Air pollution and air quality trends(lower is better)
AQI NO2 Ozone
Tornado activity:
Freeport-area historical tornado activity is slightly below Texas state average. It is 9% greater than the overall U.S. average.
On 4/18/1966, a category F3 (max. wind speeds 158-206 mph) tornado 9.5 miles away from the Freeport city center .
On 4/11/1969, a category F3 tornado 20.9 miles away from the city center injured 13 people and caused between $500,000 and $5,000,000 in damages.
Earthquake activity:
Freeport-area historical earthquake activity is significantly above Texas state average. It is 46% smaller than the overall U.S. average. On 10/20/2011 at 12:24:41, a magnitude 4.8 (4.8 MW, Depth: 3.1 mi, Class: Light, Intensity: IV - V) earthquake occurred 164.9 miles away from Freeport center On 5/17/2012 at 08:12:00, a magnitude 4.8 (4.8 MW, Depth: 3.1 mi) earthquake occurred 213.5 miles away from Freeport center On 4/9/1993 at 12:29:19, a magnitude 4.3 (4.1 MB, 4.3 LG, Depth: 3.1 mi) earthquake occurred 167.9 miles away from the city center On 9/2/2013 at 23:51:15, a magnitude 4.3 (4.3 MW, Depth: 2.9 mi) earthquake occurred 211.4 miles away from the city center On 5/1/2018 at 16:28:56, a magnitude 4.0 (4.0 MW, Depth: 3.1 mi) earthquake occurred 160.1 miles away from Freeport center On 9/2/2013 at 21:52:38, a magnitude 4.2 (4.2 MW, Depth: 3.0 mi) earthquake occurred 213.7 miles away from Freeport center Magnitude types: regional Lg-wave magnitude (LG), body-wave magnitude (MB), moment magnitude (MW) Natural disasters: The number of natural disasters in Brazoria County (26) is a lot greater than the US average (15).Major Disasters (Presidential) Declared: 18Emergencies Declared: 6Storms: 12, Floods: 10, Hurricanes: 10, Tornadoes: 5, Tropical Storms: 2, Winds: 2, Fire: 1, Flash Flood: 1, Other: 1 (Note: some incidents may be assigned to more than one category). Hospitals and medical centers near Freeport: WOODLAKE NURSING HOME (Nursing Home, about 5 miles away; CLUTE, TX)
LAKE JACKSON HEALTHCARE CENTER (Nursing Home, about 6 miles away; LAKE JACKSON, TX)
LAKE JACKSON NH INC (Nursing Home, about 6 miles away; LAKE JACKSON, TX)
CREEKSIDE VILLAGE HEALTHCARE (Nursing Home, about 6 miles away; CLUTE, TX)
HELPING HANDS AND HEARTS HOSPICE (Hospital, about 7 miles away; LAKE JACKSON, TX)
BRAZOSPORT REGIONAL HEALTH SYSTEM (about 8 miles away; LAKE JACKSON, TX)
BRAZOSPORT TRANSITIONAL CARE CENTER (Nursing Home, about 8 miles away; LAKE JACKSON, TX)
Colleges/universities with over 2000 students nearest to Freeport:
Brazosport College (about 7 miles; Lake Jackson, TX ; Full-time enrollment: 2,573)
Alvin Community College (about 32 miles; Alvin, TX ; FT enrollment: 3,953)
College of the Mainland (about 38 miles; Texas City, TX ; FT enrollment: 2,739)
The University of Texas Medical Branch (about 43 miles; Galveston, TX ; FT enrollment: 2,314)
University of Houston-Clear Lake (about 46 miles; Houston, TX ; FT enrollment: 5,833)
San Jacinto Community College (about 51 miles; Pasadena, TX ; FT enrollment: 13,517)
Wharton County Junior College (about 51 miles; Wharton, TX ; FT enrollment: 5,009)
Public high school in Freeport: BRAZOSPORT H S Students: 1,104, Location: 1800 W SECOND ST, Grades: 9-12)Public elementary/middle schools in Freeport: VELASCO EL Students: 597, Location: 401 N GULF BLVD, Grades: PK-4)FREEPORT INT Students: 558, Location: 1815 W FOURTH ST, Grades: 7-8)JANE LONG EL Students: 526, Location: 1200 W ELEVENTH ST, Grades: PK-4)O'HARA LANIER MIDDLE Students: 423, Location: 522 N AVE B, Grades: 5-6)O A FLEMING EL Students: 330, Location: 431 W FOURTH ST, Grades: PK-4)See full list of schools located in Freeport
Notable locations in Freeport: (A) , Bridge Harbor Yacht Club Marina (B) , Freeport Fire Department / Emergency Medical Services (C) , Surfside Beach Fire Department (D) , Freeport Fire Department Station 2 (E) . Display/hide their locations on the map
Churches in Freeport include: (A) , West End Church (B) . Display/hide their locations on the map
Cemetery: (1) . Display/hide its location on the map
Lake: (A) . Display/hide its location on the map
Parks in Freeport include: (1) , Arrington Park (2) , Hopper Stadium (3) , Austin Park (4) . Display/hide their locations on the map
Tourist attractions: (1) , Bingo Boards (Amusement & Theme Parks; 18 Fort Velasco Drive) (2) , Coastal Amusement Inc (Amusement & Theme Parks; 130 West Broad Street) (3) . Display/hide their approximate locations on the map
Hotels: (1) , Anchor Motel (1302 Blue Water Highway) (2) , Cedar Sands Motel (343 Beach Front Drive) (3) . Display/hide their approximate locations on the map
Birthplace of: Phil Huffman - Baseball player, Andy Beene - Baseball player, Jared Wells - Baseball player, Troy Neel - Baseball player, Andy Cavazos - Baseball player, Cedric Mack - Football player, Stevin Ozier - College basketball player (Texas Arlington Mavericks), Ray Waddy - Football player.
Brazoria County has a predicted average indoor radon screening level less than 2 pCi/L (pico curies per liter) - Low Potential Drinking water stations with addresses in Freeport and their reported violations in the past:
PEREGRINE TOWNHOMES SAN LUIS PASS (Population served: 126, Groundwater):
Past monitoring violations:
8 routine major monitoring violations
Population served: 57, Groundwater):
Past monitoring violations:
Follow-up Or Routine LCR Tap M/R - In OCT-01-2013, Contaminant: Lead and Copper Rule
Monitoring and Reporting (DBP) - Between JAN-2009 and MAR-2009, Contaminant: Chlorine. Follow-up actions: St Public Notif requested (JUL-21-2009), St Violation/Reminder Notice (JUL-21-2009), St Compliance achieved (JAN-07-2011)
One routine major monitoring violation
Drinking water stations with addresses in Freeport that have no violations reported:
ANGLECREST SUBDIVISION (Population served: 198, Primary Water Source Type: Groundwater)
BERNARD RIVER OAKS (Population served: 48, Primary Water Source Type: Groundwater)
DOW CHEMICAL HANGER FACILITY (Population served: 36, Primary Water Source Type: Groundwater)
Average household size: This city:
3.1 peopleTexas:
2.8 people
Percentage of family households: This city:
75.7%Whole state:
69.9%
Percentage of households with unmarried partners: This city:
8.6%Whole state:
6.0%
Likely homosexual households (counted as self-reported same-sex unmarried-partner households)
Lesbian couples: 0.3% of all households Gay men: 0.1% of all households
People in group quarters in Freeport in 2010:
41 people in emergency and transitional shelters (with sleeping facilities) for people experiencing homelessness
29 people in residential treatment centers for adults
3 people in local jails and other municipal confinement facilities
people in local jails and other confinement facilities (including police lockups) in 2000people in other noninstitutional group quarters in 2000Banks with branches in Freeport (2011 data):
Texas Gulf Bank, National Association: Freeport Branch at 1400 Brazosport Boulevard, branch established on 1955/06/22; at 200 West Second Street, branch established on 1913/07/13. Info updated 2006/11/03: Bank assets: $416.4 mil, Deposits: $369.6 mil, local headquarters , positive income , Commercial Lending Specialization, 8 total offices , Holding Company: Texas Gulf Bancshares, Inc.
International Bank of Commerce: Freeport Branch at 1208 North Brazosport, branch established on 1949/12/30. Info updated 2007/03/28: Bank assets: $9,621.9 mil, Deposits: $6,548.8 mil, headquarters in Laredo, TX, positive income , Commercial Lending Specialization, 197 total offices , Holding Company: International Bancshares Corporation
For population 15 years and over in Freeport:
Never married: 33.2%Now married: 46.4%Separated: 3.2%Widowed: 6.9%Divorced: 10.4% For population 25 years and over in Freeport:
High school or higher: 79.1%Bachelor's degree or higher: 6.4%Graduate or professional degree: 1.1%Unemployed: 13.7%Mean travel time to work (commute): 29.7 minutes
Education Gini index (Inequality in education) Here:
19.5Texas average:
14.0
Religion statistics for Freeport, TX (based on Brazoria County data)
Religion Adherents Congregations Evangelical Protestant 98,539 226 Catholic 50,863 12 Mainline Protestant 17,854 45 Other 9,752 19 Black Protestant 1,454 13 Orthodox - - None 134,704 -
Source: Clifford Grammich, Kirk Hadaway, Richard Houseal, Dale E.Jones, Alexei Krindatch, Richie Stanley and Richard H.Taylor. 2012. 2010 U.S.Religion Census: Religious Congregations & Membership Study. Association of Statisticians of American Religious Bodies. Jones, Dale E., et al. 2002. Congregations and Membership in the United States 2000. Nashville, TN: Glenmary Research Center. Graphs represent county-level data
Food Environment Statistics: Number of grocery stores : 29Brazoria County :
0.99 / 10,000 pop.State :
1.47 / 10,000 pop.
Number of supercenters and club stores : 6Here :
0.20 / 10,000 pop.State :
0.14 / 10,000 pop.
Number of convenience stores (no gas) : 33Brazoria County :
1.13 / 10,000 pop.State :
1.11 / 10,000 pop.
Number of convenience stores (with gas) : 121Brazoria County :
4.13 / 10,000 pop.Texas :
3.95 / 10,000 pop.
Number of full-service restaurants : 132This county :
4.50 / 10,000 pop.State :
6.13 / 10,000 pop.
Adult diabetes rate : Brazoria County :
9.6%Texas :
8.9%
Adult obesity rate : Brazoria County :
29.1%Texas :
26.6%
Low-income preschool obesity rate : This county :
15.7%State :
15.7%
Health and Nutrition: Healthy diet rate : Freeport:
46.1%State:
48.6%
Average overall health of teeth and gums : This city:
44.3%State:
47.4%
People feeling badly about themselves : This city:
22.0%Texas:
20.6%
People not drinking alcohol at all : This city:
11.2%State:
10.3%
Average hours sleeping at night : Overweight people : This city:
31.9%Texas:
33.1%
General health condition : Freeport:
53.4%State:
56.2%
Average condition of hearing : Freeport:
80.5%Texas:
80.7%
More about Health and Nutrition of Freeport, TX Residents
Local government employment and payroll (March 2022)
Function
Full-time employees
Monthly full-time payroll
Average yearly full-time wage
Part-time employees
Monthly part-time payroll
Police Protection - Officers
34 $187,566 $66,200 0 $0 Parks and Recreation
27 $87,072 $38,699 8 $6,353 Streets and Highways
14 $55,900 $47,914 0 $0 Firefighters
12 $68,311 $68,311 0 $0 Police - Other
9 $32,703 $43,604 3 $1,329 Other and Unallocable
8 $37,375 $56,063 0 $0 Other Government Administration
7 $40,528 $69,477 0 $0 Financial Administration
4 $23,914 $71,742 0 $0 Fire - Other
3 $22,745 $90,980 0 $0 Health
3 $9,632 $38,528 0 $0 Judicial and Legal
2 $8,326 $49,956 0 $0
Totals for Government
123 $574,071 $56,007 11 $7,681
Freeport government finances - Expenditure in 2021 (per resident):
Current Operations - Police Protection: $4,528,000 ($429.36)
Water Utilities: $3,288,000 ($311.78)Parks and Recreation: $2,802,000 ($265.69)Local Fire Protection: $2,034,000 ($192.87)Central Staff Services: $1,901,000 ($180.26)Sewerage: $1,777,000 ($168.50)Regular Highways: $1,327,000 ($125.83)Solid Waste Management: $981,000 ($93.02)Protective Inspection and Regulation - Other: $622,000 ($58.98)General - Other: $483,000 ($45.80)Judicial and Legal Services: $186,000 ($17.64)General - Interest on Debt: $43,000 ($4.08)
Total Salaries and Wages: $7,021,000 ($665.75)
Freeport government finances - Revenue in 2021 (per resident):
Charges - Sewerage: $1,815,000 ($172.10)
Solid Waste Management: $922,000 ($87.43)Parks and Recreation: $580,000 ($55.00)Other: $478,000 ($45.33)Federal Intergovernmental - General Local Government Support: $182,000 ($17.26)
Other: $78,000 ($7.40)Natural Resources: $12,000 ($1.14)Miscellaneous - General Revenue - Other: $7,640,000 ($724.45)
Rents: $253,000 ($23.99)Fines and Forfeits: $249,000 ($23.61)Interest Earnings: $85,000 ($8.06)Sale of Property: $9,000 ($0.85)Revenue - Water Utilities: $2,801,000 ($265.60)
State Intergovernmental - Other: $109,000 ($10.34)
General Local Government Support: $24,000 ($2.28)Tax - Property: $3,132,000 ($296.98)
General Sales and Gross Receipts: $3,072,000 ($291.30)Public Utilities Sales: $606,000 ($57.46)Other License: $115,000 ($10.90)Occupation and Business License - Other: $11,000 ($1.04)Amusements Sales: $1,000 ($0.09)
Freeport government finances - Debt in 2021 (per resident):
Long Term Debt - Outstanding Unspecified Public Purpose: $8,295,000 ($786.55)
Issue, Unspecified Public Purpose: $7,735,000 ($733.45)Beginning Outstanding - Unspecified Public Purpose: $1,080,000 ($102.41)Retired Unspecified Public Purpose: $520,000 ($49.31)
Freeport government finances - Cash and Securities in 2021 (per resident):
Bond Funds - Cash and Securities: $8,004,000 ($758.96)
Other Funds - Cash and Securities: $8,974,000 ($850.94)
Sinking Funds - Cash and Securities: $54,000 ($5.12)
9.23% of this county's 2021 resident taxpayers lived in other counties in 2020 ($61,623 average adjusted gross income )
Here:
9.23%Texas average:
8.12%
0.01% of residents moved from foreign countries ($81 average AGI )Brazoria County:
0.01%Texas average:
0.04%
Top counties from which taxpayers relocated into this county between 2020 and 2021:
7.66% of this county's 2020 resident taxpayers moved to other counties in 2021 ($65,675 average adjusted gross income )
Here:
7.66%Texas average:
7.40%
0.02% of residents moved to foreign countries ($135 average AGI )Brazoria County:
0.02%Texas average:
0.03%
Top counties to which taxpayers relocated from this county between 2020 and 2021:
Businesses in Freeport, TX
Name Count Name Count
AutoZone 1 Jack In The Box 1 CVS 1 Little Caesars Pizza 1 Church's Chicken 1 McDonald's 1 Cricket Wireless 2 Pizza Hut 1 Domino's Pizza 1 SONIC Drive-In 1 FedEx 2 U-Haul 1 H&R Block 1 UPS 1
Strongest AM radio stations in Freeport:
KBRZ (1460 AM; 0 kW; FREEPORT, TX; Owner: ALELUYA CHRISTIAN BROADCASTING, INC.)
KILE (1560 AM; 50 kW; BELLAIRE, TX; Owner: THE RAFTT CORPORATION)
KTRH (740 AM; 50 kW; HOUSTON, TX; Owner: AMFM TEXAS LICENSES LIMITED PARTNERSHIP)
KGOL (1180 AM; 50 kW; HUMBLE, TX; Owner: ENTRAVISION HOLDINGS, LLC)
KEYH (850 AM; 10 kW; HOUSTON, TX; Owner: LIBERMAN BROADCASTING OF HOUSTON LICENSE CORP.)
KYST (920 AM; 5 kW; TEXAS CITY, TX; Owner: HISPANIC BROADCASTING, INC.)
KSEV (700 AM; 15 kW; TOMBALL, TX; Owner: LIBERMAN BROADCASTING OF HOUSTON LICENSE CORP.)
KCTA (1030 AM; 50 kW; CORPUS CHRISTI, TX; Owner: BROADCASTING CORPORATION OF THE SOUTHWEST)
KTEK (1110 AM; daytime; 2 kW; ALVIN, TX; Owner: SOUTH TEXAS BROADCASTING, INC.)
KLAT (1010 AM; 10 kW; HOUSTON, TX; Owner: TICHENOR LICENSE CORPORATION ("TLC"))
KRTX (980 AM; 5 kW; ROSENBURG/RICHMOND, TX)
KTKR (760 AM; 50 kW; SAN ANTONIO, TX; Owner: CCB TEXAS LICENSES, L.P.)
KKHT (1070 AM; 10 kW; HOUSTON, TX; Owner: SOUTH TEXAS BROADCASTING, INC.)
Strongest FM radio stations in Freeport:
K216BX (91.1 FM; LAKE JACKSON, TX; Owner: KSBJ EDUCATIONAL FOUNDATION)
K201FA (88.1 FM; FREEPORT, TX; Owner: PAULINO BERNAL EVANGELISM)
KYBJ (91.1 FM; LAKE JACKSON, TX; Owner: EDUCATIONAL MEDIA FOUNDATION OF BRAZOSPORT, INC)
KLDE (107.5 FM; LAKE JACKSON, TX; Owner: CXR HOLDINGS, INC.)
KJOJ-FM (103.3 FM; FREEPORT, TX; Owner: LIBERMAN BROADCASTING OF HOUSTON LICENSE CORP.)
KOVE-FM (106.5 FM; GALVESTON, TX; Owner: HBC LICENSE CORPORATION)
KRTS (92.1 FM; SEABROOK, TX; Owner: KRTS, INC.)
KRBE (104.1 FM; HOUSTON, TX; Owner: KRBE LICO, INC.)
KBXX (97.9 FM; HOUSTON, TX; Owner: RADIO ONE LICENSES, LLC)
KHJZ-FM (95.7 FM; HOUSTON, TX; Owner: TEXAS INFINITY BROADCASTING L.P.)
KHMX (96.5 FM; HOUSTON, TX; Owner: CITICASTERS LICENSES, L.P.)
KILT-FM (100.3 FM; HOUSTON, TX; Owner: TEXAS INFINITY BROADCASTING L.P.)
KKBQ-FM (92.9 FM; PASADENA, TX; Owner: CXR HOLDINGS, INC.)
KLOL (101.1 FM; HOUSTON, TX; Owner: AMFM TEXAS LICENSES LIMITED PARTNERSHIP)
KODA (99.1 FM; HOUSTON, TX; Owner: AMFM TEXAS LICENSES LIMITED PARTNERSHIP)
KTBZ-FM (94.5 FM; HOUSTON, TX; Owner: AMFM TEXAS LICENSES LIMITED PARTNERSHIP)
KUHF (88.7 FM; HOUSTON, TX; Owner: UNIVERSITY OF HOUSTON SYSTEM)
KKRW (93.7 FM; HOUSTON, TX; Owner: CAPSTAR TX LIMITED PARTNERSHIP)
KHCB-FM (105.7 FM; HOUSTON, TX; Owner: HOUSTON CHRISTIAN BROADCASTERS, INC.)
KMJQ (102.1 FM; HOUSTON, TX; Owner: RADIO ONE LICENSES, LLC)
TV broadcast stations around Freeport:
K30DN (Channel 30; FREEPORT, TX; Owner: GERALD R. PROCTOR)
KAZH (Channel 57; BAYTOWN, TX; Owner: KAZH LICENSE, LLC)
KLTJ (Channel 22; GALVESTON, TX; Owner: WORD OF GOD FELLOWSHIP, INC.)
KJIB-LP (Channel 5; CLEAR LAKE CITY, TX; Owner: FAR EASTERN TELECASTERS)
KHOU-TV (Channel 11; HOUSTON, TX; Owner: KHOU-TV, L.P.)
KPRC-TV (Channel 2; HOUSTON, TX; Owner: POST-NEWSWEEK STATIONS, HOUSTON, LP)
KTMD (Channel 48; GALVESTON, TX; Owner: TELEMUNDO OF TEXAS PARTNERSHIP, LP)
KNWS-TV (Channel 51; KATY, TX; Owner: JOHNSON BROADCASTING, INC.)
KXLN-TV (Channel 45; ROSENBERG, TX; Owner: KXLN LICENSE PARTNERSHIP, L.P.)
KTBU (Channel 55; CONROE, TX; Owner: HUMANITY INTERESTED MEDIA, INC.)
KTXH (Channel 20; HOUSTON, TX; Owner: FOX TELEVISION STATIONS, INC.)
KHWB (Channel 39; HOUSTON, TX; Owner: KHWB, INC.)
KPXB (Channel 49; CONROE, TX; Owner: PAXSON HOUSTON LICENSE, INC.)
KFTH (Channel 67; ALVIN, TX; Owner: TELEFUTURA HOUSTON LLC)
KZJL (Channel 61; HOUSTON, TX; Owner: KZJL LICENSE CORP.)
KETH (Channel 14; HOUSTON, TX; Owner: COMMUNITY EDUCATIONAL TV, INC.)
KRIV (Channel 26; HOUSTON, TX; Owner: FOX TELEVISION STATIONS, INC.)
KTRK-TV (Channel 13; HOUSTON, TX; Owner: KTRK TELEVISION, INC.)
KUHT (Channel 8; HOUSTON, TX; Owner: UNIVERSITY OF HOUSTON SYSTEM)
KVDO-LP (Channel 69; CLEAR LAKE, TX; Owner: FAR EASTERN TELECASTERS)
KBPX-LP (Channel 33; HOUSTON, TX; Owner: PAXSON COMMUNICATIONS LPTV, INC.)
KHMV-LP (Channel 28; HOUSTON, TX; Owner: PAPPAS TELECASTING OF THE GULF COAST, A CALIFORNIA LP)
KVIT-LP (Channel 28; VICTORIA, TX; Owner: CLUB COMMUNICATIONS)
National Bridge Inventory (NBI) Statistics 36 Number of bridges2,178ft / 664m Total length $615,000 Total costs192,870 Total average daily traffic17,437 Total average daily truck traffic
New bridges - historical statistics
6 1930-1939 4 1960-1969 1 1970-1979 17 1980-1989 3 1990-1999 4 2000-2009 1 2010-2019
See full National Bridge Inventory statistics for Freeport, TX
FCC Registered Cell Phone Towers: 1 (
See the full list of FCC Registered Cell Phone Towers in Freeport )
FCC Registered Antenna Towers: 195 (
See the full list of FCC Registered Antenna Towers )
FCC Registered Broadcast Land Mobile Towers: 80 (
See the full list of FCC Registered Broadcast Land Mobile Towers in Freeport, TX )
FCC Registered Microwave Towers: 186 (
See the full list of FCC Registered Microwave Towers in this town )
FCC Registered Paging Towers: 10 (
See the full list of FCC Registered Paging Towers )
FCC Registered Maritime Coast & Aviation Ground Towers: 31 (
See the full list of FCC Registered Maritime Coast & Aviation Ground Towers )
FCC Registered Amateur Radio Licenses: 48 (
See the full list of FCC Registered Amateur Radio Licenses in Freeport )
FAA Registered Aircraft: 5
Aircraft: CESSNA 150H (Category: Land, Seats: 2, Weight: Up to 12,499 Pounds, Speed: 90 mph), Engine: CONT MOTOR 0-200 SERIES (100 HP) (Reciprocating)N-Number: 50106, N50106, N-50106, Serial Number: 15069065, Year manufactured: 1968, Airworthiness Date: 06/10/1968, Certificate Issue Date: 09/09/2016Registrant (Individual): Tommy J Bartuska, 305 Cactus, Freeport, TX 77541Aircraft: GRUMMAN AMERICAN AVN. CORP. AA-5 (Category: Land, Seats: 4, Weight: Up to 12,499 Pounds, Speed: 105 mph), Engine: LYCOMING 0-320 SERIES (180 HP) (Reciprocating)N-Number: 7143L, N7143L, N-7143L, Serial Number: AA5-0443, Airworthiness Date: 10/19/1973, Certificate Issue Date: 01/05/2017Registrant (Individual): Ross Scott Boyd, 403 Leeward Way, Freeport, TX 77541Deregistered: Cancel Date: 05/01/2020Aircraft: CESSNA 172 (Category: Land, Seats: 4, Weight: Up to 12,499 Pounds, Speed: 105 mph), Engine: CONT MOTOR 0-300 SER (145 HP) (Reciprocating)N-Number: 7921B, N7921B, N-7921B, Serial Number: 29721, Year manufactured: 1957, Certificate Issue Date: 07/24/2014Registrant (Individual): Ray Newman, 4950 Cr 400, Freeport, TX 77541Deregistered: Cancel Date: 10/31/2020Aircraft: CESSNA 170B (Category: Land, Seats: 4, Weight: Up to 12,499 Pounds, Speed: 105 mph), Engine: CONT MOTOR C145 SERIES (145 HP) (Reciprocating)N-Number: 8044A, N8044A, N-8044A, Serial Number: 20896, Year manufactured: 1952, Certificate Issue Date: 03/03/1966Registrant (Individual): Jerry Turner, Po Box 2496, Freeport, TX 77541Deregistered: Cancel Date: 01/25/2019Aircraft: SOLAR WINGS PEGASUS XL-R 447 (Category: Land, Seats: 2, Weight: Up to 12,499 Pounds), Engine: ROTAX 447 (40 HP) (2 Cycle)N-Number: 447MD, N447MD, N-447MD, Serial Number: SW-WA-1308, Year manufactured: 1987, Airworthiness Date: 09/30/2007, Certificate Issue Date: 10/02/2012Registrant (Individual): Thomas R Sanders, 106 Dutch Lake Ct, Freeport, TX 77541Deregistered: Cancel Date: 02/14/2018
Home Mortgage Disclosure Act Aggregated Statistics For Year 2009(Based on 1 full and 1 partial tracts) A) FHA, FSA/RHS & VA B) Conventional C) Refinancings D) Home Improvement Loans F) Non-occupant Loans on Number Average Value Number Average Value Number Average Value Number Average Value Number Average Value
LOANS ORIGINATED 6 $74,225 4 $33,210 5 $76,804 1 $12,600 0 $0 APPLICATIONS APPROVED, NOT ACCEPTED 1 $51,430 2 $83,105 3 $101,920 1 $16,780 1 $29,790 APPLICATIONS DENIED 4 $85,940 5 $59,432 7 $83,137 11 $26,602 0 $0 APPLICATIONS WITHDRAWN 2 $133,765 23 $86,157 16 $83,296 2 $14,810 1 $99,250 FILES CLOSED FOR INCOMPLETENESS 0 $0 0 $0 0 $0 2 $40,475 0 $0
Aggregated Statistics For Year 2008(Based on 1 full and 1 partial tracts) A) FHA, FSA/RHS & VA B) Conventional C) Refinancings D) Home Improvement Loans F) Non-occupant Loans on G) Loans On Manufactured Number Average Value Number Average Value Number Average Value Number Average Value Number Average Value Number Average Value
LOANS ORIGINATED 14 $70,362 16 $94,394 18 $67,158 5 $34,286 9 $90,049 1 $13,820 APPLICATIONS APPROVED, NOT ACCEPTED 0 $0 5 $73,570 3 $89,673 0 $0 2 $56,355 1 $79,300 APPLICATIONS DENIED 3 $70,323 20 $69,920 21 $78,810 11 $17,905 5 $88,126 0 $0 APPLICATIONS WITHDRAWN 1 $70,750 16 $124,266 8 $59,499 1 $28,780 1 $57,260 0 $0 FILES CLOSED FOR INCOMPLETENESS 0 $0 2 $78,560 1 $101,240 0 $0 1 $45,540 0 $0
Aggregated Statistics For Year 2007(Based on 1 full and 1 partial tracts) A) FHA, FSA/RHS & VA B) Conventional C) Refinancings D) Home Improvement Loans E) Loans on Dwellings For 5+ Families F) Non-occupant Loans on G) Loans On Manufactured Number Average Value Number Average Value Number Average Value Number Average Value Number Average Value Number Average Value Number Average Value
LOANS ORIGINATED 15 $74,477 45 $78,206 29 $61,656 12 $40,162 1 $1,895,420 20 $63,678 1 $10,860 APPLICATIONS APPROVED, NOT ACCEPTED 1 $98,430 7 $63,463 3 $27,733 0 $0 0 $0 1 $33,680 0 $0 APPLICATIONS DENIED 6 $64,770 31 $74,962 25 $59,282 16 $22,286 0 $0 8 $75,432 2 $54,295 APPLICATIONS WITHDRAWN 2 $67,045 18 $86,683 13 $69,378 1 $49,810 0 $0 1 $34,610 0 $0 FILES CLOSED FOR INCOMPLETENESS 0 $0 3 $60,220 3 $85,290 1 $52,530 0 $0 2 $48,725 0 $0
Aggregated Statistics For Year 2006(Based on 1 full and 1 partial tracts) A) FHA, FSA/RHS & VA B) Conventional C) Refinancings D) Home Improvement Loans F) Non-occupant Loans on G) Loans On Manufactured Number Average Value Number Average Value Number Average Value Number Average Value Number Average Value Number Average Value
LOANS ORIGINATED 9 $69,318 37 $62,786 28 $65,395 9 $27,031 12 $90,914 1 $34,380 APPLICATIONS APPROVED, NOT ACCEPTED 0 $0 9 $116,476 3 $140,370 1 $16,060 2 $181,405 1 $61,210 APPLICATIONS DENIED 1 $97,190 24 $56,394 30 $57,088 11 $34,790 4 $53,702 2 $58,160 APPLICATIONS WITHDRAWN 1 $52,590 25 $62,157 26 $72,588 1 $44,730 5 $42,394 0 $0 FILES CLOSED FOR INCOMPLETENESS 0 $0 0 $0 5 $106,174 0 $0 2 $88,515 0 $0
Aggregated Statistics For Year 2005(Based on 1 full and 1 partial tracts) A) FHA, FSA/RHS & VA B) Conventional C) Refinancings D) Home Improvement Loans E) Loans on Dwellings For 5+ Families F) Non-occupant Loans on G) Loans On Manufactured Number Average Value Number Average Value Number Average Value Number Average Value Number Average Value Number Average Value Number Average Value
LOANS ORIGINATED 10 $62,738 42 $41,496 29 $55,088 6 $26,260 1 $1,776,960 15 $52,801 0 $0 APPLICATIONS APPROVED, NOT ACCEPTED 1 $76,010 16 $53,841 10 $54,887 1 $17,080 0 $0 0 $0 0 $0 APPLICATIONS DENIED 3 $85,287 35 $75,473 61 $58,957 16 $24,186 0 $0 17 $58,609 6 $64,247 APPLICATIONS WITHDRAWN 1 $66,140 13 $218,024 26 $87,104 7 $127,299 1 $42,450 2 $999,365 0 $0 FILES CLOSED FOR INCOMPLETENESS 1 $44,420 3 $112,383 5 $113,504 0 $0 0 $0 1 $332,300 1 $44,420
Aggregated Statistics For Year 2004(Based on 1 full and 1 partial tracts) A) FHA, FSA/RHS & VA B) Conventional C) Refinancings D) Home Improvement Loans F) Non-occupant Loans on G) Loans On Manufactured Number Average Value Number Average Value Number Average Value Number Average Value Number Average Value Number Average Value
LOANS ORIGINATED 11 $62,202 22 $63,308 33 $64,673 13 $20,429 9 $42,777 0 $0 APPLICATIONS APPROVED, NOT ACCEPTED 0 $0 13 $65,678 17 $44,372 1 $70,550 1 $70,880 2 $32,000 APPLICATIONS DENIED 3 $60,193 25 $67,222 49 $58,898 23 $17,840 11 $55,797 2 $35,545 APPLICATIONS WITHDRAWN 2 $67,710 11 $55,636 26 $57,241 4 $18,532 2 $74,280 1 $34,550 FILES CLOSED FOR INCOMPLETENESS 1 $141,170 1 $24,940 9 $72,728 0 $0 0 $0 0 $0
Aggregated Statistics For Year 2003(Based on 1 full and 1 partial tracts) A) FHA, FSA/RHS & VA B) Conventional C) Refinancings D) Home Improvement Loans F) Non-occupant Loans on Number Average Value Number Average Value Number Average Value Number Average Value Number Average Value
LOANS ORIGINATED 12 $57,951 18 $51,551 38 $52,866 4 $13,800 11 $45,994 APPLICATIONS APPROVED, NOT ACCEPTED 0 $0 4 $63,455 9 $38,712 0 $0 2 $45,795 APPLICATIONS DENIED 2 $81,460 15 $45,966 52 $45,188 10 $13,679 4 $30,450 APPLICATIONS WITHDRAWN 2 $69,385 2 $62,045 31 $56,436 0 $0 1 $54,760 FILES CLOSED FOR INCOMPLETENESS 0 $0 2 $50,805 0 $0 0 $0 0 $0
Aggregated Statistics For Year 1999(Based on 1 full and 2 partial tracts) A) FHA, FSA/RHS & VA B) Conventional C) Refinancings D) Home Improvement Loans E) Loans on Dwellings For 5+ Families F) Non-occupant Loans on Number Average Value Number Average Value Number Average Value Number Average Value Number Average Value Number Average Value
LOANS ORIGINATED 18 $43,828 26 $43,524 16 $40,102 9 $14,743 2 $654,230 6 $51,893 APPLICATIONS APPROVED, NOT ACCEPTED 0 $0 5 $40,748 3 $22,460 7 $24,057 0 $0 0 $0 APPLICATIONS DENIED 1 $51,320 28 $30,935 9 $32,978 28 $9,093 0 $0 3 $22,817 APPLICATIONS WITHDRAWN 2 $53,365 8 $53,568 9 $44,301 5 $27,892 0 $0 1 $158,970 FILES CLOSED FOR INCOMPLETENESS 0 $0 0 $0 4 $43,452 0 $0 0 $0 0 $0
Detailed HMDA statistics for the following Tracts:
6643.00
, 6644.00
Private Mortgage Insurance Companies Aggregated Statistics For Year 2009(Based on 1 full tract) A) Conventional Number Average Value
LOANS ORIGINATED 1 $62,190 APPLICATIONS APPROVED, NOT ACCEPTED 0 $0 APPLICATIONS DENIED 0 $0 APPLICATIONS WITHDRAWN 0 $0 FILES CLOSED FOR INCOMPLETENESS 0 $0
Aggregated Statistics For Year 2008(Based on 1 full and 1 partial tracts) A) Conventional C) Non-occupant Loans on Number Average Value Number Average Value
LOANS ORIGINATED 5 $69,618 2 $57,535 APPLICATIONS APPROVED, NOT ACCEPTED 3 $65,380 2 $61,195 APPLICATIONS DENIED 0 $0 0 $0 APPLICATIONS WITHDRAWN 0 $0 0 $0 FILES CLOSED FOR INCOMPLETENESS 0 $0 0 $0
Aggregated Statistics For Year 2007(Based on 1 full and 1 partial tracts) A) Conventional C) Non-occupant Loans on Number Average Value Number Average Value
LOANS ORIGINATED 14 $72,755 4 $57,362 APPLICATIONS APPROVED, NOT ACCEPTED 1 $33,140 0 $0 APPLICATIONS DENIED 0 $0 0 $0 APPLICATIONS WITHDRAWN 0 $0 0 $0 FILES CLOSED FOR INCOMPLETENESS 0 $0 0 $0
Aggregated Statistics For Year 2006(Based on 1 full and 1 partial tracts) A) Conventional Number Average Value
LOANS ORIGINATED 5 $72,028 APPLICATIONS APPROVED, NOT ACCEPTED 0 $0 APPLICATIONS DENIED 0 $0 APPLICATIONS WITHDRAWN 0 $0 FILES CLOSED FOR INCOMPLETENESS 0 $0
Aggregated Statistics For Year 2005(Based on 1 full and 1 partial tracts) A) Conventional C) Non-occupant Loans on Number Average Value Number Average Value
LOANS ORIGINATED 5 $50,444 1 $58,780 APPLICATIONS APPROVED, NOT ACCEPTED 1 $32,530 0 $0 APPLICATIONS DENIED 0 $0 0 $0 APPLICATIONS WITHDRAWN 0 $0 0 $0 FILES CLOSED FOR INCOMPLETENESS 0 $0 0 $0
Aggregated Statistics For Year 2004(Based on 1 full and 1 partial tracts) A) Conventional Number Average Value
LOANS ORIGINATED 3 $52,997 APPLICATIONS APPROVED, NOT ACCEPTED 4 $69,828 APPLICATIONS DENIED 0 $0 APPLICATIONS WITHDRAWN 1 $118,870 FILES CLOSED FOR INCOMPLETENESS 0 $0
Aggregated Statistics For Year 2003(Based on 1 full and 1 partial tracts) A) Conventional B) Refinancings C) Non-occupant Loans on Number Average Value Number Average Value Number Average Value
LOANS ORIGINATED 7 $57,934 1 $30,490 2 $56,765 APPLICATIONS APPROVED, NOT ACCEPTED 1 $281,350 0 $0 0 $0 APPLICATIONS DENIED 0 $0 0 $0 0 $0 APPLICATIONS WITHDRAWN 0 $0 0 $0 0 $0 FILES CLOSED FOR INCOMPLETENESS 0 $0 0 $0 0 $0
Aggregated Statistics For Year 1999(Based on 1 full and 2 partial tracts) A) Conventional B) Refinancings C) Non-occupant Loans on Number Average Value Number Average Value Number Average Value
LOANS ORIGINATED 4 $46,722 2 $38,335 2 $22,135 APPLICATIONS APPROVED, NOT ACCEPTED 0 $0 0 $0 0 $0 APPLICATIONS DENIED 1 $46,240 0 $0 0 $0 APPLICATIONS WITHDRAWN 0 $0 0 $0 0 $0 FILES CLOSED FOR INCOMPLETENESS 0 $0 0 $0 0 $0
Detailed PMIC statistics for the following Tracts:
6643.00
, 6644.00
Most common first names in Freeport, TX among deceased individuals Name Count Lived (average)
John 100 69.9 years William 99 71.7 years James 98 68.3 years Robert 76 66.3 years Mary 76 76.8 years George 55 71.7 years Charles 48 69.7 years Frank 36 70.2 years Thomas 36 66.4 years Joe 35 71.4 years
Most common last names in Freeport, TX among deceased individuals Last name Count Lived (average)
Smith 53 71.5 years Williams 38 70.5 years Johnson 25 72.6 years Brown 25 70.0 years Davis 25 75.1 years White 24 72.8 years Jones 22 72.4 years Evans 20 77.5 years Moore 20 63.9 years Miller 18 73.1 years
Freeport compared to Texas state average:
Median household income below state average. Median house value below state average. Foreign-born population percentage below state average. Length of stay since moving in significantly above state average. House age above state average. Number of college students significantly below state average. Percentage of population with a bachelor's degree or higher significantly below state average.
#10 on the list of "Top 101 cities with largest percentage of males in occupations: construction and extraction occupations (population 5,000+)"
#20 on the list of "Top 101 cities with largest percentage of males in industries: construction (population 5,000+)"
#78 on the list of "Top 101 cities with largest percentage of females in occupations: building and grounds cleaning and maintenance occupations (population 5,000+)"
#84 on the list of "Top 101 cities with the least people having Master's or Doctorate degrees (population 5,000+)"
#29 on the list of "Top 101 counties with the lowest Nitrogen Dioxide air pollution readings in 2012 (ppm)"
#72 on the list of "Top 101 counties with the most Evangelical Protestant adherents"
#85 on the list of "Top 101 counties with the highest number of births per 1000 residents 2007-2013"
Top Patent Applicants
Michael A. Brammer (6)
Rajen M. Patel (4)
Jian Wang (4)
Roger L. Kuhlman (3)
Mehmet Demirors (3)
Manesh Sekharan (3)
Wesley R. Mariott (2)
Marinus A. Bigi (2)
Jacquelyn A. Degroot (2)
Monte Alan Peterson (2)
Total of 78 patent applications in 2008-2024.


 Recent articles from our blog. Our writers, many of them Ph.D. graduates or candidates, create easy-to-read articles on a wide variety of topics.

 , pop. 59,653).
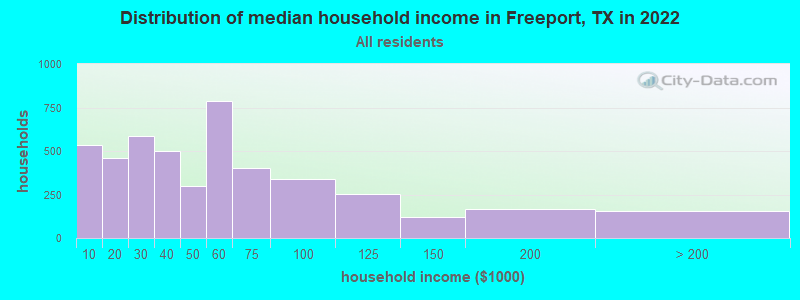
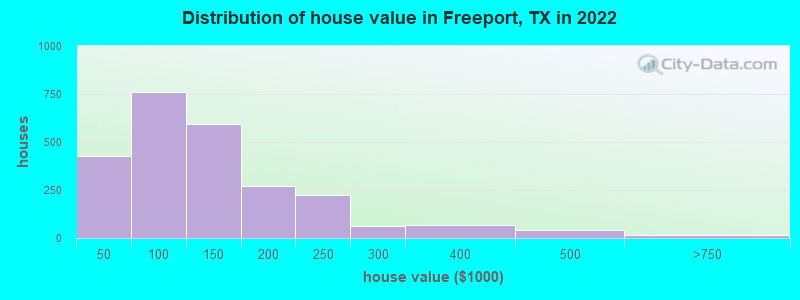

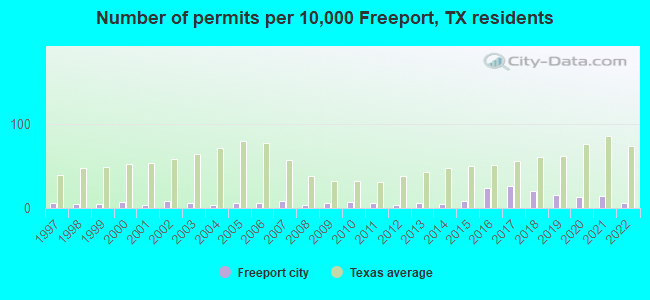
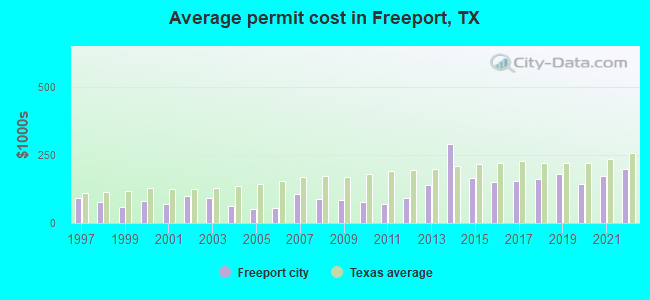
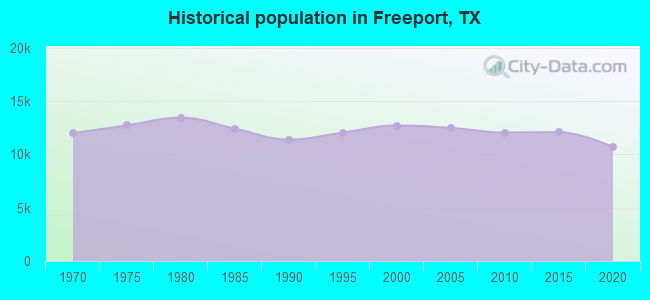
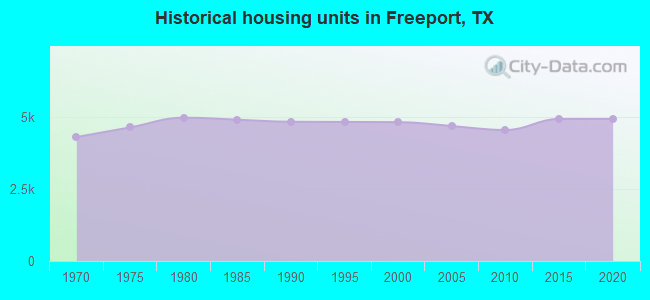
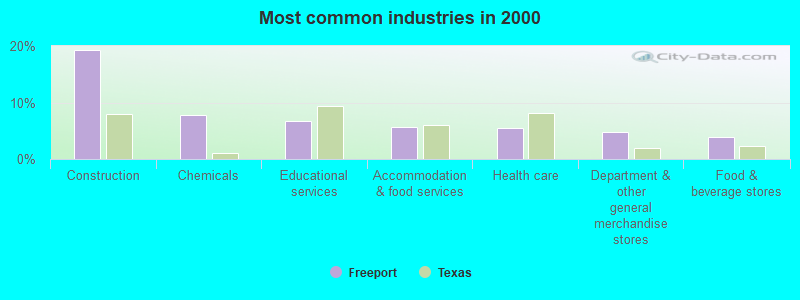
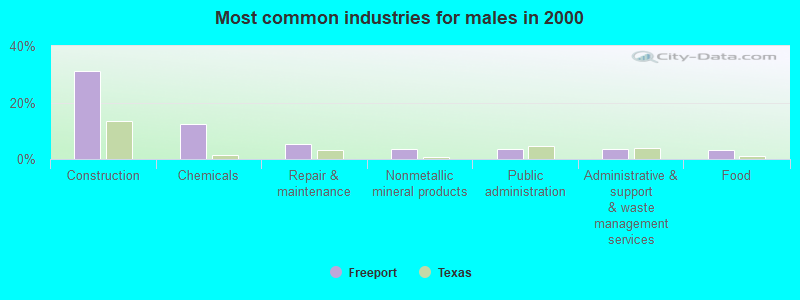
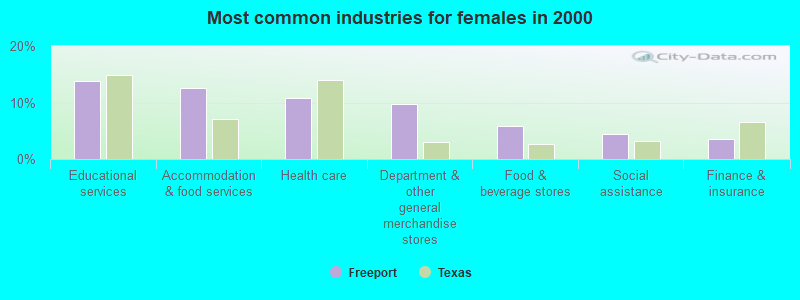

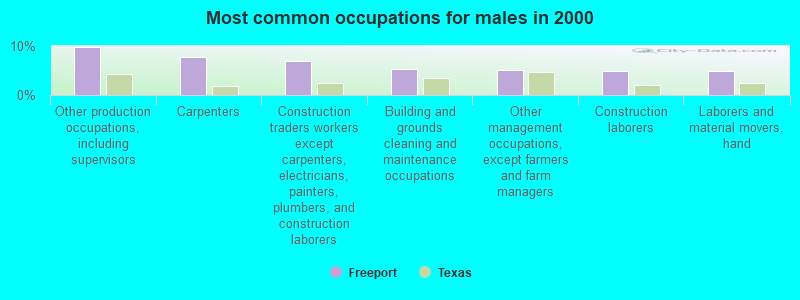
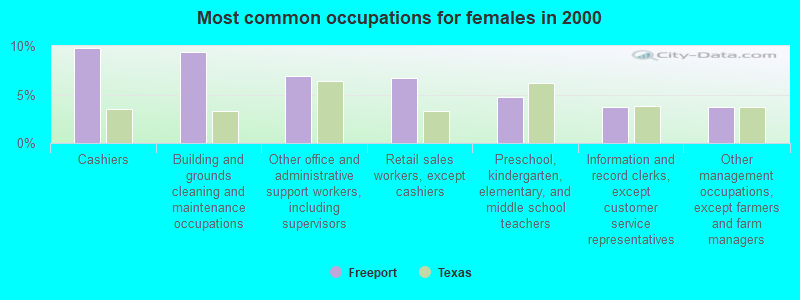


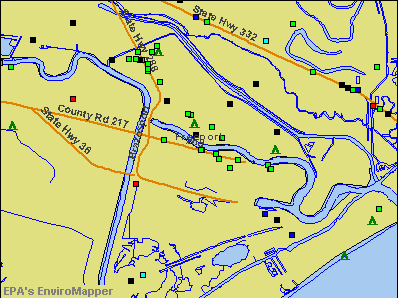

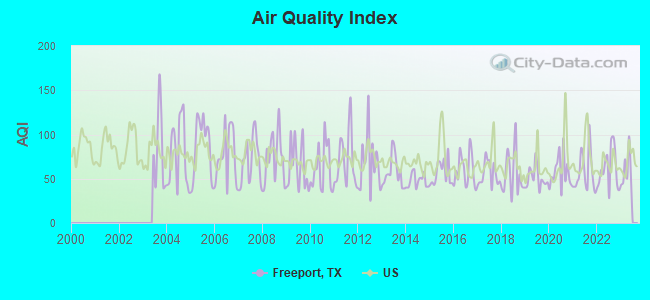
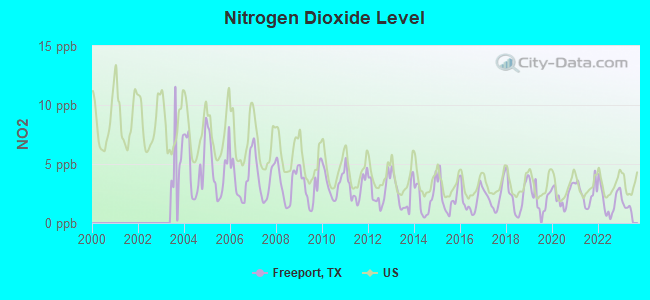
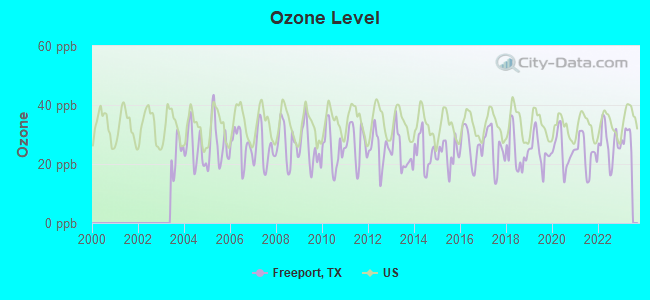
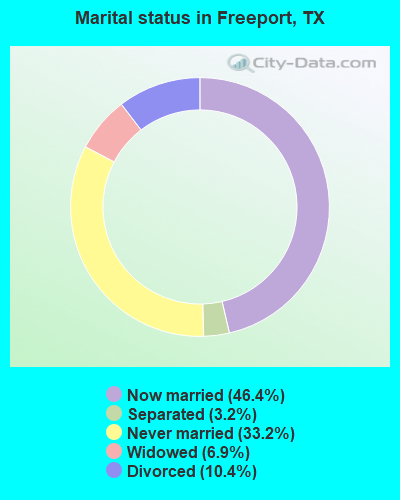
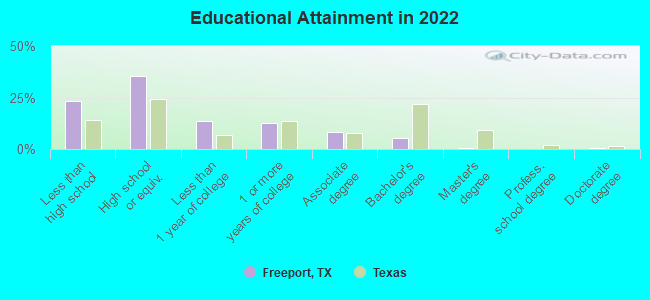
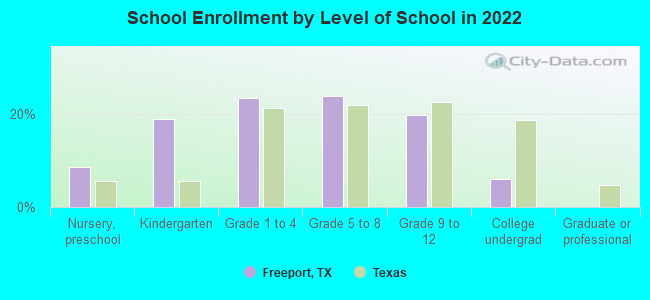
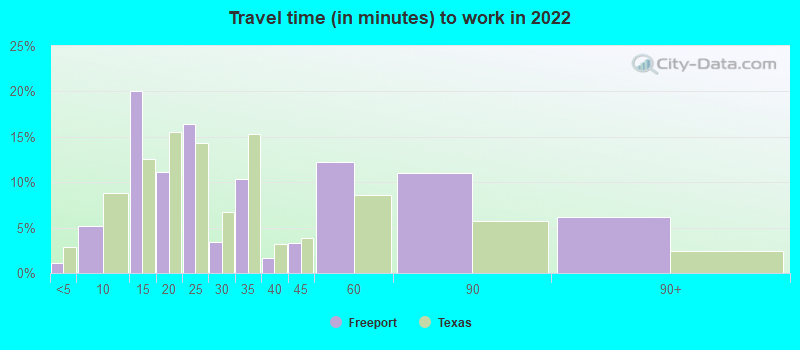
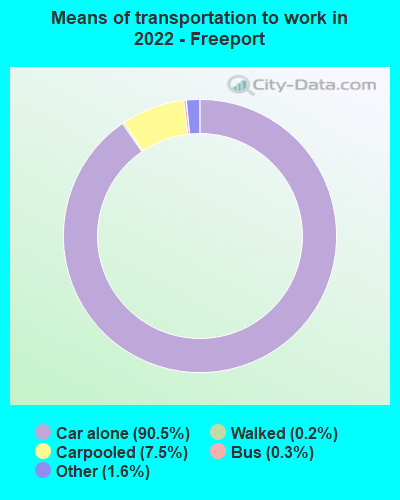
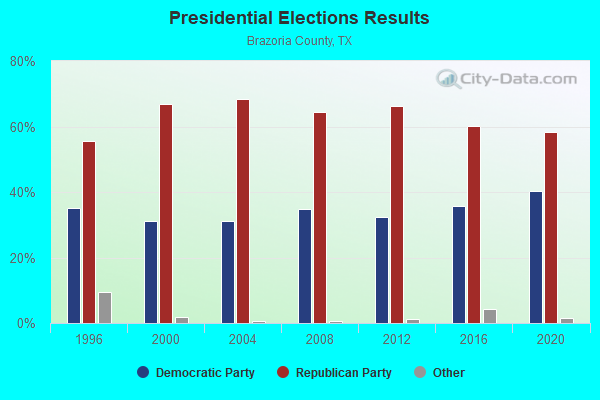
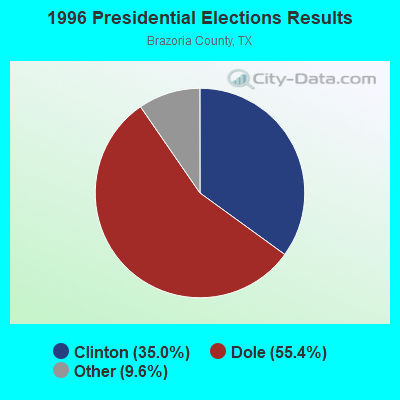

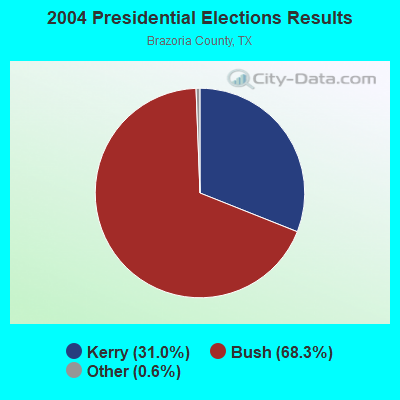
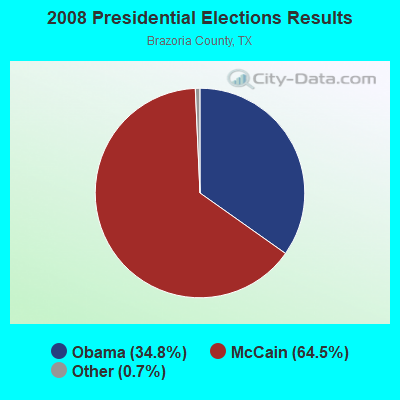
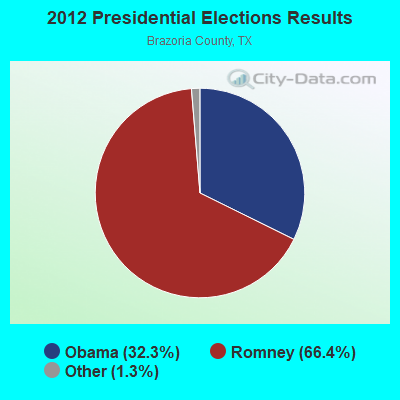
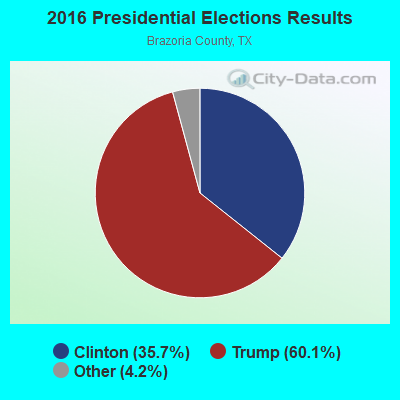
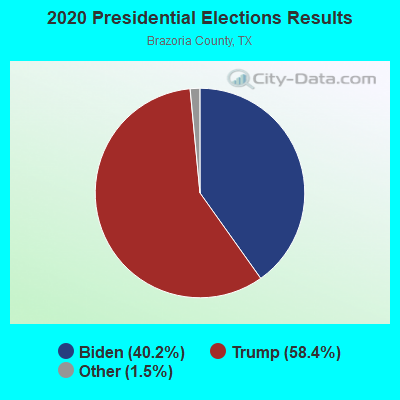
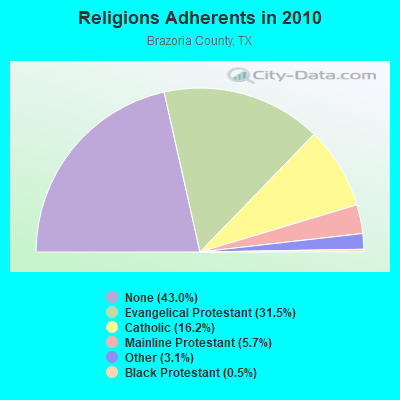
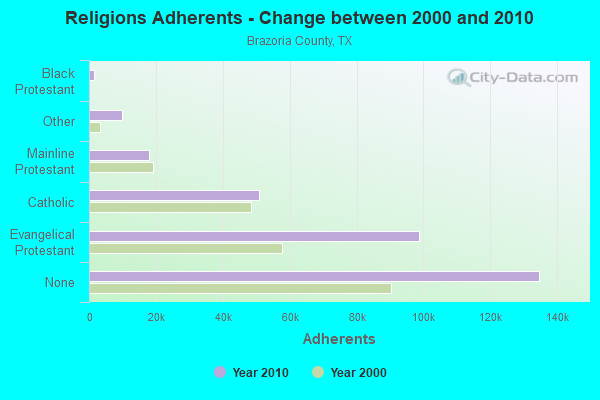
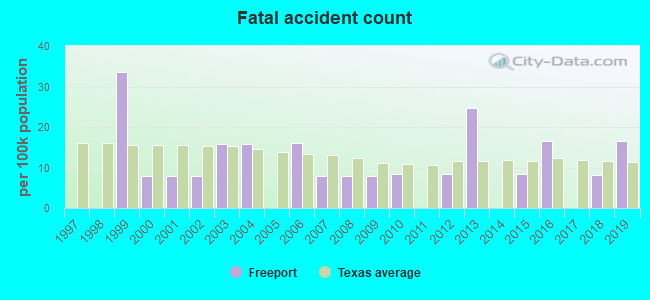
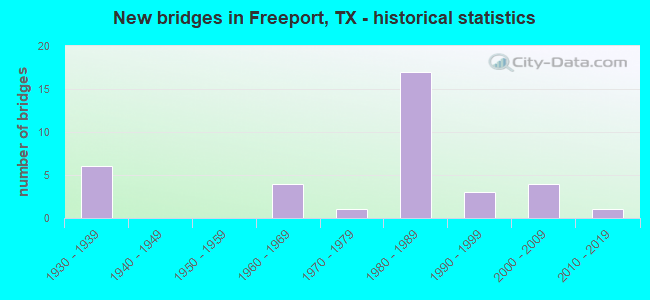
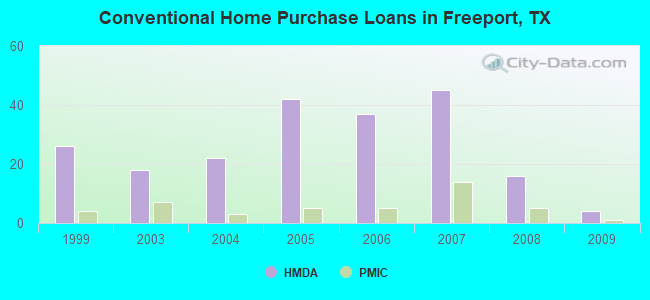
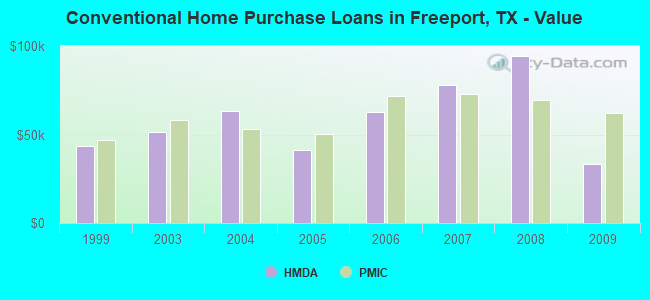
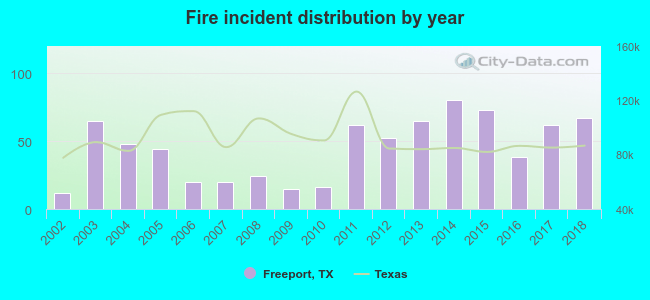 Based on the data from the years 2002 - 2018 the average number of fire incidents per year is 45. The highest number of fire incidents - 80 took place in 2014, and the least - 12 in 2002. The data has an increasing trend.
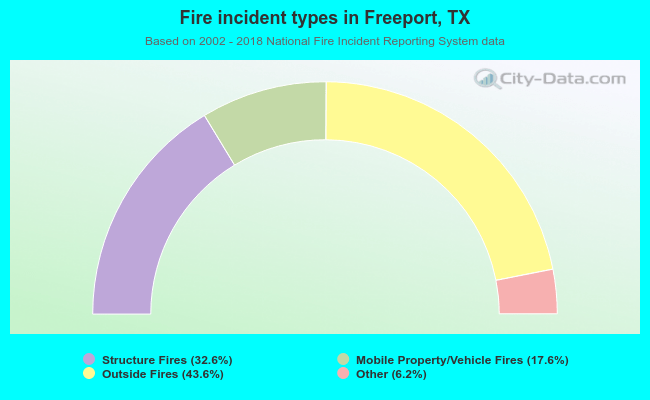 When looking into fire subcategories, the most reports belonged to: Outside Fires (43.6%), and Structure Fires (32.6%).