Estimated zip code population in 2022: 17,331 Zip code population in 2010: 16,741 Zip code population in 2000: 15,511
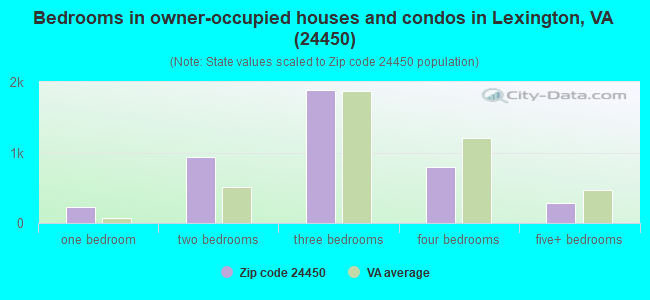
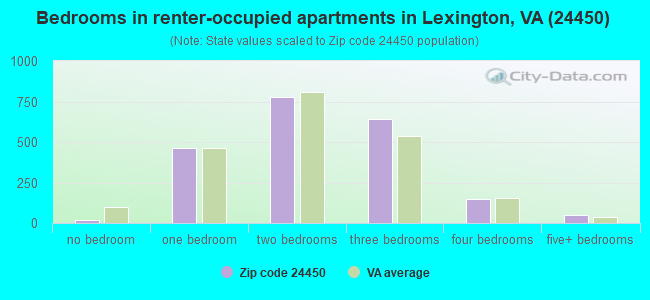
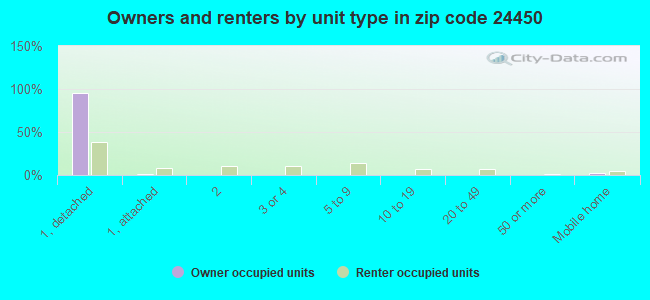
Houses and condos: 7,523 Renter-occupied apartments: 2,108
% of renters here:
34%
State:
33%
March 2022 cost of living index in zip code 24450: 80.4 (low, U.S. average is 100)
Land area: 205.8 sq. mi. Water area: 0.9 sq. mi.
Population density: 84 people per square mile
(very low).
OSM Map
General Map
Google Map
MSN Map
OSM Map
General Map
Google Map
MSN Map
OSM Map
General Map
Google Map
MSN Map
OSM Map
General Map
Google Map
MSN Map
Please wait while loading the map...
Real estate property taxes paid for housing units in 2022:
This zip code:
0.6% ($1,849)
Virginia:
0.7% ($2,617)
Median real estate property taxes paid for housing units with mortgages in 2022: $1,988 (0.7%) Median real estate property taxes paid for housing units with no mortgage in 2022: $1,756 (0.6%)
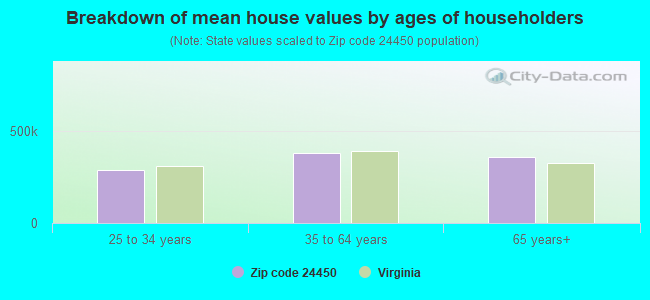
Estimated median house/condo value in 2022: $300,696
24450:
$300,696
Virginia:
$365,700
According to our research of Virginia and other state lists, there were 56 registered sex offenders living in 24450 zip code as of June 02, 2024. The ratio of all residents to sex offenders in zip code 24450 is 300 to 1. The ratio of registered sex offenders to all residents in this zip code is near the state average.
Median resident age:
This zip code:
37.7 years
Virginia median age:
39.0 years
Average household size:
This zip code:
2.2 people
Virginia:
2.5 people
Averages for the 2020 tax year for zip code 24450, filed in 2021:
Average Adjusted Gross Income (AGI) in 2020: $74,692 (Individual Income Tax Returns)
Here:
$74,692
State:
$86,446
Salary/wage: $54,454 (reported on 75.2% of returns)
Here:
$54,454
State:
$71,185
(% of AGI for various income ranges: 1169.2% for AGIs below $25k, 3523.9% for AGIs $25k-50k, 5915.4% for AGIs $50k-75k, 8225.8% for AGIs $75k-100k, 15991.6% for AGIs $100k-200k, 50008.3% for AGIs over 200k)
Taxable interest for individuals: $1,790 (reported on 39.0% of returns)
This zip code:
$1,790
Virginia:
$1,805
(% of AGI for various income ranges: 23.4% for AGIs below $25k, 35.8% for AGIs $25k-50k, 84.9% for AGIs $50k-75k, 106.9% for AGIs $75k-100k, 323.2% for AGIs $100k-200k, 1014.2% for AGIs over 200k)
Ordinary dividends: $10,734 (reported on 30.7% of returns)
Here:
$10,734
State:
$8,327
(% of AGI for various income ranges: 55.7% for AGIs below $25k, 94.8% for AGIs $25k-50k, 285.6% for AGIs $50k-75k, 413.8% for AGIs $75k-100k, 1292.8% for AGIs $100k-200k, 8250.8% for AGIs over 200k)
Net capital gain/loss in AGI: +$19,798 (reported on 27.5% of returns)
Here:
+$19,798
State:
+$24,644
(% of AGI for various income ranges: 29.0% for AGIs below $25k, 74.3% for AGIs $25k-50k, 160.0% for AGIs $50k-75k, 274.4% for AGIs $75k-100k, 1361.2% for AGIs $100k-200k, 22213.3% for AGIs over 200k)
Profit/loss from business: +$16,525 (reported on 16.8% of returns)
Here:
+$16,525
State:
+$12,836
(% of AGI for various income ranges: 133.4% for AGIs below $25k, 198.9% for AGIs $25k-50k, 263.8% for AGIs $50k-75k, 395.6% for AGIs $75k-100k, 760.7% for AGIs $100k-200k, 6002.5% for AGIs over 200k)
Taxable individual retirement arrangement distribution: $24,402 (reported on 13.9% of returns)
24450:
$24,402
Virginia:
$21,535
(% of AGI for various income ranges: 64.3% for AGIs below $25k, 139.5% for AGIs $25k-50k, 359.4% for AGIs $50k-75k, 585.6% for AGIs $75k-100k, 1578.4% for AGIs $100k-200k, 5880.8% for AGIs over 200k)
Self-employed (Keogh) retirement plans: $20,600 (reported on 0.7% of returns)
24450:
$20,600
Virginia:
$31,172
(% of AGI for various income ranges: 67.6% for AGIs $75k-100k, 605.0% for AGIs over 200k)
Total itemized deductions: $35,117 (reported on 11.0% of returns)
Here:
$35,117
State:
$33,287
(% of AGI for various income ranges: 65.6% for AGIs below $25k, 92.6% for AGIs $25k-50k, 402.8% for AGIs $50k-75k, 609.3% for AGIs $75k-100k, 1703.3% for AGIs $100k-200k, 8195.0% for AGIs over 200k)
Charity contributions: $14,425 (reported on 9.7% of returns)
Here:
$14,425
State:
$10,381
(% of AGI for various income ranges: 26.5% for AGIs $25k-50k, 79.7% for AGIs $50k-75k, 172.4% for AGIs $75k-100k, 611.1% for AGIs $100k-200k, 3919.2% for AGIs over 200k)
Taxes paid: $7,561 (reported on 11.0% of returns)
24450:
$7,561
State:
$8,284
(% of AGI for various income ranges: 5.7% for AGIs below $25k, 16.3% for AGIs $25k-50k, 65.7% for AGIs $50k-75k, 152.0% for AGIs $75k-100k, 435.3% for AGIs $100k-200k, 1616.7% for AGIs over 200k)
Earned income credit: $1,993 (reported on 13.2% of returns)
Here:
$1,993
State:
$2,214
(% of AGI for various income ranges: 82.3% for AGIs below $25k, 54.4% for AGIs $25k-50k, 2.1% for AGIs $50k-75k)
Percentage of individuals using paid preparers for their 2020 taxes: 91.3%
Here:
91%
State:
92%
(% for various income ranges: 89.4% for AGIs below $25k, 91.6% for AGIs $25k-50k, 94.0% for AGIs $50k-75k, 92.8% for AGIs $75k-100k, 90.7% for AGIs $100k-200k, 92.5% for AGIs over 200k)
Averages for the 2012 tax year for zip code 24450, filed in 2013:
Average Adjusted Gross Income (AGI) in 2012: $61,890 (Individual Income Tax Returns)
Here:
$61,890
State:
$71,192
Salary/wage: $46,101 (reported on 77.9% of returns)
Here:
$46,101
State:
$59,229
(% of AGI for various income ranges: 73.2% for AGIs below $25k, 73.0% for AGIs $25k-50k, 66.5% for AGIs $50k-75k, 60.0% for AGIs $75k-100k, 57.7% for AGIs $100k-200k, 39.6% for AGIs over 200k)
Taxable interest for individuals: $1,987 (reported on 42.9% of returns)
This zip code:
$1,987
Virginia:
$1,600
(% of AGI for various income ranges: 1.9% for AGIs below $25k, 0.9% for AGIs $25k-50k, 1.4% for AGIs $50k-75k, 1.4% for AGIs $75k-100k, 1.3% for AGIs $100k-200k, 1.6% for AGIs over 200k)
Ordinary dividends: $10,018 (reported on 31.6% of returns)
Here:
$10,018
State:
$6,959
(% of AGI for various income ranges: 3.4% for AGIs below $25k, 2.6% for AGIs $25k-50k, 3.3% for AGIs $50k-75k, 3.3% for AGIs $75k-100k, 5.4% for AGIs $100k-200k, 8.8% for AGIs over 200k)
Net capital gain/loss in AGI: +$13,117 (reported on 24.8% of returns)
Here:
+$13,117
State:
+$16,672
(% of AGI for various income ranges: 0.9% for AGIs below $25k, 0.5% for AGIs $25k-50k, 1.2% for AGIs $50k-75k, 1.2% for AGIs $75k-100k, 3.0% for AGIs $100k-200k, 16.5% for AGIs over 200k)
Profit/loss from business: +$17,019 (reported on 17.0% of returns)
Here:
+$17,019
State:
+$14,116
(% of AGI for various income ranges: 6.4% for AGIs below $25k, 4.6% for AGIs $25k-50k, 4.1% for AGIs $50k-75k, 3.0% for AGIs $75k-100k, 3.1% for AGIs $100k-200k, 7.2% for AGIs over 200k)
Taxable individual retirement arrangement distribution: $16,761 (reported on 15.3% of returns)
24450:
$16,761
Virginia:
$16,667
(% of AGI for various income ranges: 3.6% for AGIs below $25k, 2.8% for AGIs $25k-50k, 3.7% for AGIs $50k-75k, 5.6% for AGIs $75k-100k, 5.0% for AGIs $100k-200k, 3.5% for AGIs over 200k)
Self-employment retirement plans: $17,940 (reported on 0.8% of returns)
24450:
$17,940
Virginia:
$25,373
Total itemized deductions: $24,419 (21% of AGI, reported on 35.0% of returns)
Here:
$24,419
State:
$26,596
Here:
20.9% of AGI
State:
20.1% of AGI
(% of AGI for various income ranges: 8.5% for AGIs below $25k, 10.4% for AGIs $25k-50k, 13.6% for AGIs $50k-75k, 14.9% for AGIs $75k-100k, 16.3% for AGIs $100k-200k, 14.0% for AGIs over 200k)
Charity contributions: $6,000 (reported on 29.3% of returns)
Here:
$6,000
State:
$4,443
(% of AGI for various income ranges: 0.8% for AGIs below $25k, 1.3% for AGIs $25k-50k, 2.3% for AGIs $50k-75k, 2.7% for AGIs $75k-100k, 3.5% for AGIs $100k-200k, 4.0% for AGIs over 200k)
Taxes paid: $8,092 (reported on 34.6% of returns)
24450:
$8,092
State:
$9,951
(% of AGI for various income ranges: 1.1% for AGIs below $25k, 2.2% for AGIs $25k-50k, 3.4% for AGIs $50k-75k, 4.3% for AGIs $75k-100k, 5.7% for AGIs $100k-200k, 6.2% for AGIs over 200k)
Earned income credit: $1,829 (reported on 14.5% of returns)
Here:
$1,829
State:
$2,211
(% of AGI for various income ranges: 4.5% for AGIs below $25k, 0.8% for AGIs $25k-50k)
Percentage of individuals using paid preparers for their 2012 taxes: 51.9%
Here:
52%
State:
46%
(% for various income ranges: 45.8% for AGIs below $25k, 50.7% for AGIs $25k-50k, 55.4% for AGIs $50k-75k, 54.8% for AGIs $75k-100k, 59.0% for AGIs $100k-200k, 73.9% for AGIs over 200k)
Averages for the 2004 tax year for zip code 24450, filed in 2005:
Average Adjusted Gross Income (AGI) in 2004: $51,736 (Individual Income Tax Returns)
Here:
$51,736
State:
$56,704
Salary/wage: $38,148 (reported on 78.7% of returns)
Here:
$38,148
State:
$48,441
(% of AGI for various income ranges: 119.6% for AGIs below $10k, 72.6% for AGIs $10k-25k, 72.9% for AGIs $25k-50k, 71.3% for AGIs $50k-75k, 63.5% for AGIs $75k-100k, 42.3% for AGIs over 100k)
Taxable interest for individuals: $2,013 (reported on 49.8% of returns)
This zip code:
$2,013
Virginia:
$1,688
(% of AGI for various income ranges: 8.9% for AGIs below $10k, 3.5% for AGIs $10k-25k, 2.3% for AGIs $25k-50k, 1.7% for AGIs $50k-75k, 1.8% for AGIs $75k-100k, 1.4% for AGIs over 100k)
Taxable dividends: $6,650 (reported on 34.4% of returns)
Here:
$6,650
State:
$4,028
(% of AGI for various income ranges: 10.4% for AGIs below $10k, 2.3% for AGIs $10k-25k, 2.6% for AGIs $25k-50k, 3.0% for AGIs $50k-75k, 3.7% for AGIs $75k-100k, 6.0% for AGIs over 100k)
Net capital gain/loss: +$12,377 (reported on 27.4% of returns)
Here:
+$12,377
State:
+$14,375
(% of AGI for various income ranges: -2.9% for AGIs below $10k, 1.4% for AGIs $10k-25k, 1.2% for AGIs $25k-50k, 1.6% for AGIs $50k-75k, 3.3% for AGIs $75k-100k, 12.3% for AGIs over 100k)
Profit/loss from business: +$12,703 (reported on 17.3% of returns)
Here:
+$12,703
State:
+$13,342
(% of AGI for various income ranges: 5.9% for AGIs below $10k, 6.0% for AGIs $10k-25k, 4.5% for AGIs $25k-50k, 3.8% for AGIs $50k-75k, 3.5% for AGIs $75k-100k, 4.2% for AGIs over 100k)
IRA payment deduction: $3,258 (reported on 4.2% of returns)
24450:
$3,258
Virginia:
$2,943
(% of AGI for various income ranges: 0.3% for AGIs $10k-25k, 0.4% for AGIs $25k-50k, 0.4% for AGIs $50k-75k, 0.4% for AGIs $75k-100k, 0.1% for AGIs over 100k)
Self-employed pension: $12,932 (reported on 1.2% of returns)
Here:
$12,932
Virginia:
$17,430
(% of AGI for various income ranges: 0.2% for AGIs $10k-25k, 0.2% for AGIs $50k-75k, 0.5% for AGIs over 100k)
Total itemized deductions: $20,049 (19% of AGI, reported on 32.7% of returns)
Here:
$20,049
State:
$21,492
Here:
19.4% of AGI
State:
21.0% of AGI
(% of AGI for various income ranges: 16.6% for AGIs below $10k, 9.4% for AGIs $10k-25k, 10.1% for AGIs $25k-50k, 15.0% for AGIs $50k-75k, 16.3% for AGIs $75k-100k, 12.2% for AGIs over 100k)
Charity contributions deductions: $4,715 (4% of AGI, reported on 28.1% of returns)
Here:
$4,715
State:
$3,794
Here:
4.2% of AGI
State:
3.5% of AGI
(% of AGI for various income ranges: 1.1% for AGIs below $10k, 0.7% for AGIs $10k-25k, 1.5% for AGIs $25k-50k, 2.2% for AGIs $50k-75k, 3.1% for AGIs $75k-100k, 3.3% for AGIs over 100k)
Total tax: $8,991 (reported on 77.4% of returns)
24450:
$8,991
State:
$9,537
(% of AGI for various income ranges: 4.5% for AGIs below $10k, 4.7% for AGIs $10k-25k, 7.2% for AGIs $25k-50k, 8.9% for AGIs $50k-75k, 10.4% for AGIs $75k-100k, 19.9% for AGIs over 100k)
Earned income credit: $1,473 (reported on 12.2% of returns)
Here:
$1,473
State:
$1,734
Percentage of individuals using paid preparers for their 2004 taxes: 53.8%
Here:
54%
State:
52%
(% for various income ranges: 46.6% for AGIs below $10k, 51.9% for AGIs $10k-25k, 55.3% for AGIs $25k-50k, 55.3% for AGIs $50k-75k, 56.6% for AGIs $75k-100k, 65.2% for AGIs over 100k)
Household received Food Stamps/SNAP in the past 12 months: 899 Household did not receive Food Stamps/SNAP in the past 12 months: 5,406
Women who had a birth in the past 12 months: 192 (144 now married, 47 unmarried) Women who did not have a birth in the past 12 months: 3,497 (1,153 now married, 2,358 unmarried)
Housing units in zip code 24450 with a mortgage: 2,130 (257 second mortgage, 253 both second mortgage and home equity loan) Houses without a mortgage: 138
Median monthly owner costs for units with a mortgage: $1,432 Median monthly owner costs for units without a mortgage: $474
Residents with income below the poverty level in 2022:
This zip code:
11.2%
Whole state:
10.6%
Residents with income below 50% of the poverty level in 2022:
This zip code:
4.3%
Whole state:
5.2%
Median number of rooms in houses and condos:
Here:
6.5
State:
7.0
Median number of rooms in apartments:
Here:
4.6
State:
4.3
Notable locations in this zip code not listed on our city pages
Notable locations in zip code 24450: Lawyers Row (A), Godwins Row (B), Memorial Gate (C), Ingleside Trout Farm (D), Lexington Golf and Country Club (E), Top Dirve Overlook (F), Lake Robertson Recreational Area (G), Buffalo Forge Station (H), Camp Tanglewood (I), White-Davidson House (J), The Pines (K), The Gables (L), The Castle (M), Silverwood (N), Preston House (O), Old Blue Tavern (P), Miley House (Q), McElwee House (R), McCampbell Inn (S), Lexington Visitors Center (T). Display/hide their locations on the map
Churches in zip code 24450 include: Bethany Church (A), Church of God of Prophecy (B), First Baptist Church (C), Good Shepherd Evangelical Lutheran Church (D), Gospel Way Church of God in Christ (E), Grace Presbyterian Church (F), Lauderdale Associated Reform Presbyterian Church (G), Lexington Church of Christ (H), Lexington Presbyterian Church (I). Display/hide their locations on the map
Cemeteries: Pullen Cemetery (1), Evergreen Cemetery (2), Wesley Chapel Cemetery (3), Union View Cemetery (4), Timber Ridge Cemetery (5), Rapps Cemetery (6), Paxton Cemetery (7). Display/hide their locations on the map
Streams, rivers, and creeks: Whistle Creek (A), Waterloo Creek (B), Warm Run (C), Walters Creek (D), Union Creek (E), Gould Creek (F), Toad Run (G), Sycamore Run (H), Sugar Creek (I). Display/hide their locations on the map
Parks in zip code 24450 include: Alumni Memorial Field (1), Son Read Memorial Track (2), Virginia Military Institute Historic District (3), Washington and Lee University Historic District (4), Alumni Field (5), Smith Baseball Field (6), Delaney Field (7), Lexington Historic District (8), Liberty Hall Soccer Fields (9). Display/hide their locations on the map
1,632 married couples with children.
739 single-parent households (80 men, 659 women).
94.9% of residents of 24450 zip code speak English at home.
2.2% of residents speak Spanish at home (90% very well, 10% well).
1.0% of residents speak other Indo-European language at home (61% very well, 39% well).
1.7% of residents speak Asian or Pacific Island language at home (44% very well, 56% well).
0.2% of residents speak other language at home (100% very well).
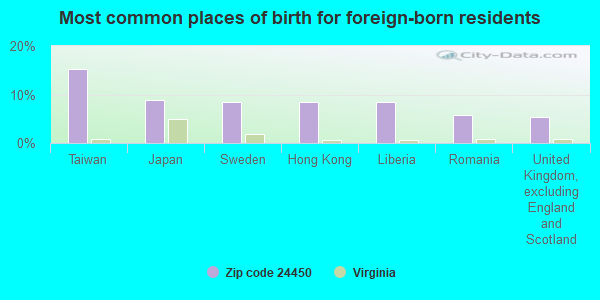
Foreign born population: 679 (3.9%) (52.1% of them are naturalized citizens)
This zip code:
3.9%
Whole state:
12.7%
15%Taiwan
9%Japan
8%Sweden
8%Hong Kong
8%Liberia
6%Romania
5%United Kingdom, excluding England and Scotland
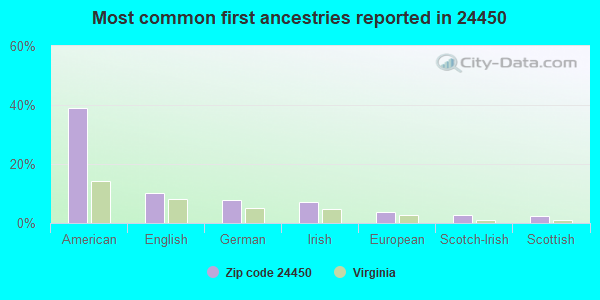
39%American
10%English
8%German
7%Irish
4%European
3%Scotch-Irish
2%Scottish
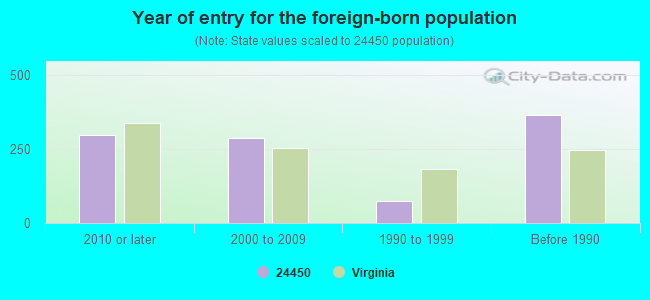
Year of entry for the foreign-born population
2972010 or later
2872000 to 2009
751990 to 1999
366Before 1990
Facilities with environmental interests located in this zip code:
ADAMS CONSTRUCTION CO - LEXINGTON (US ROUTE 60 in LEXINGTON, VA)
AIR SYNTHETIC MINOR (AIRS/AFS) STATE MASTER (Virginia pollutants databases) - CEDS-30894, AIR PROGRAM AIR MAJOR ("Best Available" air pollution technologies tracking) Business SIC classification: ASPHALT PAVING MIXTURES AND BLOCKS Business NAICS classification: ASPHALT PAVING MIXTURE AND BLOCK MANUFACTURING. Alternative names: ADAMS CONSTRUCTION CO.
CHARLES W BARGER & SON CONSTRUCTION (10 BORDEN SCHOOL ROAD in LEXINGTON, VA)
AIR SYNTHETIC MINOR (AIRS/AFS) STATE MASTER (Virginia pollutants databases) - CEDS-80116, AIR PROGRAM Business SIC and NAICS classification: CRUSHED AND BROKEN LIMESTONE
CENTRAL ELEM. (85 CENTRAL ROAD in LEXINGTON, VA)
(National Center for Education Statistics) - STATE ID-0810650 Organizations: ROCKBRIDGE COUNTY PUBLIC SCHOOLS (SCHOOL DISTRICT)
CLARKE CPDJ INC (390 E MIDLAND TRAIL in LEXINGTON, VA)
Small Quantity Generators, between 100 kg and 1000 kg of hazardous waste/month (Resource Conservation and Recovery Act (tracking hazardous waste)) - notification Organizations: RIND ROBERT G (CONTACT/OWNER)
Housing units lacking complete plumbing facilities: 1.8% Housing units lacking complete kitchen facilities: 1.5%
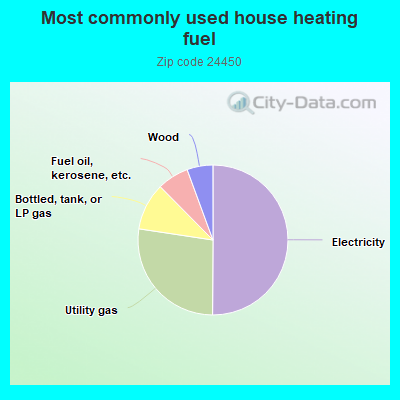
50.1%Electricity
27.3%Utility gas
10.2%Bottled, tank, or LP gas
6.8%Fuel oil, kerosene, etc.
5.6%Wood
Population in 1990: 14,306. Population change in the 1990s: +1,205 (+8.4%).
Place of birth for U.S.-born residents:
This state: 8,881
Northeast: 2,335
Midwest: 1,243
South: 3,001
West: 817
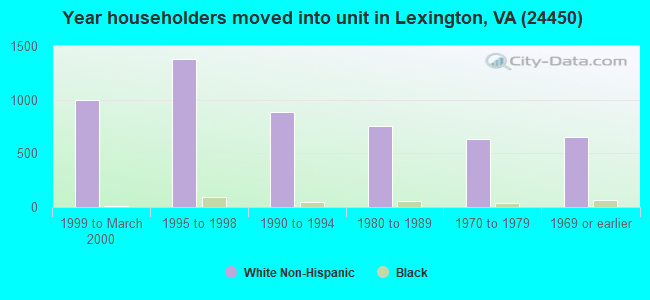
54% of the 24450 zip code residents lived in the same house 5 years ago. Out of people who lived in different houses, 22% lived in this county. Out of people who lived in different counties, 50% lived in Virginia.
91% of the 24450 zip code residents lived in the same house 1 year ago. Out of people who lived in different houses, 30% moved from this county. Out of people who lived in different houses, 42% moved from different county within same state. Out of people who lived in different houses, 27% moved from different state. Out of people who lived in different houses, 3% moved from abroad.
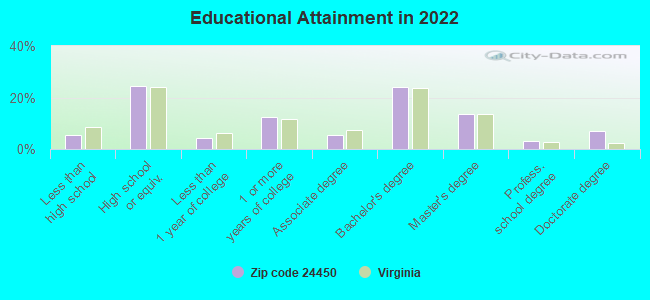
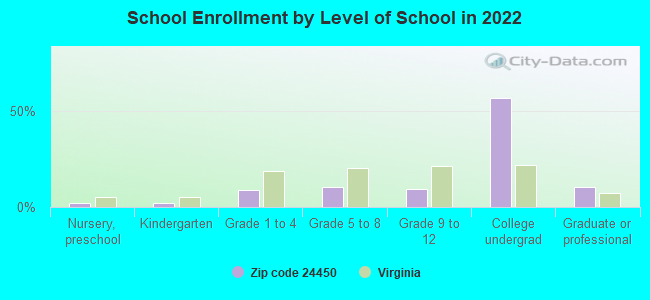
Private vs. public school enrollment:
Students in private schools in grades 1 to 8 (elementary and middle school): 32
Here:
2.7%
Virginia:
13.2%
Students in private schools in grades 9 to 12 (high school): 87
Here:
15.1%
Virginia:
10.2%
Students in private undergraduate colleges: 1,061
Here:
30.8%
Virginia:
18.7%
Occupation by median earnings in the past 12 months ($)
100,597Health diagnosing and treating practitioners and other technical occupations
93,661Installation, maintenance, and repair occupations
83,382Business and financial operations occupations
60,882Management occupations
53,378Transportation occupations
52,875Education, training, and library occupations
Companies with federal contracts located in this zip code (LEXINGTON, VA):
INNOVATIVE MANAGEMENT, INC (10 E PRESTON; small business) : $34,345,486 in 112 contractsfrom 2002 to 2006
Contracts for General Health Care Services, Other Medical Services, Nursing Services, Cardio-Vascular Services, and moreby Army, Air Force, Navy Signed by year:2000: $0; 2001: $0; 2002: $9,449; 2003: $10,143,491; 2004: $10,975,414; 2005: $12,135,784; 2006: $1,081,348.
Biggest contracts:
$4,412,074 with Army for General Health Care Services. Taking place in TX. Signed on 2005-07-31. Completion date: 2006-07-30.
$4,118,438 with Army for General Health Care Services. Signed on 2003-08-01. Completion date: 2004-07-29.
$4,110,153 with Army for General Health Care Services. Taking place in TX. Signed on 2004-06-09. Completion date: 2004-07-30.
$2,320,514 with Air Force for Other Medical Services. Taking place in TX. Signed on 2005-10-01. Completion date: 2006-09-30.
VIRGINIA MILITARY INSTITUTE IN (309 LETCHER AVE) : $2,477,204 in 13 contractsfrom 2000 to 2005
Contracts for Tuition, Registration, and Membership Fees, Intelligence Services by Navy, Air Force, Army Signed by year:2000: $121,668; 2001: $82,252; 2002: $121,650; 2003: $217,114; 2004: $1,268,022; 2005: $666,498; 2006: $0.
Biggest contracts:
$710,003 with Navy for Tuition, Registration, and Membership Fees. Signed on 2004-01-19. Completion date: 2004-01-19.
$344,534 with Air Force for Tuition, Registration, and Membership Fees. Signed on 2004-08-25. Completion date: 2004-09-30.
$333,224, same as above.Signed on 2005-03-30. Completion date: 2005-09-30.
$331,724, same as above.Signed on 2005-04-18. Completion date: 2005-09-30.
MARSHALL, GEORGE C RESEARCH FO (V M I PARADE) : $1,948,090 in 15 contractsfrom 1999 to 2006
Contracts for Other Education and Training Services, Other Management Support Services, Other Professional Services by Air Force, Army Signed by year:2000: $190,194; 2001: $217,214; 2002: $27,360; 2003: $447,797; 2004: $234,616; 2005: $403,255; 2006: $243,000.
Biggest contracts:
$243,000 with Air Force for Other Education and Training Services. Signed on 2006-03-10. Completion date: 2006-03-19.
$241,655 with Army for Other Management Support Services. Signed on 2005-11-29. Completion date: 2003-12-11.
$234,616, same as above.Signed on 2004-12-09. Completion date: 2003-12-11.
$227,783, same as above.Signed on 2003-12-15. Completion date: 2003-12-11.
JIM FRENCH (10 HIGH MEADOW DRIVE; small business) : $465,572 in 5 contractsfrom 2001 to 2004
Contracts for Other ADP and Telecommunications Services (includes data storage on tapes, compact disks, etc.) by Defense Information Systems Agency, Department of Defense Signed by year:2000: $0; 2001: $89,106; 2002: $102,882; 2003: $101,669; 2004: $171,915; 2005: $0; 2006: $0.
Biggest contracts:
$103,915 with Defense Information Systems Agency for Other ADP and Telecommunications Services (includes data storage on tapes, compact disks, etc.). Signed on 2004-01-31. Completion date: 2003-08-31.
$102,882 with Department of Defense for Other ADP and Telecommunications Services (includes data storage on tapes, compact disks, etc.). Signed on 2002-07-31. Completion date: 2003-01-31.
$101,669, same as above.Signed on 2003-03-25. Completion date: 2003-08-31.
$89,106, same as above.Signed on 2001-06-06. Completion date: 2002-03-06.
VESUVIUS, INCORPORATED (2516 N LEE HWY; small business) : $149,450 in 3 contractsin 2005
$99,450 with Army for Maintenance, Repair or Alteration of Real Property -- Other Conservation and Development Facilities. Signed on 2005-12-06. Completion date: 2005-11-21.
$25,000 with U.S. Army Corps of Engineers - civil program financing only for Miscellaneous Construction Equipment. Signed on 2005-06-27. Completion date: 2005-06-21.
$25,000 with Army for Miscellaneous Construction Equipment. Signed on 2005-06-27. Completion date: 2005-06-21.
SGE CORPORATION (748 COLD RUN DRIVE) : $26,860 in 3 contractsfrom 2001 to 2002
$77,994 with Navy for Engine Instruments. Signed on 2002-10-01. Completion date: 2003-03-29.
$26,860 with Navy for Installation of Equipment -- Miscellaneous. Signed on 2001-06-28. Completion date: 2001-07-12.
-$77,994 with Navy for Engine Instruments. Signed on 2002-10-10. Completion date: 2003-03-29.
Top industries in this zip code by the number of employees in 2005:
Educational Services: Colleges, Universities, and Professional Schools (500-999 employees: 1 establishment, 1-4 employees: 1 establishment)
Accommodation and Food Services: Hotels (except Casino Hotels) and Motels (20-49: 6, 10-19: 4, 5-9: 1, 1-4: 1)
Accommodation and Food Services: Food Service Contractors (100-249: 1, 10-19: 1, 5-9: 1, 1-4: 1)
People in group quarters in 2010:
1,398 people in military barracks and dormitories (nondisciplinary)
1,112 people in college/university student housing
106 people in nursing facilities/skilled-nursing facilities
88 people in local jails and other municipal confinement facilities
8 people in group homes intended for adults
2 people in other noninstitutional facilities
People in group quarters in 2000:
2,118 people in college dormitories (includes college quarters off campus)
142 people in nursing homes
75 people in local jails and other confinement facilities (including police lockups)
11 people in homes for the mentally retarded
3 people in other nonhousehold living situations
Fatal accident statistics in 2014:
Fatal accident count: 1
Vehicles involved in fatal accidents: 2
Fatal accidents caused by drunken drivers: 0
Fatalities: 1
Persons involved in fatal accidents: 2
Pedestrians involved in fatal accidents: 0
Fatal accident statistics in 2013:
Fatal accident count: 2
Vehicles involved in fatal accidents: 2
Fatal accidents caused by drunken drivers: 1
Fatalities: 3
Persons involved in fatal accidents: 17
Pedestrians involved in fatal accidents: 0
2002 - 2018 National Fire Incident Reporting System (NFIRS) incidents
Based on the data from the years 2002 - 2018 the average number of fire incidents per year is 98. The highest number of reported fire incidents - 153 took place in 2013, and the least - 36 in 2002. The data has an increasing trend.
When looking into fire subcategories, the most reports belonged to: Structure Fires (50.6%), and Outside Fires (24.9%).
Fire incident types reported to NFIRS in Zip Code 24450


 Nearest zip codes: 24555, 24578, 24416, 24473, 24579, 24439.


 Based on the data from the years 2002 - 2018 the average number of fire incidents per year is 98. The highest number of reported fire incidents - 153 took place in 2013, and the least - 36 in 2002. The data has an increasing trend.
 When looking into fire subcategories, the most reports belonged to: Structure Fires (50.6%), and Outside Fires (24.9%).