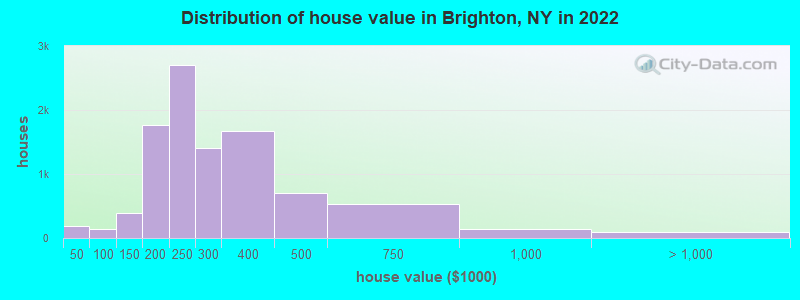
Estimated median house or condo value in 2022: $259,024 (it was $124,100 in 2000)
Brighton:
$259,024
NY:
$400,400
Mean prices in 2022:all housing units: $295,093; detached houses: $297,764; townhouses or other attached units: $223,797; in 2-unit structures: $388,469; in 3-to-4-unit structures: $384,385; in 5-or-more-unit structures: $294,303; mobile homes: $7,337
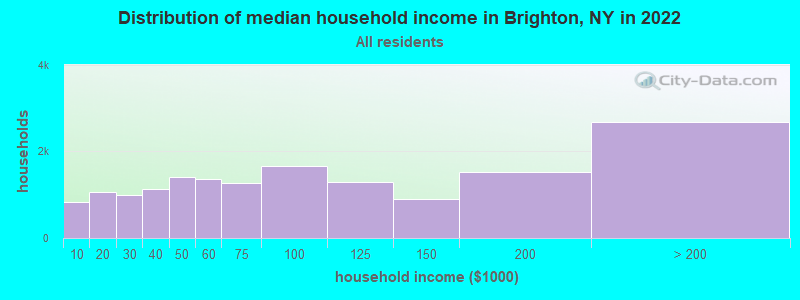
Median gross rent in 2022: $1,213.
March 2022 cost of living index in Brighton: 103.8 (near average, U.S. average is 100)
Percentage of residents living in poverty in 2022: 9.1%
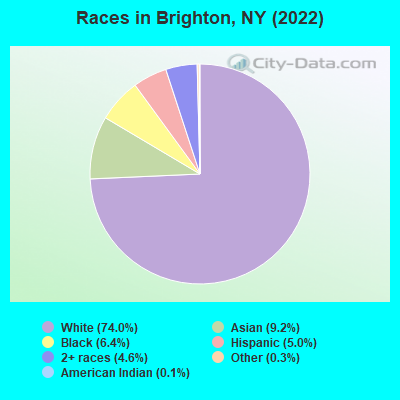
(8.1% for White Non-Hispanic residents, 23.0% for Black residents, 10.5% for Hispanic or Latino residents, 8.7% for other race residents, 13.5% for two or more races residents)
According to our research of New York and other state lists, there was 1 registered sex offender living in Brighton, New York as of June 12, 2024. The ratio of all residents to sex offenders in Brighton is 36,800 to 1. The ratio of registered sex offenders to all residents in this city is much lower than the state average.
Crime rates in Brighton by year
Type
2009
2010
2011
2012
2013
2014
2015
2016
2017
2018
2019
2020
2021
2022
Murders (per 100,000)
0 (0.0)
0 (0.0)
0 (0.0)
1 (2.7)
1 (2.7)
0 (0.0)
0 (0.0)
0 (0.0)
0 (0.0)
0 (0.0)
0 (0.0)
0 (0.0)
1 (2.8)
0 (0.0)
Rapes (per 100,000)
3 (8.8)
6 (16.4)
8 (21.8)
6 (16.3)
2 (5.5)
4 (10.8)
8 (21.6)
13 (35.2)
8 (21.9)
9 (24.7)
5 (13.9)
9 (25.1)
6 (16.8)
9 (24.7)
Robberies (per 100,000)
12 (35.0)
13 (35.5)
16 (43.5)
10 (27.1)
10 (27.3)
8 (21.7)
6 (16.2)
8 (21.7)
9 (24.6)
15 (41.1)
4 (11.1)
5 (13.9)
5 (14.0)
3 (8.2)
Assaults (per 100,000)
27 (78.8)
26 (71.0)
17 (46.2)
11 (29.8)
13 (35.4)
14 (38.0)
8 (21.6)
7 (19.0)
11 (30.1)
8 (21.9)
16 (44.4)
22 (61.4)
13 (36.4)
17 (46.7)
Burglaries (per 100,000)
173 (504.7)
150 (409.7)
150 (407.9)
173 (469.4)
142 (387.0)
75 (203.3)
124 (334.9)
84 (227.7)
74 (202.2)
62 (170.0)
85 (235.9)
71 (198.0)
71 (198.9)
55 (151.2)
Thefts (per 100,000)
1,001 (2,920)
877 (2,396)
766 (2,083)
734 (1,992)
623 (1,698)
756 (2,050)
623 (1,683)
693 (1,879)
691 (1,888)
537 (1,472)
507 (1,407)
619 (1,726)
564 (1,580)
607 (1,668)
Auto thefts (per 100,000)
31 (90.4)
24 (65.6)
31 (84.3)
26 (70.5)
28 (76.3)
25 (67.8)
32 (86.4)
20 (54.2)
16 (43.7)
14 (38.4)
19 (52.7)
35 (97.6)
35 (98.1)
61 (167.7)
Arson (per 100,000)
1 (2.9)
0 (0.0)
1 (2.7)
0 (0.0)
0 (0.0)
0 (0.0)
1 (2.7)
1 (2.7)
0 (0.0)
0 (0.0)
0 (0.0)
3 (8.4)
1 (2.8)
2 (5.5)
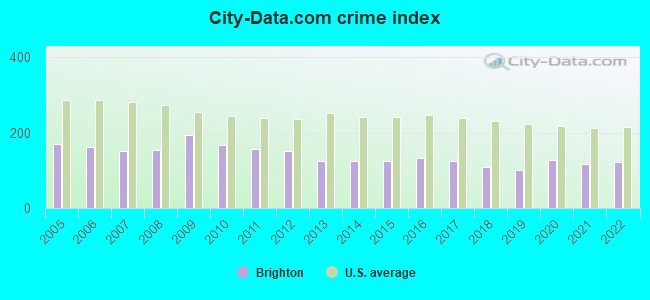
City-Data.com crime index
192.6
167.7
158.3
150.7
126.2
124.4
124.1
133.9
124.1
110.3
100.3
127.3
115.5
122.3
The City-Data.com crime index weighs serious crimes and violent crimes more heavily. Higher means more crime, U.S. average is 246.1. It adjusts for the number of visitors and daily workers commuting into cities.
Latest news from Brighton, NY collected exclusively by city-data.com from local newspapers, TV, and radio stations
Ancestries: Irish (10.3%), Italian (8.2%), English (8.2%), American (7.9%), German (6.8%), Russian (2.9%).
Current Local Time: EST time zone
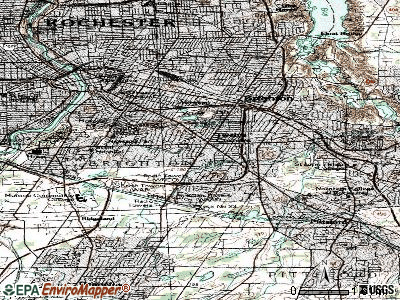
Land area: 15.4 square miles.
Population density: 2,370 people per square mile (low).
5,690 residents are foreign born (8.7% Asia, 3.3% Europe, 1.6% Africa).
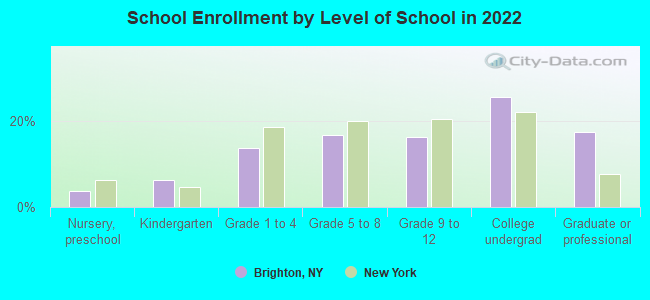
This place:
15.5%
New York:
22.6%
Median real estate property taxes paid for housing units with mortgages in 2022: $7,391 (2.8%) Median real estate property taxes paid for housing units with no mortgage in 2022: $6,648 (2.6%)
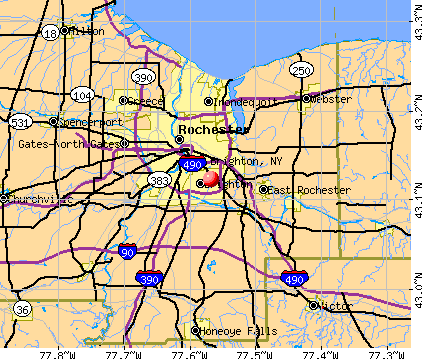
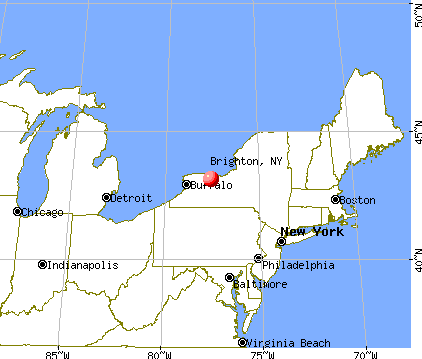
Nearest city with pop. 50,000+: Rochester, NY (3.6 miles , pop. 219,773).
Nearest city with pop. 1,000,000+: Manhattan, NY (246.3 miles , pop. 1,537,195).
Air Quality Index (AQI) level in 2023 was 88.5. This is worse than average.
City:
88.5
U.S.:
72.6
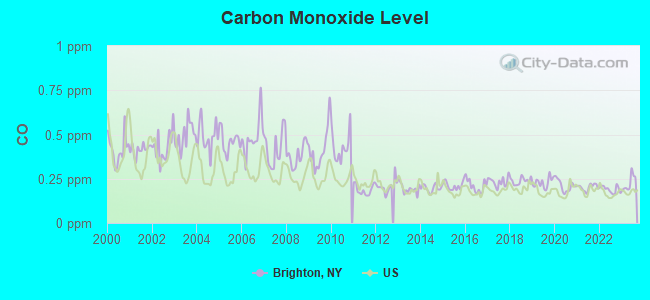
Carbon Monoxide (CO) [ppm] level in 2023 was 0.225. This is about average.Closest monitor was 1.9 miles away from the city center.
City:
0.225
U.S.:
0.251
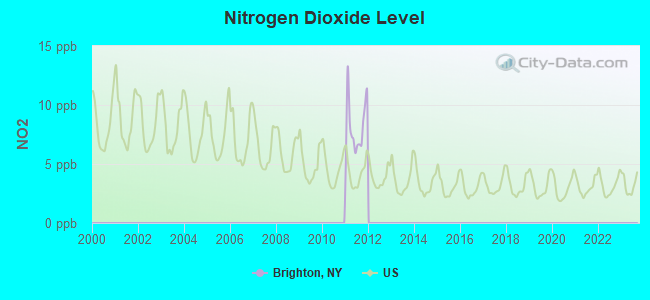
Nitrogen Dioxide (NO2) [ppb] level in 2011 was 8.11. This is significantly worse than average.Closest monitor was 1.9 miles away from the city center.
City:
8.11
U.S.:
5.11
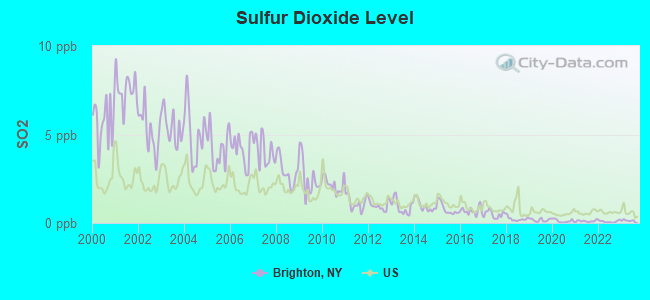
Sulfur Dioxide (SO2) [ppb] level in 2023 was 0.128. This is significantly better than average.Closest monitor was 0.2 miles away from the city center.
City:
0.128
U.S.:
1.515
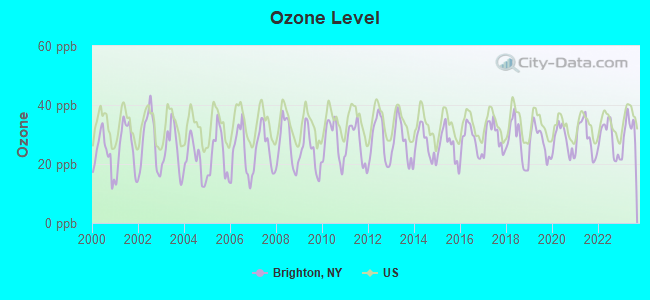
Ozone [ppb] level in 2023 was 31.3. This is about average.Closest monitor was 1.9 miles away from the city center.
City:
31.3
U.S.:
33.3
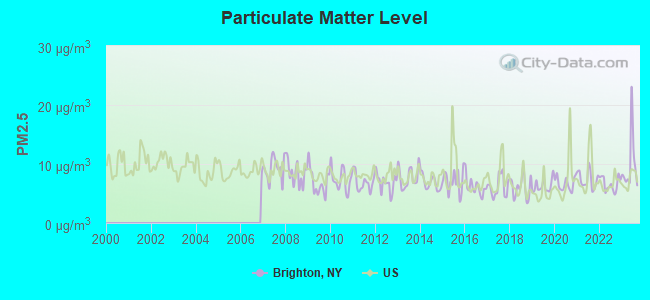
Particulate Matter (PM2.5) [µg/m3] level in 2023 was 9.83. This is worse than average.Closest monitor was 1.9 miles away from the city center.
City:
9.83
U.S.:
8.11
Earthquake activity:
Brighton-area historical earthquake activity is significantly above New York state average. It is 68% smaller than the overall U.S. average.
On 10/7/1983 at 10:18:46, a magnitude 5.3 (5.1 MB, 5.3 LG, 5.1 ML, Class: Moderate, Intensity: VI - VII) earthquake occurred 171.6 miles away from Brighton center On 9/25/1998 at 19:52:52, a magnitude 5.2 (4.8 MB, 4.3 MS, 5.2 LG, 4.5 MW, Depth: 3.1 mi) earthquake occurred 183.5 miles away from Brighton center On 4/20/2002 at 10:50:47, a magnitude 5.3 (5.3 ML, Depth: 3.0 mi) earthquake occurred 215.7 miles away from Brighton center On 4/20/2002 at 10:50:47, a magnitude 5.2 (5.2 MB, 4.2 MS, 5.2 MW, 5.0 MW) earthquake occurred 214.1 miles away from Brighton center On 1/31/1986 at 16:46:43, a magnitude 5.0 (5.0 MB) earthquake occurred 211.6 miles away from Brighton center On 8/23/2011 at 17:51:04, a magnitude 5.8 (5.8 MW, Depth: 3.7 mi) earthquake occurred 361.1 miles away from Brighton center Magnitude types: regional Lg-wave magnitude (LG), body-wave magnitude (MB), local magnitude (ML), surface-wave magnitude (MS), moment magnitude (MW)
Natural disasters:
The number of natural disasters in Monroe County (17) is near the US average (15). Major Disasters (Presidential) Declared: 10 Emergencies Declared: 6
Causes of natural disasters: Floods: 5, Storms: 5, Winter Storms: 3, Hurricanes: 2, Ice Storms: 2, Blizzard: 1, Power Outage: 1, Tropical Storm: 1, Wind: 1, Other: 2 (Note: some incidents may be assigned to more than one category).
Hospitals and medical centers near Brighton:
THE BRIGHTONIAN (Nursing Home, about 1 miles away; ROCHESTER, NY)
BLOSSOM SOUTH NURSING AND REHABILITATION CENTER (Nursing Home, about 2 miles away; ROCHESTER, NY)
THE HIGHLANDS AT BRIGHTON (Nursing Home, about 2 miles away; ROCHESTER, NY)
JEWISH HOME OF ROCHESTER (Nursing Home, about 2 miles away; ROCHESTER, NY)
STRONG HEALTH DIALYSIS-CLINTON CROSSINGS (Dialysis Facility, about 2 miles away; ROCHESTER, NY)
WOODSIDE MANOR NURSING HOME (Nursing Home, about 2 miles away; ROCHESTER, NY)
FINGER LAKES DDSO - MONROE DC (Hospital, about 3 miles away; ROCHESTER, NY)
Amtrak station near Brighton:
4 miles: ROCHESTER (320 CENTRAL AVE.) . Services: ticket office, partially wheelchair accessible, enclosed waiting area, public restrooms, public payphones, vending machines, free short-term parking, call for car rental service, taxi stand, public transit connection.
Operable nuclear power plant near Brighton:
4 miles: R.E. Ginna in Rochester, NY.
Colleges/universities with over 2000 students nearest to Brighton:
Monroe Community College (about 3 miles; Rochester, NY; Full-time enrollment: 14,295)
Saint John Fisher College (about 3 miles; Rochester, NY; FT enrollment: 3,373)
Nazareth College (about 4 miles; Rochester, NY; FT enrollment: 2,632)
University of Rochester (about 4 miles; Rochester, NY; FT enrollment: 10,201)
Rochester Institute of Technology (about 6 miles; Rochester, NY; FT enrollment: 14,177)
SUNY College at Brockport (about 21 miles; Brockport, NY; FT enrollment: 7,398)
Finger Lakes Community College (about 25 miles; Canandaigua, NY; FT enrollment: 4,732)
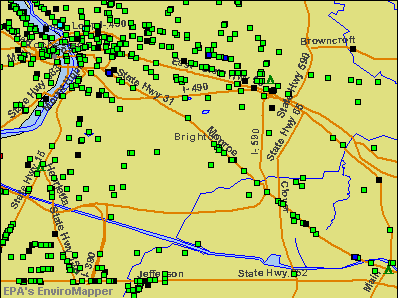
Notable locations in Brighton: Westfall (A), Country Club of Rochester (B), Rochester Country Club (C), Stone Tolan House (D), Brighton Landfill (E), Meridan Centre (F), Crossbridge Office Park (G), Corporate Woods (H), Canal View Office Park (I), Cambridge Place Corporate Center (J), Brighton Meadows Business Park (K), Brighton Corners Office Park (L), Allens Creek Office Park (M), Metro Industrial Park (N), Center For Optoelectronics And Imaging (O), Laboratory For Laser Energetics (P), River Road Complex (Q), Jewish Home and Infirmary of Rochester (R), Summit at Brighton (S), The Brightonian (T). Display/hide their locations on the map
Shopping Centers: Winton Place Shopping Center (1), West Brighton Plaza Shopping Center (2), Twelve Corners Plaza Shopping Center (3), Southview Commons Shopping Center (4), Clover Commons Shopping Center (5), Brighton Commons Shopping Center (6). Display/hide their locations on the map
Churches in Brighton include: Saint Marks Church (A), Twelve Corners Church (B), Atonement Lutheran Church (C), Baptist Temple Church (D), Brighton United Church of Christ (E), Chabad Lubavitch of Rochester (F), Edgewood Free Methodist Church (G), Faith Temple Church (H), First Baptist Church (I). Display/hide their locations on the map
Birthplace of: Jack Cronin - Baseball player, Tuck Turner - Baseball player.
Monroe County has a predicted average indoor radon screening level between 2 and 4 pCi/L (pico curies per liter) - Moderate Potential
Average household size:
This place:
2.2 people
New York:
2.6 people
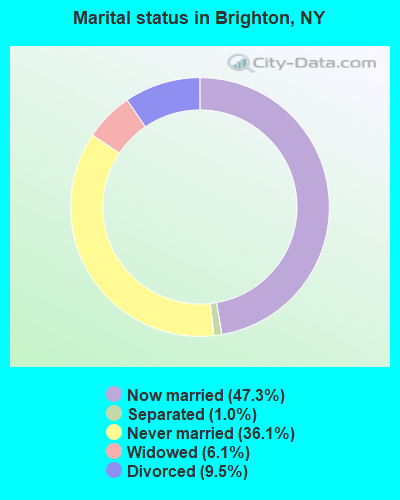
Percentage of family households:
This place:
54.1%
Whole state:
63.5%
Percentage of households with unmarried partners:
This place:
5.6%
Whole state:
6.8%
Likely homosexual households (counted as self-reported same-sex unmarried-partner households)
Lesbian couples: 0.6% of all households
Gay men: 0.4% of all households
People in group quarters in Brighton in 2010:
850 people in nursing facilities/skilled-nursing facilities
756 people in college/university student housing
321 people in local jails and other municipal confinement facilities
142 people in group homes intended for adults
124 people in residential treatment centers for adults
78 people in other noninstitutional facilities
6 people in group homes for juveniles (non-correctional)
People in group quarters in Brighton in 2000:
914 people in nursing homes
431 people in local jails and other confinement facilities (including police lockups)
105 people in religious group quarters
92 people in schools, hospitals, or wards for the intellectually disabled
86 people in homes for the mentally retarded
10 people in other nonhousehold living situations
9 people in other group homes
8 people in other noninstitutional group quarters
Banks with branches in Brighton (2011 data):
Manufacturers and Traders Trust Company: Brighton Branch at 1627 Monroe Avenue, branch established on 1980/05/12. Info updated 2011/08/08: Bank assets: $76,887.1 mil, Deposits: $60,064.2 mil, headquarters in Buffalo, NY, positive income, Commercial Lending Specialization, 808 total offices, Holding Company: M&T Bank Corporation
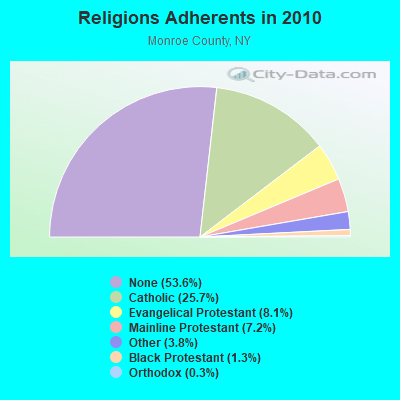
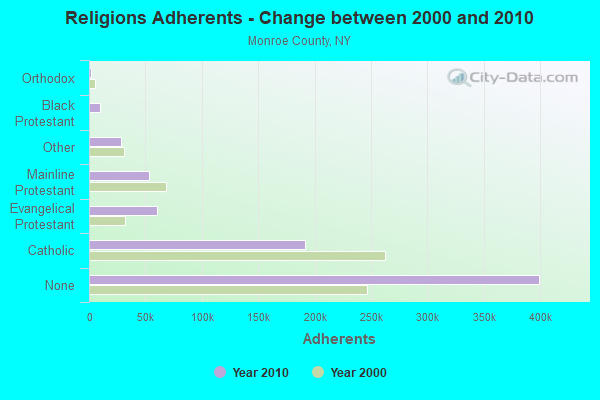
Religion statistics for Brighton, NY (based on Monroe County data)
Religion
Adherents
Congregations
Catholic
191,112
65
Evangelical Protestant
60,385
240
Mainline Protestant
53,463
151
Other
28,550
74
Black Protestant
9,459
30
Orthodox
2,038
11
None
399,337
-
Source: Clifford Grammich, Kirk Hadaway, Richard Houseal, Dale E.Jones, Alexei Krindatch, Richie Stanley and Richard H.Taylor. 2012. 2010 U.S.Religion Census: Religious Congregations & Membership Study. Association of Statisticians of American Religious Bodies. Jones, Dale E., et al. 2002. Congregations and Membership in the United States 2000. Nashville, TN: Glenmary Research Center. Graphs represent county-level data
Call Sign: KD2VGM, Licensee ID: L02400476, Grant Date: 12/21/2020, Expiration Date: 12/21/2030, Certifier: Robert J Hannon, Registrant: Robert J Hannon, 60 Coniston Dr, Brighton, NY 14610-2116
Call Sign: KE2AMK, Licensee ID: L02623214, Grant Date: 12/20/2022, Expiration Date: 12/20/2032, Certifier: Joseph A Moore, Registrant: Joseph A Moore, 304 Suburban Ct Apt 2, Brighton, NY 14620-3828
Home Mortgage Disclosure Act Aggregated Statistics For Year 2009 (Based on 7 full tracts)
A) FHA, FSA/RHS & VA Home Purchase Loans
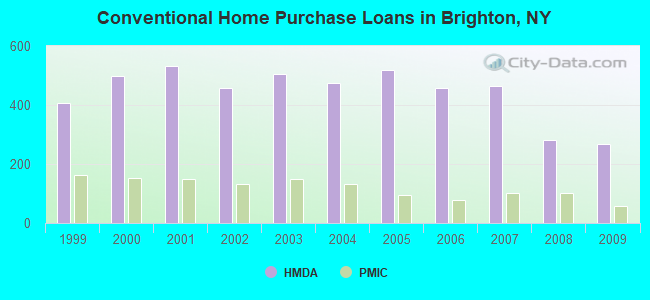
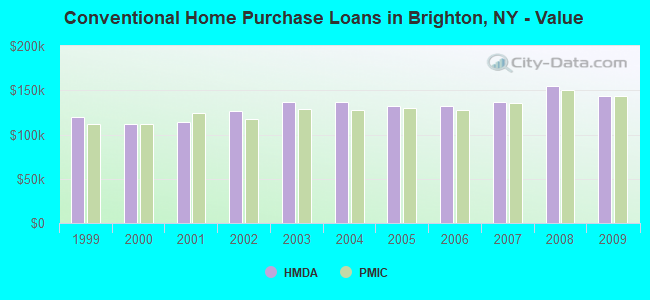
B) Conventional Home Purchase Loans
C) Refinancings
D) Home Improvement Loans
E) Loans on Dwellings For 5+ Families
F) Non-occupant Loans on < 5 Family Dwellings (A B C & D)
G) Loans On Manufactured Home Dwelling (A B C & D)
Number
Average Value
Number
Average Value
Number
Average Value
Number
Average Value
Number
Average Value
Number
Average Value
Number
Average Value
LOANS ORIGINATED
115
$148,974
268
$143,822
433
$149,938
68
$40,139
1
$2,900,000
13
$175,117
1
$181,000
APPLICATIONS APPROVED, NOT ACCEPTED
5
$151,400
22
$156,739
35
$175,614
5
$38,400
0
$0
0
$0
0
$0
APPLICATIONS DENIED
17
$150,328
23
$164,489
101
$186,245
25
$19,276
0
$0
6
$48,333
0
$0
APPLICATIONS WITHDRAWN
10
$163,216
11
$106,950
66
$168,145
8
$49,475
0
$0
0
$0
0
$0
FILES CLOSED FOR INCOMPLETENESS
1
$169,000
1
$102,690
31
$138,874
1
$30,000
0
$0
2
$56,500
0
$0
Aggregated Statistics For Year 2008 (Based on 7 full tracts)
A) FHA, FSA/RHS & VA Home Purchase Loans
B) Conventional Home Purchase Loans
C) Refinancings
D) Home Improvement Loans
E) Loans on Dwellings For 5+ Families
F) Non-occupant Loans on < 5 Family Dwellings (A B C & D)
G) Loans On Manufactured Home Dwelling (A B C & D)
Number
Average Value
Number
Average Value
Number
Average Value
Number
Average Value
Number
Average Value
Number
Average Value
Number
Average Value
LOANS ORIGINATED
91
$136,778
280
$155,190
160
$144,252
73
$44,476
1
$8,600,000
14
$102,622
0
$0
APPLICATIONS APPROVED, NOT ACCEPTED
14
$132,669
32
$159,060
28
$131,879
10
$31,300
0
$0
2
$50,000
1
$20,000
APPLICATIONS DENIED
15
$144,599
25
$142,104
87
$157,535
33
$23,384
0
$0
5
$73,132
0
$0
APPLICATIONS WITHDRAWN
4
$154,500
18
$161,342
44
$150,437
12
$59,996
0
$0
0
$0
0
$0
FILES CLOSED FOR INCOMPLETENESS
2
$116,150
8
$72,750
16
$123,610
0
$0
0
$0
2
$62,000
0
$0
Aggregated Statistics For Year 2007 (Based on 7 full tracts)
A) FHA, FSA/RHS & VA Home Purchase Loans
B) Conventional Home Purchase Loans
C) Refinancings
D) Home Improvement Loans
E) Loans on Dwellings For 5+ Families
F) Non-occupant Loans on < 5 Family Dwellings (A B C & D)
G) Loans On Manufactured Home Dwelling (A B C & D)
Number
Average Value
Number
Average Value
Number
Average Value
Number
Average Value
Number
Average Value
Number
Average Value
Number
Average Value
LOANS ORIGINATED
61
$137,208
464
$137,230
177
$119,161
86
$38,965
2
$10,808,500
22
$181,311
0
$0
APPLICATIONS APPROVED, NOT ACCEPTED
2
$166,000
32
$159,424
39
$129,394
23
$34,536
0
$0
3
$131,333
1
$108,000
APPLICATIONS DENIED
4
$123,398
38
$143,783
124
$131,186
46
$46,120
0
$0
11
$97,446
0
$0
APPLICATIONS WITHDRAWN
4
$101,925
23
$115,534
90
$118,527
18
$49,111
0
$0
3
$97,000
1
$105,000
FILES CLOSED FOR INCOMPLETENESS
3
$118,000
18
$116,809
27
$120,504
2
$50,000
0
$0
2
$160,000
0
$0
Aggregated Statistics For Year 2006 (Based on 7 full tracts)
A) FHA, FSA/RHS & VA Home Purchase Loans
B) Conventional Home Purchase Loans
C) Refinancings
D) Home Improvement Loans
E) Loans on Dwellings For 5+ Families
F) Non-occupant Loans on < 5 Family Dwellings (A B C & D)
G) Loans On Manufactured Home Dwelling (A B C & D)
Number
Average Value
Number
Average Value
Number
Average Value
Number
Average Value
Number
Average Value
Number
Average Value
Number
Average Value
LOANS ORIGINATED
65
$135,539
458
$132,182
239
$111,507
112
$36,526
3
$7,855,333
30
$97,735
0
$0
APPLICATIONS APPROVED, NOT ACCEPTED
5
$143,800
35
$151,573
48
$113,255
16
$37,872
0
$0
2
$109,500
1
$20,000
APPLICATIONS DENIED
2
$170,500
36
$125,346
137
$105,576
62
$61,524
0
$0
14
$58,691
0
$0
APPLICATIONS WITHDRAWN
3
$97,333
31
$130,400
91
$109,741
20
$73,218
0
$0
7
$89,210
0
$0
FILES CLOSED FOR INCOMPLETENESS
1
$113,660
30
$169,623
32
$168,291
2
$97,000
0
$0
4
$138,750
0
$0
Aggregated Statistics For Year 2005 (Based on 7 full tracts)
A) FHA, FSA/RHS & VA Home Purchase Loans
B) Conventional Home Purchase Loans
C) Refinancings
D) Home Improvement Loans
E) Loans on Dwellings For 5+ Families
F) Non-occupant Loans on < 5 Family Dwellings (A B C & D)
G) Loans On Manufactured Home Dwelling (A B C & D)
Number
Average Value
Number
Average Value
Number
Average Value
Number
Average Value
Number
Average Value
Number
Average Value
Number
Average Value
LOANS ORIGINATED
49
$129,175
520
$132,286
280
$119,126
91
$33,265
1
$16,000,000
28
$92,219
1
$5,000
APPLICATIONS APPROVED, NOT ACCEPTED
3
$111,210
39
$159,921
52
$117,086
25
$39,664
0
$0
5
$251,800
0
$0
APPLICATIONS DENIED
4
$97,148
23
$99,926
158
$130,209
62
$49,085
0
$0
16
$41,914
0
$0
APPLICATIONS WITHDRAWN
2
$108,500
31
$122,692
114
$143,678
6
$47,498
0
$0
1
$91,720
0
$0
FILES CLOSED FOR INCOMPLETENESS
1
$153,540
29
$143,677
45
$150,933
2
$30,000
0
$0
0
$0
0
$0
Aggregated Statistics For Year 2004 (Based on 7 full tracts)
A) FHA, FSA/RHS & VA Home Purchase Loans
B) Conventional Home Purchase Loans
C) Refinancings
D) Home Improvement Loans
E) Loans on Dwellings For 5+ Families
F) Non-occupant Loans on < 5 Family Dwellings (A B C & D)
G) Loans On Manufactured Home Dwelling (A B C & D)
Number
Average Value
Number
Average Value
Number
Average Value
Number
Average Value
Number
Average Value
Number
Average Value
Number
Average Value
LOANS ORIGINATED
50
$118,531
476
$136,566
363
$116,407
57
$38,518
1
$3,750,000
21
$91,731
0
$0
APPLICATIONS APPROVED, NOT ACCEPTED
3
$107,333
24
$159,491
60
$107,050
16
$45,681
0
$0
3
$113,427
1
$20,000
APPLICATIONS DENIED
3
$84,667
31
$141,146
139
$114,728
41
$38,726
1
$267,000
3
$133,333
0
$0
APPLICATIONS WITHDRAWN
4
$129,750
26
$135,718
103
$119,594
15
$54,129
0
$0
1
$108,000
1
$129,000
FILES CLOSED FOR INCOMPLETENESS
1
$128,000
10
$127,501
61
$118,175
2
$218,000
0
$0
2
$70,500
0
$0
Aggregated Statistics For Year 2003 (Based on 7 full tracts)
A) FHA, FSA/RHS & VA Home Purchase Loans
B) Conventional Home Purchase Loans
C) Refinancings
D) Home Improvement Loans
E) Loans on Dwellings For 5+ Families
F) Non-occupant Loans on < 5 Family Dwellings (A B C & D)
Number
Average Value
Number
Average Value
Number
Average Value
Number
Average Value
Number
Average Value
Number
Average Value
LOANS ORIGINATED
68
$108,994
504
$136,246
1,229
$115,505
45
$23,438
6
$2,682,833
33
$87,163
APPLICATIONS APPROVED, NOT ACCEPTED
3
$118,137
22
$158,478
112
$120,159
10
$26,564
0
$0
6
$97,000
APPLICATIONS DENIED
17
$104,231
18
$104,584
208
$115,467
22
$21,312
0
$0
6
$69,000
APPLICATIONS WITHDRAWN
64
$95,652
73
$131,913
122
$120,531
7
$51,714
0
$0
3
$78,937
FILES CLOSED FOR INCOMPLETENESS
5
$106,400
15
$129,800
28
$178,934
1
$31,000
0
$0
0
$0
Aggregated Statistics For Year 2002 (Based on 7 full tracts)
A) FHA, FSA/RHS & VA Home Purchase Loans
B) Conventional Home Purchase Loans
C) Refinancings
D) Home Improvement Loans
E) Loans on Dwellings For 5+ Families
F) Non-occupant Loans on < 5 Family Dwellings (A B C & D)
Number
Average Value
Number
Average Value
Number
Average Value
Number
Average Value
Number
Average Value
Number
Average Value
LOANS ORIGINATED
59
$110,014
458
$126,748
784
$115,511
69
$34,034
2
$7,750,000
21
$85,354
APPLICATIONS APPROVED, NOT ACCEPTED
4
$97,250
29
$132,705
95
$135,023
14
$40,351
0
$0
4
$104,188
APPLICATIONS DENIED
4
$82,595
29
$148,343
136
$100,655
24
$24,246
0
$0
3
$51,333
APPLICATIONS WITHDRAWN
2
$101,500
14
$178,683
100
$112,119
15
$31,128
0
$0
2
$57,000
FILES CLOSED FOR INCOMPLETENESS
1
$141,000
7
$127,223
46
$127,695
0
$0
0
$0
0
$0
Aggregated Statistics For Year 2001 (Based on 7 full tracts)
A) FHA, FSA/RHS & VA Home Purchase Loans
B) Conventional Home Purchase Loans
C) Refinancings
D) Home Improvement Loans
F) Non-occupant Loans on < 5 Family Dwellings (A B C & D)
Number
Average Value
Number
Average Value
Number
Average Value
Number
Average Value
Number
Average Value
LOANS ORIGINATED
69
$97,242
533
$113,692
520
$112,709
68
$21,031
15
$118,975
APPLICATIONS APPROVED, NOT ACCEPTED
2
$73,840
23
$138,580
49
$102,397
12
$16,326
1
$50,000
APPLICATIONS DENIED
7
$97,196
22
$74,662
158
$89,868
24
$20,703
4
$233,500
APPLICATIONS WITHDRAWN
4
$107,605
23
$84,808
131
$96,594
8
$26,866
1
$59,000
FILES CLOSED FOR INCOMPLETENESS
0
$0
4
$166,500
21
$115,229
0
$0
1
$10,000
Aggregated Statistics For Year 2000 (Based on 7 full tracts)
A) FHA, FSA/RHS & VA Home Purchase Loans
B) Conventional Home Purchase Loans
C) Refinancings
D) Home Improvement Loans
E) Loans on Dwellings For 5+ Families
F) Non-occupant Loans on < 5 Family Dwellings (A B C & D)
Number
Average Value
Number
Average Value
Number
Average Value
Number
Average Value
Number
Average Value
Number
Average Value
LOANS ORIGINATED
64
$92,182
497
$111,332
139
$74,355
71
$22,925
2
$126,000
14
$67,000
APPLICATIONS APPROVED, NOT ACCEPTED
1
$114,000
29
$126,082
22
$76,293
28
$26,095
0
$0
0
$0
APPLICATIONS DENIED
7
$63,973
26
$119,818
84
$72,845
29
$27,303
0
$0
2
$125,500
APPLICATIONS WITHDRAWN
3
$83,333
26
$136,663
59
$58,313
18
$38,719
0
$0
2
$110,500
FILES CLOSED FOR INCOMPLETENESS
2
$108,305
5
$151,876
11
$99,091
1
$22,000
0
$0
0
$0
Aggregated Statistics For Year 1999 (Based on 7 full tracts)
A) FHA, FSA/RHS & VA Home Purchase Loans
B) Conventional Home Purchase Loans
C) Refinancings
D) Home Improvement Loans
E) Loans on Dwellings For 5+ Families
F) Non-occupant Loans on < 5 Family Dwellings (A B C & D)
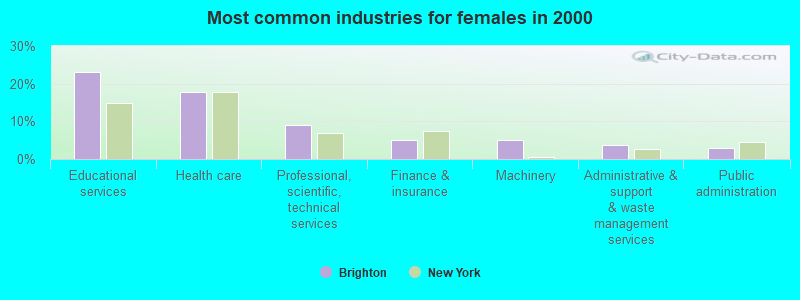
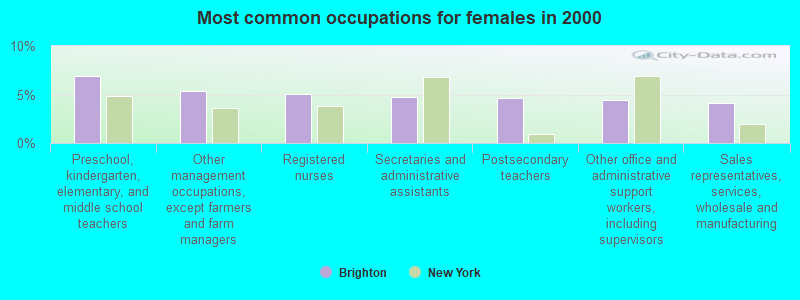
#49 on the list of "Top 101 cities with largest percentage of females in occupations: health diagnosing and treating practitioners and other technical occupations (population 5,000+)"
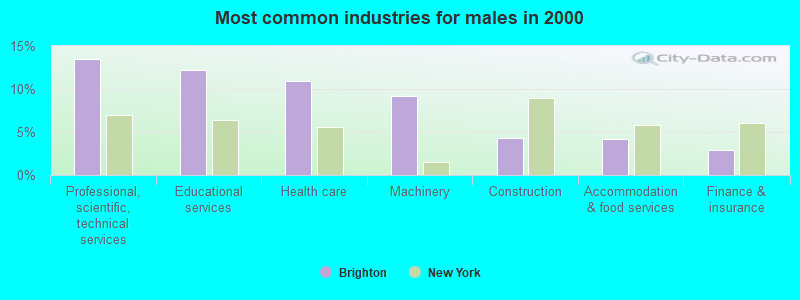
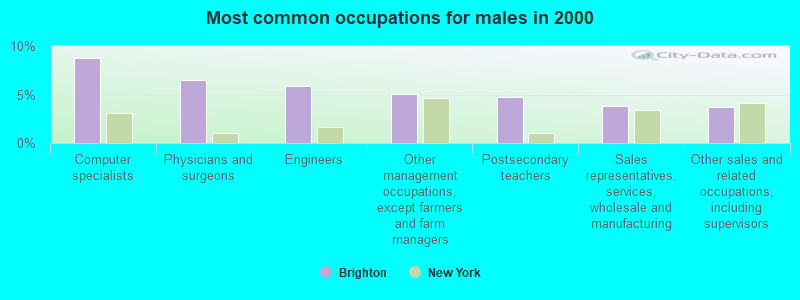
#96 on the list of "Top 101 cities with largest percentage of males in occupations: education, training, and library occupations (population 5,000+)"
#96 on the list of "Top 101 cities with largest percentage of females in occupations: legal occupations (population 5,000+)"
#100 (14618) on the list of "Top 101 zip codes with the most beauty salons in 2005"
#20 on the list of "Top 101 counties with the highest percentage of residents that visited a dentist within the past year"
#21 on the list of "Top 101 counties with the largest increase in the number of infant deaths per 1000 residents 2000-2006 to 2007-2013 (pop. 50,000+)"
#22 on the list of "Top 101 counties with the lowest percentage of residents relocating from other counties between 2010 and 2011 (pop. 50,000+)"
#33 on the list of "Top 101 counties with the lowest percentage of residents relocating to other counties in 2011"
#35 on the list of "Top 101 counties with the most Catholic congregations (pop. 50,000+)"


 Recent articles from our blog. Our writers, many of them Ph.D. graduates or candidates, create easy-to-read articles on a wide variety of topics.

 (3.6 miles