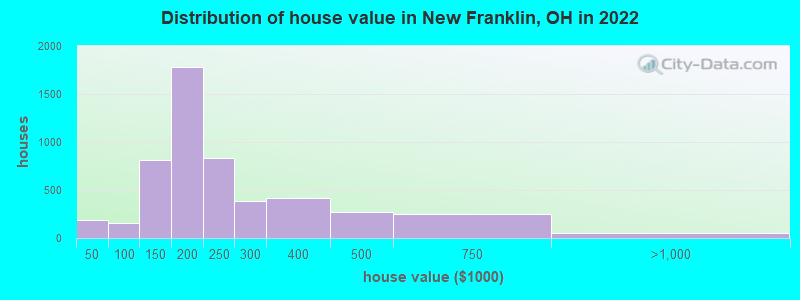
Estimated median house or condo value in 2022: $198,279 (it was $126,900 in 2000)
New Franklin:
$198,279
OH:
$204,100
Mean prices in 2022:all housing units: $249,324; detached houses: $253,451; in 2-unit structures: $241,602; in 3-to-4-unit structures: $113,307; mobile homes: $24,519
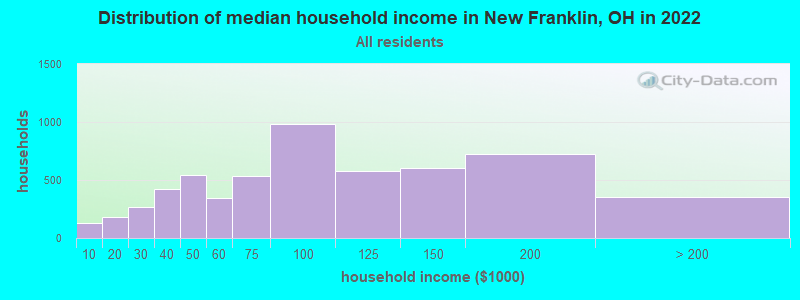
Median gross rent in 2022: $980.
March 2022 cost of living index in New Franklin: 95.8 (near average, U.S. average is 100)
Percentage of residents living in poverty in 2022: 4.7%
(4.4% for White Non-Hispanic residents, 32.5% for Black residents, 17.3% for Hispanic or Latino residents, 9.6% for two or more races residents)
According to our research of Ohio and other state lists, there were 3 registered sex offenders living in New Franklin, Ohio as of May 14, 2024. The ratio of all residents to sex offenders in New Franklin is 4,722 to 1. The ratio of registered sex offenders to all residents in this city is much lower than the state average.
Crime rates in New Franklin by year
Type
2009
2010
2011
2012
2013
2014
2015
2016
2017
2018
2019
2020
2021
2022
Murders (per 100,000)
0 (0.0)
0 (0.0)
1 (7.0)
1 (7.1)
0 (0.0)
0 (0.0)
1 (7.0)
0 (0.0)
0 (0.0)
1 (7.1)
0 (0.0)
0 (0.0)
0 (0.0)
0 (0.0)
Rapes (per 100,000)
0 (0.0)
2 (14.1)
3 (21.1)
0 (0.0)
2 (14.1)
1 (7.0)
7 (48.9)
1 (7.0)
3 (21.2)
0 (0.0)
2 (14.1)
3 (21.2)
3 (21.3)
2 (14.6)
Robberies (per 100,000)
2 (13.3)
0 (0.0)
0 (0.0)
0 (0.0)
2 (14.1)
2 (14.0)
0 (0.0)
2 (14.0)
2 (14.1)
0 (0.0)
2 (14.1)
2 (14.2)
0 (0.0)
1 (7.3)
Assaults (per 100,000)
1 (6.7)
0 (0.0)
0 (0.0)
2 (14.1)
1 (7.0)
1 (7.0)
4 (28.0)
6 (42.0)
10 (70.7)
3 (21.2)
4 (28.2)
4 (28.3)
12 (85.2)
5 (36.4)
Burglaries (per 100,000)
61 (407.0)
47 (330.4)
47 (330.1)
29 (204.6)
21 (147.6)
19 (132.6)
36 (251.6)
30 (210.0)
29 (205.1)
38 (268.4)
21 (148.3)
20 (141.6)
18 (127.8)
12 (87.3)
Thefts (per 100,000)
88 (587.2)
83 (583.4)
80 (561.9)
57 (402.1)
52 (365.4)
60 (418.8)
82 (573.1)
74 (518.0)
84 (594.2)
74 (522.7)
59 (416.6)
62 (438.9)
69 (489.7)
63 (458.4)
Auto thefts (per 100,000)
6 (40.0)
3 (21.1)
8 (56.2)
3 (21.2)
2 (14.1)
3 (20.9)
7 (48.9)
6 (42.0)
4 (28.3)
8 (56.5)
5 (35.3)
7 (49.6)
8 (56.8)
2 (14.6)
Arson (per 100,000)
1 (6.7)
1 (7.0)
3 (21.1)
2 (14.1)
0 (0.0)
0 (0.0)
1 (7.0)
2 (14.0)
0 (0.0)
0 (0.0)
0 (0.0)
1 (7.1)
0 (0.0)
0 (0.0)
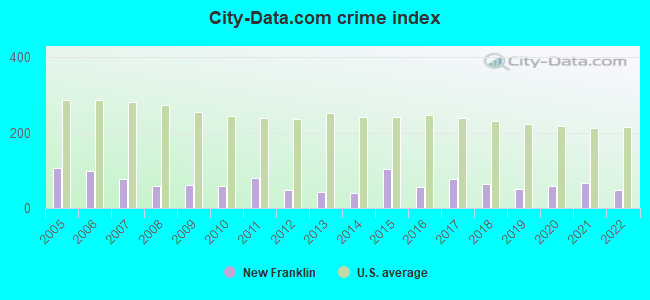
City-Data.com crime index
60.5
59.4
81.0
49.0
42.9
38.9
103.2
57.0
75.8
62.6
51.1
58.3
67.1
46.7
The City-Data.com crime index weighs serious crimes and violent crimes more heavily. Higher means more crime, U.S. average is 246.1. It adjusts for the number of visitors and daily workers commuting into cities.
Latest news from New Franklin, OH collected exclusively by city-data.com from local newspapers, TV, and radio stations
Ancestries: German (18.7%), American (18.5%), Italian (12.8%), Irish (9.4%), English (7.3%), Hungarian (4.4%).
Current Local Time: EST time zone
Land area: 2.22 square miles.
Population density: 6,188 people per square mile (high).
237 residents are foreign born
This village:
1.7%
Ohio:
4.9%
Median real estate property taxes paid for housing units with mortgages in 2022: $3,027 (1.5%) Median real estate property taxes paid for housing units with no mortgage in 2022: $2,950 (1.6%)
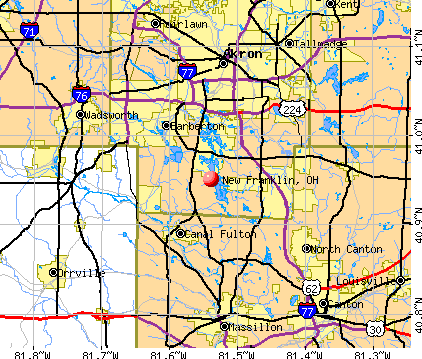
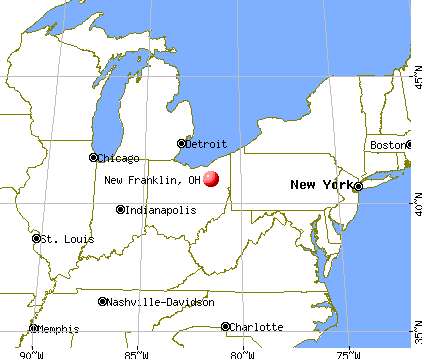
Nearest city with pop. 50,000+: Akron, OH (8.5 miles , pop. 217,074).
Nearest city with pop. 1,000,000+: Chicago, IL (324.4 miles , pop. 2,896,016).
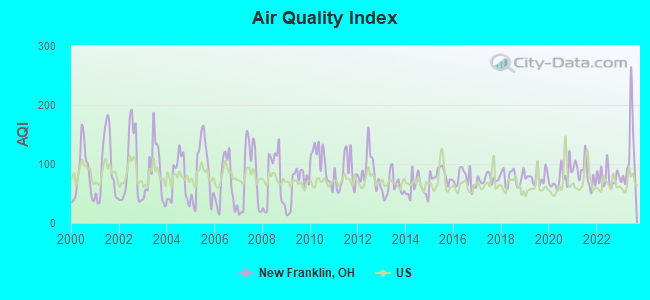
Air Quality Index (AQI) level in 2023 was 114. This is significantly worse than average.
City:
114
U.S.:
73
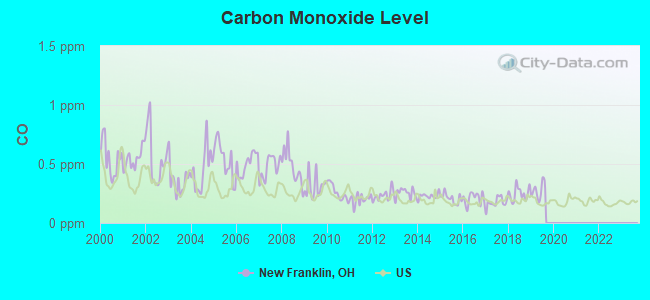
Carbon Monoxide (CO) [ppm] level in 2019 was 0.276. This is about average.Closest monitor was 5.5 miles away from the city center.
City:
0.276
U.S.:
0.251
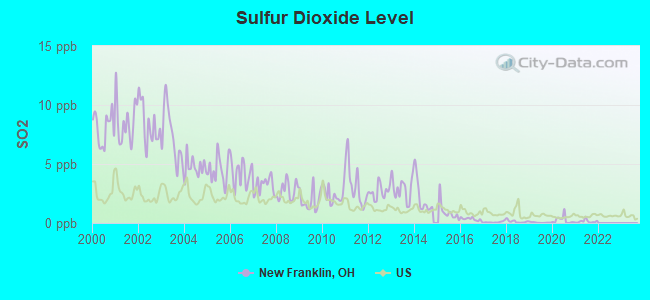
Sulfur Dioxide (SO2) [ppb] level in 2021 was 0.136. This is significantly better than average.Closest monitor was 3.4 miles away from the city center.
City:
0.136
U.S.:
1.515
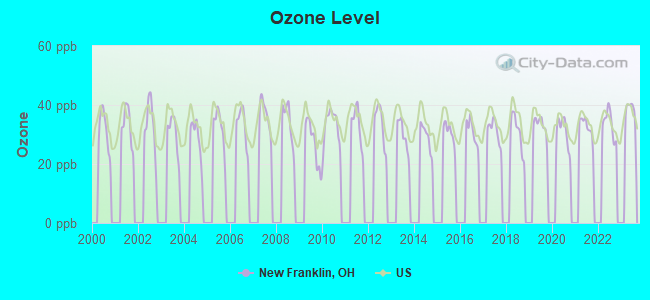
Ozone [ppb] level in 2022 was 33.6. This is about average.Closest monitor was 5.8 miles away from the city center.
City:
33.6
U.S.:
33.3
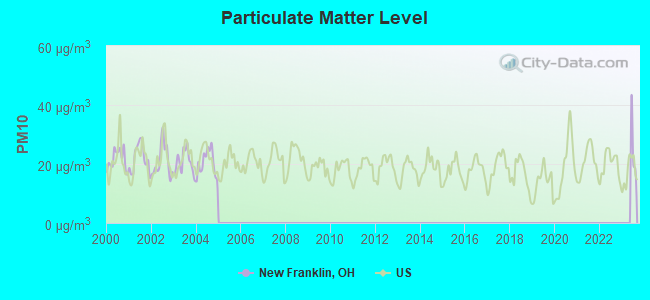
Particulate Matter (PM10) [µg/m3] level in 2004 was 20.4. This is about average.Closest monitor was 5.8 miles away from the city center.
City:
20.4
U.S.:
19.2
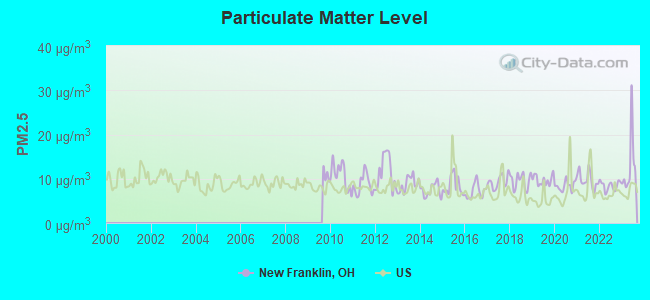
Particulate Matter (PM2.5) [µg/m3] level in 2023 was 12.9. This is significantly worse than average.Closest monitor was 8.6 miles away from the city center.
City:
12.9
U.S.:
8.1
Tornado activity:
New Franklin-area historical tornado activity is near Ohio state average. It is 13% greater than the overall U.S. average.
On 5/31/1985, a category F5 (max. wind speeds 261-318 mph) tornado 26.6 miles away from the New Franklin village center killed 18 peopleand injured 310 peopleand causedbetween $50,000,000 and $500,000,000 in damages.
On 4/11/1965, a category F4 (max. wind speeds 207-260 mph) tornado 30.3 miles away from the village center killed 18 peopleand injured 200 peopleand causedbetween $5,000,000 and $50,000,000 in damages.
Earthquake activity:
New Franklin-area historical earthquake activity is significantly above Ohio state average. It is 47% smaller than the overall U.S. average.
On 9/25/1998 at 19:52:52, a magnitude 5.2 (4.8 MB, 4.3 MS, 5.2 LG, 4.5 MW, Depth: 3.1 mi, Class: Moderate, Intensity: VI - VII) earthquake occurred 70.2 miles away from the city center On 1/31/1986 at 16:46:43, a magnitude 5.0 (5.0 MB) earthquake occurred 49.2 miles away from the city center On 8/23/2011 at 17:51:04, a magnitude 5.8 (5.8 MW, Depth: 3.7 mi) earthquake occurred 285.1 miles away from the city center On 7/27/1980 at 18:52:21, a magnitude 5.2 (5.1 MB, 4.7 MS, 5.0 UK, 5.2 UK) earthquake occurred 229.1 miles away from New Franklin center On 12/31/2011 at 20:05:01, a magnitude 4.0 (4.0 ML, Depth: 3.1 mi, Class: Light, Intensity: IV - V) earthquake occurred 46.1 miles away from New Franklin center On 7/12/1986 at 08:19:37, a magnitude 4.5 (4.5 MB) earthquake occurred 151.1 miles away from New Franklin center Magnitude types: regional Lg-wave magnitude (LG), body-wave magnitude (MB), local magnitude (ML), surface-wave magnitude (MS), moment magnitude (MW)
Natural disasters:
The number of natural disasters in Summit County (11) is smaller than the US average (15). Major Disasters (Presidential) Declared: 7 Emergencies Declared: 3
Causes of natural disasters: Storms: 6, Tornadoes: 5, Floods: 4, Winds: 2, Blizzard: 1, Hurricane: 1, Power Outage: 1, Snowstorm: 1, Tropical Depression: 1, Other: 1 (Note: some incidents may be assigned to more than one category).
Hospitals and medical centers near New Franklin:
ST LUKE LUTHERAN COMMUNITY-PORTAGE LAKES (Nursing Home, about 1 miles away; AKRON, OH)
GENTIVA HEALTH SERVICES (Home Health Center, about 4 miles away; AKRON, OH)
PEBBLE CREEK (Nursing Home, about 4 miles away; AKRON, OH)
PEBBLE CREEK SENIOR CARE RESIDENCE (Nursing Home, about 4 miles away; AKRON, OH)
FMC - AKRON CANTON KIDNEY CENTER (Dialysis Facility, about 4 miles away; UNIONTOWN, OH)
PDS-STRAUSSER (Hospital, about 4 miles away; CANAL FULTON, OH)
HOME IV TEAM INC (Home Health Center, about 5 miles away; AKRON, OH)
Summit County has a predicted average indoor radon screening level greater than 4 pCi/L (pico curies per liter) - Highest Potential
Drinking water stations with addresses in New Franklin and their reported violations in the past:
HOUSE OF EBERHARDT FUNERAL HOME (Population served: 50, Groundwater):
Past health violations:
MCL, Monthly (TCR) - Between APR-2009 and JUN-2009, Contaminant: Coliform. Follow-up actions: St Violation/Reminder Notice (JUL-09-2009), St Public Notif requested (JUL-09-2009), St Compliance achieved (FEB-09-2010)
Past monitoring violations:
2 routine major monitoring violations
One regular monitoring violation
Average household size:
This village:
2.5 people
Ohio:
2.4 people
Percentage of family households:
This village:
72.9%
Whole state:
65.0%
Percentage of households with unmarried partners:
This village:
5.6%
Whole state:
6.8%
Likely homosexual households (counted as self-reported same-sex unmarried-partner households)
Lesbian couples: 0.3% of all households
Gay men: 0.3% of all households
People in group quarters in New Franklin in 2010:
55 people in nursing facilities/skilled-nursing facilities
11 people in emergency and transitional shelters (with sleeping facilities) for people experiencing homelessness
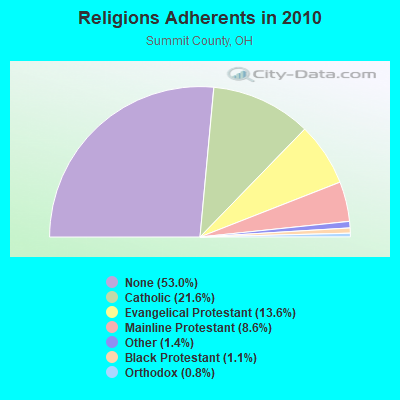
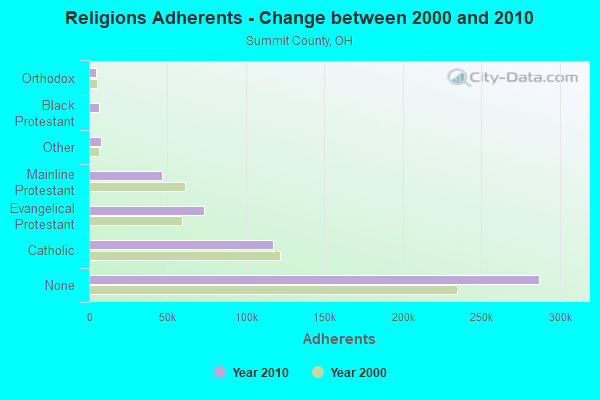
Religion statistics for New Franklin, OH (based on Summit County data)
Religion
Adherents
Congregations
Catholic
116,941
33
Evangelical Protestant
73,586
254
Mainline Protestant
46,521
127
Other
7,347
34
Black Protestant
6,129
26
Orthodox
4,230
12
None
287,027
-
Source: Clifford Grammich, Kirk Hadaway, Richard Houseal, Dale E.Jones, Alexei Krindatch, Richie Stanley and Richard H.Taylor. 2012. 2010 U.S.Religion Census: Religious Congregations & Membership Study. Association of Statisticians of American Religious Bodies. Jones, Dale E., et al. 2002. Congregations and Membership in the United States 2000. Nashville, TN: Glenmary Research Center. Graphs represent county-level data
45,650Total future (year 2035) average daily traffic
FCC Registered Antenna Towers:
3
Donald A Peterson, W Side Of Whitaker Rd .25 Mi S Of Sr 172 (Lat: 40.790361 Lon: -81.107056), Type: 147.5, Overall height: 146.6 m, Registrant: Carl E. Smith Consulting Engineers, 807 Bath, Phone: (330) 659-4440
Donald A Peterson, W Side Of Whitaker Rd .25 Mi S Of Sr 172 (Lat: 40.790361 Lon: -81.107056), Type: 147.5, Overall height: 146.6 m, Registrant: Carl E. Smith Consulting Engineers, 807 Bath, Phone: (330) 659-4440
W Side Of Whitaker Rd .25 Mi S Of Sr 172 (Lat: 40.790000 Lon: -81.106944), Type: 147.5, Overall height: 146.3 m, Registrant: D A Peterson Inc, Wzkl@aol.Com, , Allia-nce, Phone: (330) 821-1111
FCC Registered Broadcast Land Mobile Towers:
2
1/2 Mi N On Sr 172 On Whitacre Ave (Lat: 40.790056 Lon: -81.107056), Call Sign: WYK262, Assigned Frequencies: 30.7800 MHz, Grant Date: 08/04/1998, Expiration Date: 09/02/2003, Cancellation Date: 03/04/2002, Registrant: Lomak Petroleum Inc, 125 Sr 43, Hartville, OH 44632, Phone: (216) 877-6747
Aircraft: PIPITONE GUY L PITTS S-1S/T (Category: Land, Weight: Up to 12,499 Pounds), Engine: LYCOMING I0360 SER A&C (200 HP) (Reciprocating) N-Number: 148GP, N148GP, N-148GP, Serial Number: WP-001-A, Year manufactured: 1986, Airworthiness Date: 10/16/1986, Certificate Issue Date: 10/15/1990 Registrant (Individual): Guy L Pipitone, 4496 Lahm Dr, New Franklin, OH 44319
Aircraft: CESSNA 150H (Category: Land, Seats: 2, Weight: Up to 12,499 Pounds, Speed: 90 mph), Engine: CONT MOTOR 0-200 SERIES (100 HP) (Reciprocating) N-Number: 23156, N23156, N-23156, Serial Number: 15068759, Year manufactured: 1968, Airworthiness Date: 04/18/1968, Certificate Issue Date: 08/07/2014 Registrant (Individual): Dennis M Sabbagh, 6957 Cleveland Massillon Rd, New Franklin, OH 44216
Aircraft: FUREY JOHN P VANS RV6A (Category: Land, Seats: 2, Weight: Up to 12,499 Pounds), Engine: LYCOMING 0-360-A1D (180 HP) (Reciprocating) N-Number: 31JL, N31JL, N-31JL, Serial Number: 23373, Year manufactured: 2000, Airworthiness Date: 08/10/2000, Certificate Issue Date: 12/02/2002 Registrant (Corporation): B & L Leasing Inc, 4570 Lahm Dr, New Franklin, OH 44319
Aircraft: SOCATA TBM 700 (Category: Land, Seats: 7, Weight: Up to 12,499 Pounds), Engine: Turbo-prop N-Number: 426LM, N426LM, N-426LM, Serial Number: 576, Certificate Issue Date: 04/28/2011 Registrant (Corporation): B & L Leasing, 4570 Lahm Dr, New Franklin, OH 44319
Home Mortgage Disclosure Act Aggregated Statistics For Year 2009 (Based on 2 partial tracts)
A) FHA, FSA/RHS & VA Home Purchase Loans
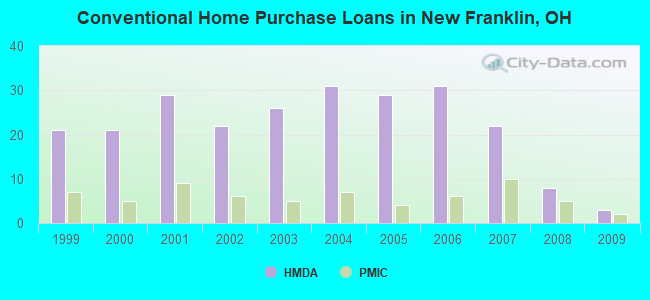
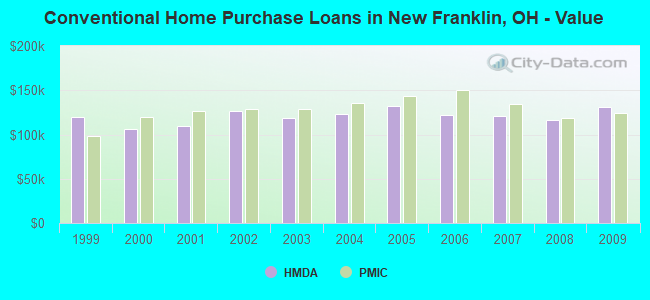
B) Conventional Home Purchase Loans
C) Refinancings
D) Home Improvement Loans
F) Non-occupant Loans on < 5 Family Dwellings (A B C & D)
Number
Average Value
Number
Average Value
Number
Average Value
Number
Average Value
Number
Average Value
LOANS ORIGINATED
9
$127,140
3
$130,693
34
$137,669
1
$103,160
1
$176,680
APPLICATIONS APPROVED, NOT ACCEPTED
0
$0
0
$0
4
$117,035
1
$5,870
0
$0
APPLICATIONS DENIED
1
$87,580
1
$80,900
12
$173,422
1
$39,730
1
$122,710
APPLICATIONS WITHDRAWN
1
$101,350
0
$0
5
$135,096
1
$37,890
0
$0
FILES CLOSED FOR INCOMPLETENESS
0
$0
0
$0
1
$158,310
0
$0
0
$0
Aggregated Statistics For Year 2008 (Based on 2 partial tracts)
A) FHA, FSA/RHS & VA Home Purchase Loans
B) Conventional Home Purchase Loans
C) Refinancings
D) Home Improvement Loans
F) Non-occupant Loans on < 5 Family Dwellings (A B C & D)
Number
Average Value
Number
Average Value
Number
Average Value
Number
Average Value
Number
Average Value
LOANS ORIGINATED
6
$121,395
8
$115,885
23
$125,289
2
$43,030
3
$98,000
APPLICATIONS APPROVED, NOT ACCEPTED
0
$0
1
$201,860
2
$157,190
0
$0
0
$0
APPLICATIONS DENIED
1
$125,000
2
$189,815
18
$147,046
3
$81,037
1
$334,160
APPLICATIONS WITHDRAWN
1
$97,560
0
$0
5
$138,468
1
$34,220
0
$0
FILES CLOSED FOR INCOMPLETENESS
0
$0
0
$0
2
$100,535
0
$0
0
$0
Aggregated Statistics For Year 2007 (Based on 2 partial tracts)
A) FHA, FSA/RHS & VA Home Purchase Loans
B) Conventional Home Purchase Loans
C) Refinancings
D) Home Improvement Loans
F) Non-occupant Loans on < 5 Family Dwellings (A B C & D)
Number
Average Value
Number
Average Value
Number
Average Value
Number
Average Value
Number
Average Value
LOANS ORIGINATED
2
$144,700
22
$121,104
29
$129,817
4
$68,685
3
$134,513
APPLICATIONS APPROVED, NOT ACCEPTED
0
$0
2
$66,965
6
$151,870
2
$56,245
0
$0
APPLICATIONS DENIED
0
$0
2
$162,905
24
$125,982
3
$82,377
1
$131,010
APPLICATIONS WITHDRAWN
0
$0
1
$195,210
11
$138,126
1
$15,480
0
$0
FILES CLOSED FOR INCOMPLETENESS
0
$0
0
$0
4
$174,375
0
$0
0
$0
Aggregated Statistics For Year 2006 (Based on 2 partial tracts)
A) FHA, FSA/RHS & VA Home Purchase Loans
B) Conventional Home Purchase Loans
C) Refinancings
D) Home Improvement Loans
F) Non-occupant Loans on < 5 Family Dwellings (A B C & D)
Number
Average Value
Number
Average Value
Number
Average Value
Number
Average Value
Number
Average Value
LOANS ORIGINATED
4
$113,910
31
$121,697
41
$113,007
7
$41,216
4
$76,950
APPLICATIONS APPROVED, NOT ACCEPTED
0
$0
3
$110,337
7
$112,651
1
$59,960
1
$110,400
APPLICATIONS DENIED
0
$0
3
$84,270
28
$128,467
4
$51,308
1
$49,390
APPLICATIONS WITHDRAWN
1
$130,310
3
$115,913
14
$146,211
3
$67,463
1
$27,160
FILES CLOSED FOR INCOMPLETENESS
0
$0
1
$36,590
4
$140,988
0
$0
0
$0
Aggregated Statistics For Year 2005 (Based on 2 partial tracts)
A) FHA, FSA/RHS & VA Home Purchase Loans
B) Conventional Home Purchase Loans
C) Refinancings
D) Home Improvement Loans
F) Non-occupant Loans on < 5 Family Dwellings (A B C & D)
G) Loans On Manufactured Home Dwelling (A B C & D)
Number
Average Value
Number
Average Value
Number
Average Value
Number
Average Value
Number
Average Value
Number
Average Value
LOANS ORIGINATED
4
$110,152
29
$132,587
57
$115,753
8
$74,146
5
$106,006
0
$0
APPLICATIONS APPROVED, NOT ACCEPTED
0
$0
2
$99,125
14
$119,421
1
$11,660
1
$96,140
0
$0
APPLICATIONS DENIED
0
$0
6
$190,660
38
$125,169
7
$42,714
1
$108,570
0
$0
APPLICATIONS WITHDRAWN
0
$0
1
$402,360
25
$132,531
2
$133,565
1
$124,110
1
$45,980
FILES CLOSED FOR INCOMPLETENESS
0
$0
2
$91,025
6
$117,203
0
$0
0
$0
0
$0
Aggregated Statistics For Year 2004 (Based on 2 partial tracts)
A) FHA, FSA/RHS & VA Home Purchase Loans
B) Conventional Home Purchase Loans
C) Refinancings
D) Home Improvement Loans
F) Non-occupant Loans on < 5 Family Dwellings (A B C & D)
G) Loans On Manufactured Home Dwelling (A B C & D)
Number
Average Value
Number
Average Value
Number
Average Value
Number
Average Value
Number
Average Value
Number
Average Value
LOANS ORIGINATED
3
$129,457
31
$123,080
57
$120,778
7
$44,199
6
$132,883
0
$0
APPLICATIONS APPROVED, NOT ACCEPTED
0
$0
3
$111,950
12
$120,497
1
$37,450
1
$40,020
0
$0
APPLICATIONS DENIED
1
$73,020
6
$113,538
32
$134,419
4
$34,415
3
$123,267
1
$13,360
APPLICATIONS WITHDRAWN
1
$160,010
2
$134,225
27
$119,696
3
$74,757
0
$0
0
$0
FILES CLOSED FOR INCOMPLETENESS
0
$0
0
$0
7
$126,153
1
$15,700
0
$0
0
$0
Aggregated Statistics For Year 2003 (Based on 2 partial tracts)
A) FHA, FSA/RHS & VA Home Purchase Loans
B) Conventional Home Purchase Loans
C) Refinancings
D) Home Improvement Loans
F) Non-occupant Loans on < 5 Family Dwellings (A B C & D)
Number
Average Value
Number
Average Value
Number
Average Value
Number
Average Value
Number
Average Value
LOANS ORIGINATED
4
$146,910
26
$118,497
109
$114,901
4
$42,030
5
$75,636
APPLICATIONS APPROVED, NOT ACCEPTED
0
$0
1
$166,750
14
$115,784
0
$0
1
$107,440
APPLICATIONS DENIED
1
$89,940
5
$113,408
33
$104,402
5
$43,800
1
$97,730
APPLICATIONS WITHDRAWN
0
$0
2
$153,045
26
$137,115
0
$0
1
$80,360
FILES CLOSED FOR INCOMPLETENESS
0
$0
1
$169,940
4
$146,660
0
$0
0
$0
Aggregated Statistics For Year 2002 (Based on 2 partial tracts)
A) FHA, FSA/RHS & VA Home Purchase Loans
B) Conventional Home Purchase Loans
C) Refinancings
D) Home Improvement Loans
F) Non-occupant Loans on < 5 Family Dwellings (A B C & D)
Number
Average Value
Number
Average Value
Number
Average Value
Number
Average Value
Number
Average Value
LOANS ORIGINATED
3
$110,280
22
$126,517
97
$108,314
3
$9,180
3
$83,033
APPLICATIONS APPROVED, NOT ACCEPTED
0
$0
1
$72,930
18
$105,071
2
$12,370
1
$55,900
APPLICATIONS DENIED
0
$0
2
$121,345
29
$101,308
6
$11,187
2
$55,310
APPLICATIONS WITHDRAWN
0
$0
1
$184,510
21
$129,431
1
$5,860
0
$0
FILES CLOSED FOR INCOMPLETENESS
0
$0
0
$0
3
$133,773
0
$0
0
$0
Aggregated Statistics For Year 2001 (Based on 2 partial tracts)
A) FHA, FSA/RHS & VA Home Purchase Loans
B) Conventional Home Purchase Loans
C) Refinancings
D) Home Improvement Loans
F) Non-occupant Loans on < 5 Family Dwellings (A B C & D)
Number
Average Value
Number
Average Value
Number
Average Value
Number
Average Value
Number
Average Value
LOANS ORIGINATED
6
$108,955
29
$109,933
71
$110,169
6
$40,960
4
$79,918
APPLICATIONS APPROVED, NOT ACCEPTED
1
$76,980
1
$104,580
14
$94,724
1
$36,400
0
$0
APPLICATIONS DENIED
1
$55,010
3
$105,463
26
$126,457
4
$15,972
0
$0
APPLICATIONS WITHDRAWN
0
$0
3
$96,107
15
$113,512
1
$9,760
1
$31,550
FILES CLOSED FOR INCOMPLETENESS
0
$0
0
$0
5
$114,538
0
$0
0
$0
Aggregated Statistics For Year 2000 (Based on 2 partial tracts)
A) FHA, FSA/RHS & VA Home Purchase Loans
B) Conventional Home Purchase Loans
C) Refinancings
D) Home Improvement Loans
F) Non-occupant Loans on < 5 Family Dwellings (A B C & D)
Number
Average Value
Number
Average Value
Number
Average Value
Number
Average Value
Number
Average Value
LOANS ORIGINATED
5
$103,534
21
$106,277
24
$94,966
6
$17,702
3
$78,033
APPLICATIONS APPROVED, NOT ACCEPTED
0
$0
1
$58,150
7
$92,593
1
$7,890
0
$0
APPLICATIONS DENIED
1
$34,740
4
$48,972
15
$90,885
2
$23,890
1
$53,500
APPLICATIONS WITHDRAWN
0
$0
3
$163,553
9
$88,088
1
$25,360
1
$31,310
FILES CLOSED FOR INCOMPLETENESS
0
$0
0
$0
4
$96,078
0
$0
0
$0
Aggregated Statistics For Year 1999 (Based on 2 partial tracts)
A) FHA, FSA/RHS & VA Home Purchase Loans
B) Conventional Home Purchase Loans
C) Refinancings
D) Home Improvement Loans
F) Non-occupant Loans on < 5 Family Dwellings (A B C & D)


 Recent articles from our blog. Our writers, many of them Ph.D. graduates or candidates, create easy-to-read articles on a wide variety of topics.

 (8.5 miles