Anaheim, California and Garden Grove, California are two bustling cities in Orange County. While they are close in proximity, they offer unique living experiences with distinct differences in terms of crime and safety, cost of living, education, and other key factors. Choosing between the two largely depends on individual lifestyle preferences, budget, and expectations. However, both cities boast mild weather, diverse food cultures, and some of the most famous attractions in the world.
Distance between
Anaheim, CA and
Garden Grove, CA : 5.7 miles
Anaheim's population is larger by 103%. Its population has grown by 17,926 people (5.5%) since 2000. The population of Garden Grove has grown by 5,292 people (3.2%) during that time.
In terms of safety, both Anaheim and Garden Grove share common challenges due to their urban nature. However, according to NeighborhoodScout, the crime rate in Anaheim is noticeably higher than the national average, while Garden Grove's is closer to average. While neither city is immune to crime, Garden Grove, on the whole, tends to present a slightly safer living environment than Anaheim.
City-data.com crime index counts serious crimes and violent crime more heavily. It adjusts for the number of visitors and daily workers commuting into cities. (higher means more crime, U.S. average = 301.1)
City-data.com crime index counts serious crimes and violent crime more heavily. It adjusts for the number of visitors and daily workers commuting into cities. (higher means more crime, U.S. average = 301.1)
Sex Offenders
According to our data, there are 366 registered sex offenders living in Anaheim and 130 registered sex offenders living in . The ratio of residents to sex offenders in Anaheim is 959 to 1; the ratio in Garden Grove is 1,345 to 1. The number of registered sex offenders compared to the number of residents is larger in Anaheim than in Garden Grove.
Cost of Living
The cost of living in Anaheim is generally higher than in Garden Grove, primarily due to higher housing costs. Other costs such as groceries, utilities, transportation, and health care are relatively similar in both cities. For those considering relocation, it is important to note that although Anaheim's median household income is higher, residents may feel the financial pinch from the elevated housing cost.
Income Tax
Both cities follow the state's progressive income tax system. California, however, has one of the highest state income tax rates in the country. The tax implications should be considered when contemplating relocation to either city.
Property Tax
Property tax rates are relatively similar in both cities, adhering to the state's standard rate. However, given the more expensive real estate market in Anaheim, homeowners may end up paying more in property taxes compared to those in Garden Grove.
Sales Tax
Anaheim and Garden Grove have identical city sales tax rates as they follow the standard California state sales tax rate. This is relatively high compared to other US states, which may slightly affect cost of living.
Income
Type
Anaheim
Garden Grove
Estimated median household income
$81,747
$74,109
Estimated per capita income
$32,827
$28,109
Cost of living index (U.S. average is 100)
88.5
89.5
If you make $50,000 in Anaheim, you will have to make $50,565 in Garden Grove to maintain the same standard of living.
Geographical Conditions
Anaheim offers more varied geographical features, with coastal plains in the west and foothills of the Santa Ana Mountains to the east. Garden Grove is mostly flat, with the closest significant geographical feature being the Pacific coastline about ten miles to the west.
Both Anaheim and Garden Grove offer several public, private, and charter school options for families with children. With the presence of the California State University, Fullerton nearby, Anaheim may offer a few more options for higher education. However, Garden Grove's school system is noted for having slightly better ratings overall.
Anaheim's economy is primarily driven by tourism, with the Walt Disney Company being the city’s largest employer. Garden Grove, conversely, has a more diverse set of industries including health care, education, and government services. Anaheim tends to have higher wages, but also higher competition for jobs, especially in the tourism industry.
Biggest Employers
In Anaheim, the Walt Disney Company is the city's largest employer, providing a range of job opportunities. Other big employers include Anaheim Regional Medical Center and Hilton Hotels. Garden Grove's largest employers include Garden Grove Hospital Medical Center and Air Industries Corp.
There were 85 building permits issued in Anaheim in 2012 (44 more than in 2011) compared to 274 building permits issued in Garden Grove in 2012 (243 more than in 2011).
Weather
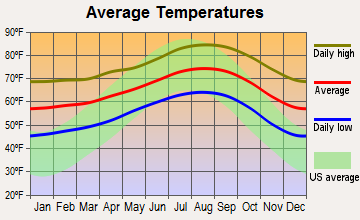
Located in Southern California, both Anaheim and Garden Grove delight in a Mediterranean-style climate characterized by sunny, dry summers, and mild, wet winters. The main difference is Anaheim's proximity to the coast which may result in slightly cooler winds compared to Garden Grove. However, the weather differences between the two cities are generally negligible and residents as well as tourists can enjoy outdoor activities year-round.
Weather and climate
Type
Anaheim
Garden Grove
Temperature - Average
64.9°F
65.3°F
Humidity - Average morning or afternoon humidity
69.6%
70.2%
Humidity - Differences between morning and afternoon humidity
25.9%
26.7%
Humidity - Maximum monthly morning or afternoon humidity
77.9%
78.7%
Humidity - Minimum monthly morning or afternoon humidity
52%
52%
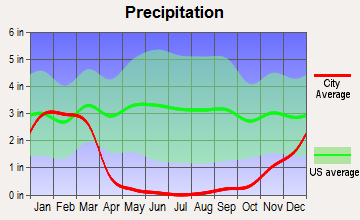
Precipitation - Yearly average
12 in
13 in
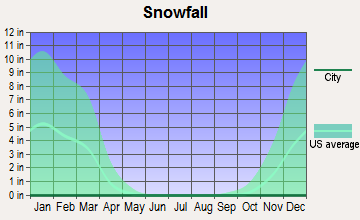
Snowfall - Yearly average
0 in
0 in
Clouds - Number of days clear of clouds
26.6%
26.5%
Sunshine amount - Average
78.4%
78.4%
Sunshine amount - Differences during a year
22%
22%
Sunshine amount - Maximum monthly
84.9%
84.9%
Sunshine amount - Minimum monthly
63%
63%
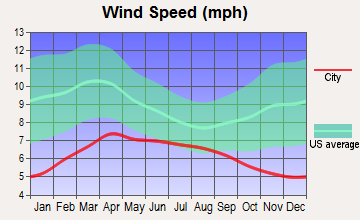
Wind speed - Average
5.7 mph
6 mph
Average climate in Anaheim, California
Average climate in Garden Grove, California
Air pollution
Type
AQI
CO
NO2
OZONE
PB
PM10
PM25
SO2
Year
Anaheim
Garden Grove
Anaheim
Garden Grove
Anaheim
Garden Grove
Anaheim
Garden Grove
Anaheim
Garden Grove
Anaheim
Garden Grove
Anaheim
Garden Grove
Anaheim
Garden Grove
2018
139
132
0.36
0.36
13.7
14.0
26.8
26.6
0.007
0.007
27.5
27.5
12.1
12.2
0.7
0.7
2017
145
139
0.50
0.43
14.8
14.6
26.7
27.3
0.007
0.007
26.7
26.7
13.5
13.5
0.6
0.5
2016
132
113
0.57
0.47
14.5
14.2
26.3
27.1
0.007
0.007
24.1
24.1
12.9
12.8
0.3
0.3
2015
142
128
0.45
0.40
14.7
14.6
26.0
27.2
0.007
0.007
25.0
25.0
14.8
14.7
0.3
0.3
2014
138
127
0.40
0.36
15.0
14.8
26.7
27.0
0.008
0.008
26.7
26.7
16.2
16.1
0.5
0.5
2013
138
123
0.47
0.42
14.8
15.3
25.3
26.0
0.005
0.005
28.3
28.6
13.9
13.9
0.5
0.4
2012
142
116
0.46
0.41
14.5
14.6
25.0
25.4
0.005
0.004
27.0
27.3
14.7
14.6
0.2
0.2
2011
138
119
0.42
0.39
15.9
16.2
26.7
26.3
0.007
0.006
27.4
27.5
16.0
15.9
0.8
0.7
2010
130
108
0.44
0.41
16.7
16.5
25.8
25.5
0.009
0.010
23.5
23.5
14.9
14.7
0.6
0.6
2009
151
135
0.41
0.40
18.0
17.9
26.0
26.2
0.010
0.010
24.4
24.4
15.4
15.1
1.1
1.1
2008
156
143
0.38
0.41
20.3
19.7
26.7
26.6
0.010
0.010
30.2
30.3
18.9
21.6
1.1
1.1
2007
135
125
0.38
0.40
19.5
19.2
26.2
26.0
0.012
0.012
N/A
N/A
N/A
N/A
0.8
0.8
2006
128
122
0.43
0.45
19.1
19.5
26.3
26.0
0.008
0.007
N/A
N/A
N/A
N/A
1.3
1.3
2005
128
121
0.45
0.46
20.7
20.7
31.3
28.6
0.013
0.013
N/A
N/A
N/A
N/A
1.3
1.3
2004
134
129
0.53
0.54
19.9
20.9
37.1
32.8
0.015
0.014
N/A
N/A
N/A
N/A
1.6
1.6
2003
143
139
0.69
0.69
23.7
24.2
23.8
24.7
0.025
0.029
N/A
N/A
N/A
N/A
1.1
1.1
2002
134
124
0.77
0.75
24.1
24.5
21.8
22.6
0.019
0.019
N/A
N/A
N/A
N/A
2.1
1.9
2001
143
134
0.94
0.87
28.4
26.2
24.5
23.3
0.035
0.033
N/A
N/A
N/A
N/A
1.7
1.6
2000
152
140
0.80
0.82
29.4
28.8
23.0
22.5
0.030
0.027
N/A
N/A
N/A
N/A
1.9
1.9
Natural disasters
Type
Anaheim
Garden Grove
Tornado activity compared to U.S. average
19.3%
19.1%
Earthquake activity compared to U.S. average
7,039.7%
6,940.9%
Natural disasters compared to U.S. average
32%
32%
Transportation
Both Anaheim and Garden Grove have well-structured public transit systems, but Anaheim offers more extensive public transport options due to its tourism industry. Commute times are largely dependent on specific locations and traffic conditions, but both cities have access to major highways making commuting relatively convenient.
Transport
Type
Anaheim
Garden Grove
Amtrak stations
1
0
Amtrak stations nearby
3
3
FAA registered aircraft
136
28
FAA registered aircraft manufacturers and dealers
3
1
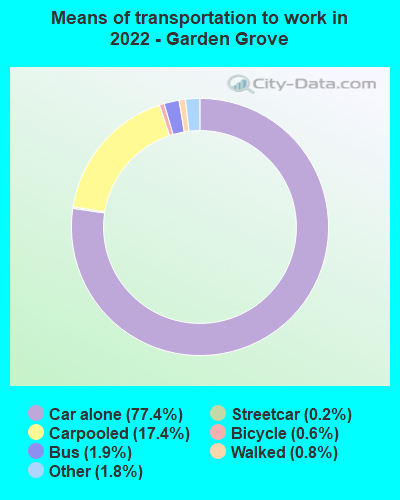
Means of transportation to work
Type
Anaheim
Garden Grove
Bicycle
1%
0.4%
Bus
0.9%
1.6%
Carpooled
10.8%
12.7%
Car alone
83.4%
81.9%
Motorcycle
0.2%
0.2%
Railroad
0.2%
0.1%
Subway
0.3%
0%
Walked
1.6%
1.7%
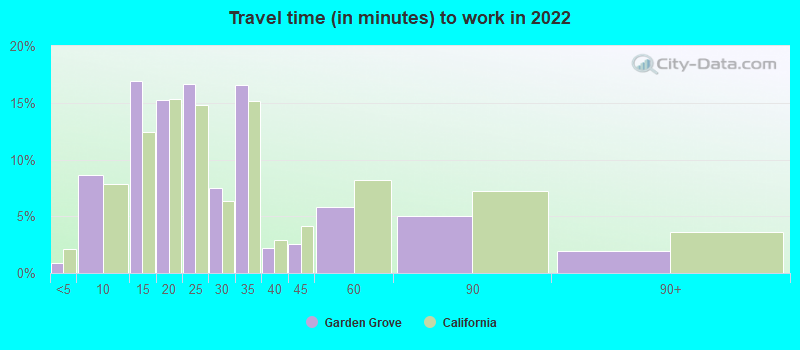
Average travel time to work
Type
Anaheim
Garden Grove
Average
30.8 min
28.5 min
Other means
28.1 min
27.8 min
Public transportation
47.8 min
50.2 min
Private vehicle occupancy
Type
Anaheim
Garden Grove
Average
1.2
1.2
Drove alone
85.3%
86%
In 2 person carpool
11.2%
10.3%
In 3 person carpool
1.8%
2.2%
In 4 person carpool
0.8%
0.3%
In 5-6 person carpool
0.9%
0.9%
In 7+ person carpool
0%
0.3%
How many people usually rode to work in the car, truck or van.
Real Estate
Real estate in Anaheim is pricier than in Garden Grove, with the median home value in Anaheim significantly higher. While Garden Grove also has a competitive housing market, there are generally more affordable homes to find. For renters, Anaheim's rental rates also tend to be higher.
Neighborhoods
Anaheim is home to some high-end neighborhoods such as Anaheim Hills, and also eclectic neighborhoods like the Colony District. Garden Grove has quiet, family-friendly neighborhoods like West Garden Grove. Both cities offer a variety of neighborhoods to suit varying lifestyle preferences.
Houses and residents
Type
Anaheim
Garden Grove
Houses
110,319
50,253
Average household size (people)
3.4
3.7
Median year apartment built
1975
1970
Median year house/condo built
1970
1961
Length of stay in the house since moving in
14.8 years
16.5 years
Houses occupied
105,608 (95.7%)
48,769 (97%)
Houses occupied by owners
51,684 (48.9%)
26,624 (54.6%)
Houses occupied by renters
53,924 (51.1%)
22,145 (45.4%)
Median rent asked for vacant for-rent units
$2,111
$2,029
Median monthly housing costs
$1,910
$1,702
Median price asked for vacant for-sale houses and condos
$1,256,069
$496,512
Estimated median house or condo value
$688,400
$663,900
Median numbers of rooms
4.7
5
Median number of rooms in apartments
3.6
4.1
Median number of rooms in houses and condos
6.1
5.7
Median house price - detached houses
$859,592
$693,972
Median house price - in 2-unit structures
$742,035
Over $1,000,000
Median house price - in 3-to-4-unit structures
$546,946
$495,714
Median house price - in 5 or more unit structures
$553,561
$533,738
Median house price - mobile homes
$114,904
$58,441
Median house price - Townhouses or other attached units
$619,623
$481,658
Median house price - All housing units
$782,600
$651,210
Median house age
48
56
Renting percentage
51.5%
43%
Housing density (houses/condos per square mile)
2,254.1
2,788.1
House value disparities
20.2%
16.7%
Household income disparities
43.6%
44.4%
Median household income for houses/condes with a mortgage
$125,169
$108,920
Median household income for apartments without a mortgage
$86,779
$76,436
Housing units without a mortgage
374 (1%)
830 (4.9%)
Housing units with both a second mortgage and home equity loan
2,222 (6%)
699 (4.1%)
Housing units with a mortgage
36,875 (99%)
16,271 (95.1%)
Housing units with a home equity loan
0 (0%)
0 (0%)
Housing units with a second mortgage
2,794 (7.5%)
1,046 (6.1%)
House/condo owner moved in on average (years ago)
14
18
House/condo renter moved in on average (years ago)
4
4
Housing units lacking complete kitchen facilities
4.5%
3.5%
Housing units lacking complete plumbing facilities
0.1%
0.6%
Housing units in structures
Housing units in structures
Anaheim
Garden Grove
One, detached
42.7%
55.0%
One, attached
8.3%
8.9%
Two
2.3%
2.3%
3 or 4
7.6%
5.2%
5 to 9
6.8%
6.7%
10 to 19
5.5%
4.2%
20 to 49
6.8%
5.0%
50 or more
17.2%
9.6%
Mobile homes
2.6%
3.0%
Boats, RVs, vans, etc.
0.1%
0.1%
Median real estate property taxes paid for housing units
Self-employed workers in own not incorporated business
11,077
6,209
State government workers
5,046
2,416
Unpaid family workers
65
427
Industries and Occupations
Anaheim's economy is primarily dominated by tourism, leisure, and entertainment sectors. Garden Grove has a more balanced economic structure, with representation from health care, manufacturing, retail trade, and also tourism. The workforce in both cities is diversified, but those with experience in the hospitality industry may find more opportunities in Anaheim.
Health diagnosing and treating practitioners and other technical occupations
4.2%
3.7%
Building and grounds cleaning and maintenance occupations
4.2%
6.0%
Health technologists and technicians
3.6%
2.6%
Community and social service occupations
2.2%
1.1%
Material moving occupations
2.0%
2.9%
Computer and mathematical occupations
1.4%
1.3%
Life, physical, and social science occupations
1.3%
0.2%
Arts, design, entertainment, sports, and media occupations
1.3%
1.5%
Architecture and engineering occupations
0.9%
1.6%
Health Care
Both cities provide adequate healthcare facilities with several hospitals and clinics. Anaheim Regional Medical Center, one of the largest employers in Anaheim, is a major player in the city's healthcare scene. Garden Grove Hospital Medical Center is a comparable facility in Garden Grove.
Both cities have well-developed infrastructure systems. However, Anaheim, being larger and more developed, boasts more extensive public services including libraries, parks, and public transportation. Garden Grove, being smaller, may not have the same range of services, but it is often easier to navigate due to less congested roads and highways.
HMDA - Conventional home purchase loans - Applications denied
Year
Anaheim
Garden Grove
1999
914
444
2000
679
495
2001
632
453
2002
735
467
2003
1,047
639
2004
1,456
798
2005
1,965
965
2006
1,999
1,266
2007
1,230
678
2008
599
335
2009
378
231
Culture and Food
Both cities offer a vibrant and diverse food culture. Anaheim boasts influences from the large Latino community while Garden Grove features a prominent Vietnamese influence, partly due to the large Vietnamese American population in the city. Both cities host various cultural events throughout the year, enhancing their respective cultural scenes.
Sports Teams
Anaheim is home to two professional sports teams: the Anaheim Ducks (NHL) and Los Angeles Angels (MLB), making it an exciting city for sports lovers. Garden Grove does not host any major professional sports teams, but residents can still enjoy a variety of community sports events and programs.


 Anaheim, CA
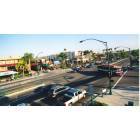
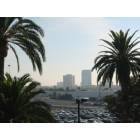
 Garden Grove, CA