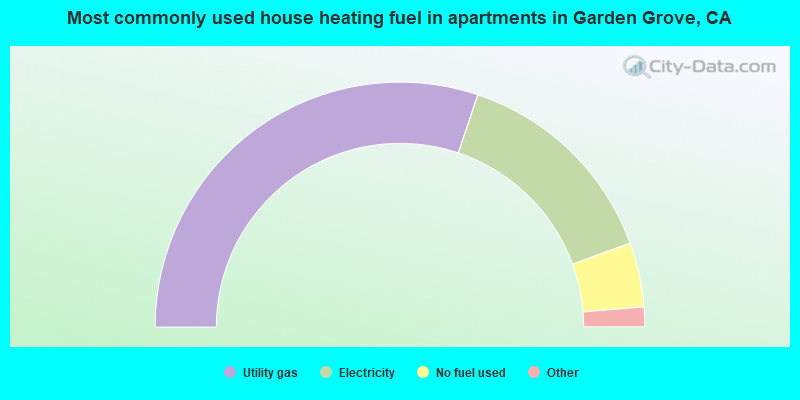
Garden Grove, California
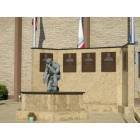
Garden Grove: Fallen Officer's Memorial in front of the Police Department HQ
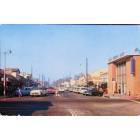
Garden Grove: 1950's Garden Grove Downtown
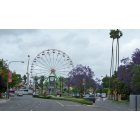
Garden Grove: getting ready fo the Fcpaestival
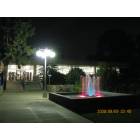
Garden Grove: Stanford Library Fountain area at NIGHT.
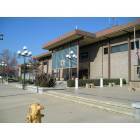
Garden Grove: Police Department HQ
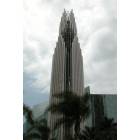
Garden Grove: Crystal Cathedral
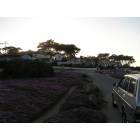
Garden Grove: Colors of Pacific Grove_1
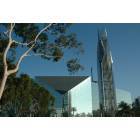
Garden Grove: Crystal Cathedral
- add
your
Submit your own pictures of this city and show them to the world
- OSM Map
- General Map
- Google Map
- MSN Map
Population change since 2000: +2.5%
 |
| Males: 86,541 | |
| Females: 82,713 |
| Median resident age: | 39.9 years |
| California median age: | 37.9 years |
Zip codes: 92683, 92703, 92706, 92840, 92841, 92843, 92844, 92845.
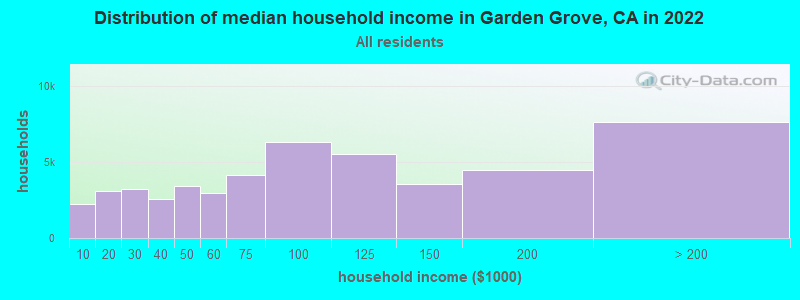
Garden Grove Zip Code Map| Garden Grove: | $86,975 |
| CA: | $91,551 |
Estimated per capita income in 2022: $33,634 (it was $16,209 in 2000)
Garden Grove city income, earnings, and wages data
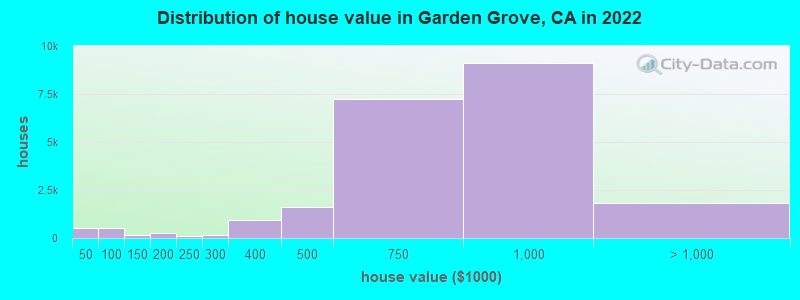
Estimated median house or condo value in 2022: $811,500 (it was $194,500 in 2000)
| Garden Grove: | $811,500 |
| CA: | $715,900 |
Mean prices in 2022: all housing units: $767,239; detached houses: $835,074; townhouses or other attached units: $604,136; in 3-to-4-unit structures: $635,906; in 5-or-more-unit structures: $506,155; mobile homes: $131,518
Median gross rent in 2022: $1,961.
(10.7% for White Non-Hispanic residents, 13.7% for Black residents, 11.7% for Hispanic or Latino residents, 0.7% for American Indian residents, 6.7% for Native Hawaiian and other Pacific Islander residents, 15.8% for other race residents, 10.5% for two or more races residents)
Detailed information about poverty and poor residents in Garden Grove, CA


Compare current foreclosures in Garden Grove, CA:
| Photo | Address | Area | Beds / Baths | Price | Details |
|---|---|---|---|---|---|

|
#1
Firebrand St
Garden Grove, CA 92840
|
1,210 sq. feet
|
1 baths 3 beds |
show details | |

|
#2
Mac Duff St
Garden Grove, CA 92841
|
1,197 sq. feet
|
2 baths 4 beds |
show details | |

|
#3
Kathy Ln
Garden Grove, CA 92840
|
1,317 sq. feet
|
2 baths 4 beds |
show details | |

|
#4
Clarissa St
Garden Grove, CA 92840
|
1,098 sq. feet
|
2 baths 3 beds |
show details | |

|
#5
Devonwood Ave
Garden Grove, CA 92841
|
1,238 sq. feet
|
2 baths 3 beds |
show details | |

|
#6
Paloma Ave
Garden Grove, CA 92843
|
1,234 sq. feet
|
1 baths 3 beds |
show details | |

|
#7
George Reyburn Rd
Garden Grove, CA 92845
|
1,547 sq. feet
|
3 baths 3 beds |
show details | |

|
#8
Firebrand St
Garden Grove, CA 92840
|
1,207 sq. feet
|
1 baths 3 beds |
show details | |

|
#9
Flanner Ave
Garden Grove, CA 92840
|
1,203 sq. feet
|
2 baths 4 beds |
show details | |

|
#10
Jennrich Ave
Garden Grove, CA 92843
|
1,338 sq. feet
|
2 baths 3 beds |
show details |
| Photo | Address | Area | Beds / Baths | Price | Details |
|---|---|---|---|---|---|

|
#11
Spring Water 38
Garden Grove, CA 92843
|
602 sq. feet
|
1 baths 1 beds |
show details | |

|
#12
Santa Barbara Ave
Garden Grove, CA 92845
|
1,213 sq. feet
|
2 baths 3 beds |
show details | |

|
#13
Robert Ln
Garden Grove, CA 92840
|
1,242 sq. feet
|
2 baths 4 beds |
show details | |

|
#14
Crissey Way
Garden Grove, CA 92840
|
1,494 sq. feet
|
2 baths 3 beds |
show details | |

|
#15
Newhope St
Garden Grove, CA 92843
|
1,160 sq. feet
|
2 baths 3 beds |
show details | |

|
#16
Mac Gill St
Garden Grove, CA 92841
|
1,022 sq. feet
|
1 baths 3 beds |
show details | |

|
#17
Galway St
Garden Grove, CA 92844
|
1,639 sq. feet
|
2 baths 2 beds |
show details | |

|
#18
Parliament Ave
Garden Grove, CA 92840
|
1,224 sq. feet
|
2 baths 4 beds |
show details | |

|
#19
Fredrick Dr
Garden Grove, CA 92840
|
1,853 sq. feet
|
2 baths 4 beds |
show details | |

|
#20
Gunther St
Garden Grove, CA 92843
|
1,066 sq. feet
|
1 baths 3 beds |
show details |
| Photo | Address | Area | Beds / Baths | Price | Details |
|---|---|---|---|---|---|

|
#21
Jennrich Ave
Garden Grove, CA 92843
|
1,338 sq. feet
|
2 baths 3 beds |
show details | |

|
#22
Traylor Way
Garden Grove, CA 92843
|
1,145 sq. feet
|
2 baths 4 beds |
show details | |

|
#23
Benton St
Garden Grove, CA 92843
|
1,011 sq. feet
|
1 baths 3 beds |
show details | |

|
#24
9th St
Garden Grove, CA 92840
|
1,345 sq. feet
|
2 baths 3 beds |
show details | |

|
#25
Jerome Ln
Garden Grove, CA 92841
|
1,156 sq. feet
|
2 baths 3 beds |
show details | |

|
#26
College Ave
Garden Grove, CA 92841
|
1,203 sq. feet
|
1 baths 3 beds |
show details | |

|
#27
Reading Ave
Garden Grove, CA 92844
|
1,426 sq. feet
|
2 baths 3 beds |
show details | |

|
#28
Cerulean Dr
Garden Grove, CA 92841
|
1,276 sq. feet
|
2 baths 4 beds |
show details | |

|
#29
Spring Water Ct
Garden Grove, CA 92843
|
602 sq. feet
|
1 baths 1 beds |
show details | |

|
#30
Sussex Cir
Garden Grove, CA 92840
|
1,010 sq. feet
|
1 baths 2 beds |
show details |
| Photo | Address | Area | Beds / Baths | Price | Details |
|---|---|---|---|---|---|

|
#31
Gilbert St Apt 14
Garden Grove, CA 92844
|
984 sq. feet
|
2 baths 2 beds |
show details | |

|
#32
Lola Ln
Garden Grove, CA 92843
|
1,350 sq. feet
|
2 baths 3 beds |
show details | |

|
#33
Vons Dr
Garden Grove, CA 92841
|
1,291 sq. feet
|
2 baths 3 beds |
show details | |

|
#34
Palm St
Garden Grove, CA 92843
|
1,563 sq. feet
|
2 baths 3 beds |
show details | |

|
#35
Edgebrook Dr
Garden Grove, CA 92844
|
1,160 sq. feet
|
2 baths 3 beds |
show details | |

|
#36
Sabre Ave
Garden Grove, CA 92844
|
1,224 sq. feet
|
2 baths 4 beds |
show details | |

|
#37
Buckingham Cir
Garden Grove, CA 92840
|
1,452 sq. feet
|
3 baths 4 beds |
show details | |

|
#38
Madison Cir
Garden Grove, CA 92844
|
1,187 sq. feet
|
2 baths 4 beds |
show details | |

|
#39
Enloe Ave
Garden Grove, CA 92844
|
1,500 sq. feet
|
2 baths 3 beds |
show details | |

|
#40
Mays Ave
Garden Grove, CA 92844
|
1,460 sq. feet
|
2 baths 4 beds |
show details |
| Photo | Address | Area | Beds / Baths | Price | Details |
|---|---|---|---|---|---|

|
#41
Sylvan St
Garden Grove, CA 92845
|
1,973 sq. feet
|
3 baths 4 beds |
show details | |

|
#42
Hazard Ave
Garden Grove, CA 92843
|
1,291 sq. feet
|
2 baths 3 beds |
show details | |

|
#43
Fairchild St
Garden Grove, CA 92845
|
1,777 sq. feet
|
1 baths 4 beds |
show details | |

|
#44
Village Rd
Garden Grove, CA 92841
|
1,505 sq. feet
|
2 baths 3 beds |
show details | |

|
#45
Killarney Ave
Garden Grove, CA 92845
|
1,430 sq. feet
|
1 baths 4 beds |
show details | |

|
#46
Downing St
Garden Grove, CA 92840
|
1,579 sq. feet
|
1 baths 3 beds |
show details | |

|
#47
Tudor Ln
Garden Grove, CA 92841
|
1,709 sq. feet
|
2 baths 3 beds |
show details | |

|
#48
Marie Ln
Garden Grove, CA 92841
|
1,505 sq. feet
|
2 baths 3 beds |
show details | |

|
#49
Pickett Ave
Garden Grove, CA 92845
|
1,303 sq. feet
|
2 baths 3 beds |
show details | |

|
Check over 1 million property listings on Foreclosure.com!
|
browse all offers | |||


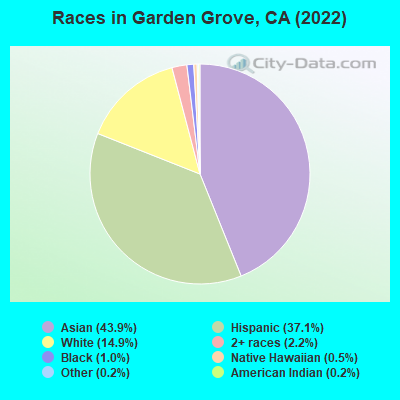
- 74,39143.9%Asian alone
- 62,87937.1%Hispanic
- 25,19214.9%White alone
- 3,6752.2%Two or more races
- 1,6661.0%Black alone
- 7810.5%Native Hawaiian and Other
Pacific Islander alone - 2680.2%American Indian alone
- 4130.2%Other race alone
According to our research of California and other state lists, there were 131 registered sex offenders living in Garden Grove, California as of April 27, 2024.
The ratio of all residents to sex offenders in Garden Grove is 1,335 to 1.
The ratio of registered sex offenders to all residents in this city is lower than the state average.
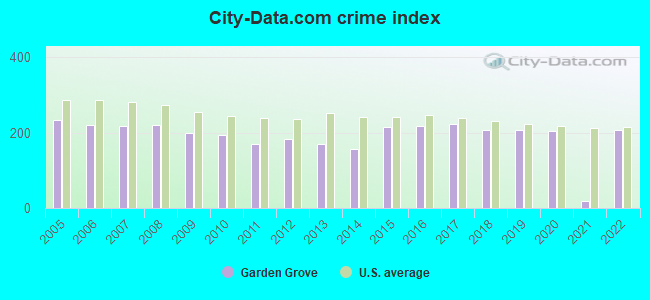
The City-Data.com crime index weighs serious crimes and violent crimes more heavily. Higher means more crime, U.S. average is 246.1. It adjusts for the number of visitors and daily workers commuting into cities.
- means the value is smaller than the state average.- means the value is about the same as the state average.
- means the value is bigger than the state average.
- means the value is much bigger than the state average.
Crime rate in Garden Grove detailed stats: murders, rapes, robberies, assaults, burglaries, thefts, arson
Full-time law enforcement employees in 2021, including police officers: 237 (172 officers - 163 male; 9 female).
| Officers per 1,000 residents here: | 1.00 |
| California average: | 2.30 |
 Recent articles from our blog. Our writers, many of them Ph.D. graduates or candidates, create easy-to-read articles on a wide variety of topics.

 | Orange County Homeless Thread (1064 replies) |
| Is West Garden Grove good for families with kids (1 reply) |
| Cypress and West Garden Grove CA (4 replies) |
| Where to buy Durian in Garden Grove? (6 replies) |
| Advice about OC towns (33 replies) |
| Garden Grove/Westminster - How do you rate them? (41 replies) |
Latest news from Garden Grove, CA collected exclusively by city-data.com from local newspapers, TV, and radio stations
Garden Grove, CA City Guides:
Ancestries: American (8.9%), German (1.7%), Irish (1.1%).
Current Local Time: PST time zone
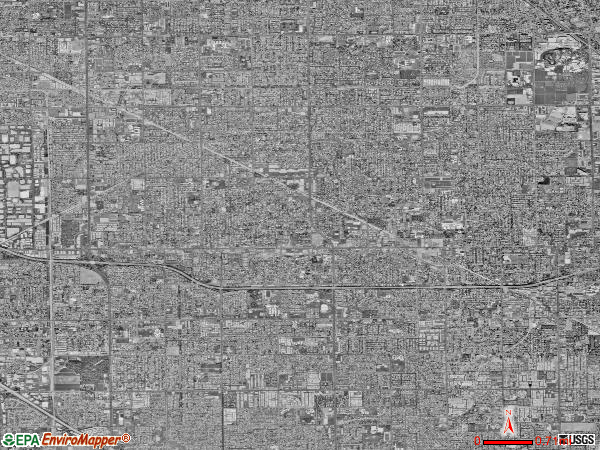
Elevation: 87 feet
Land area: 18.0 square miles.
Population density: 9,390 people per square mile (high).
76,693 residents are foreign born (29.3% Asia, 13.6% Latin America).
| This city: | 45.0% |
| California: | 26.5% |
Median real estate property taxes paid for housing units with mortgages in 2022: $5,280 (0.6%)
Median real estate property taxes paid for housing units with no mortgage in 2022: $4,138 (0.5%)
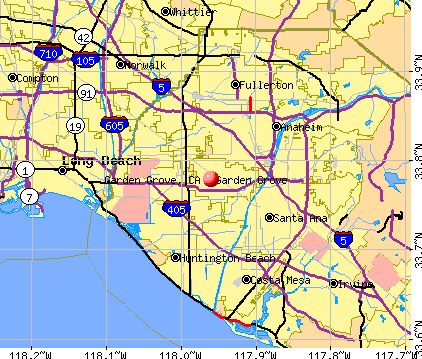
Nearest city with pop. 200,000+: North Coast, CA (5.1 miles  , pop. 363,603).
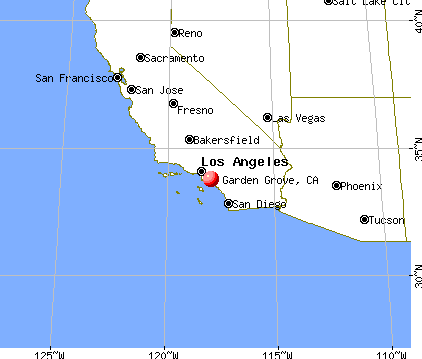
Nearest city with pop. 1,000,000+: Los Angeles, CA (32.0 miles , pop. 3,694,820).
Nearest cities:
), ), ), ), Latitude: 33.78 N, Longitude: 117.96 W
Daytime population change due to commuting: -34,770 (-20.5%)
Workers who live and work in this city: 18,933 (21.6%)
Area code: 714
Garden Grove, California accommodation & food services, waste management - Economy and Business Data
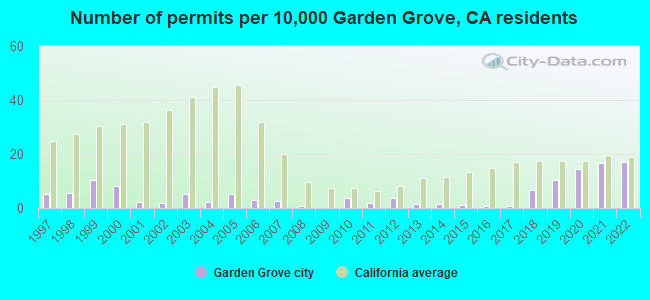
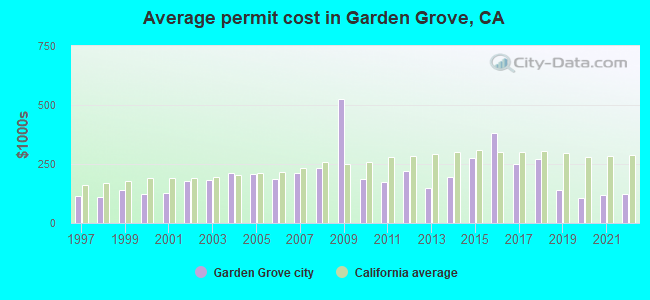
Single-family new house construction building permits:
- 2022: 283 buildings, average cost: $124,100
- 2021: 274 buildings, average cost: $118,800
- 2020: 237 buildings, average cost: $104,000
- 2019: 169 buildings, average cost: $139,100
- 2018: 111 buildings, average cost: $269,500
- 2017: 11 buildings, average cost: $251,800
- 2016: 14 buildings, average cost: $382,500
- 2015: 20 buildings, average cost: $276,600
- 2014: 22 buildings, average cost: $196,400
- 2013: 25 buildings, average cost: $148,600
- 2012: 64 buildings, average cost: $222,400
- 2011: 31 buildings, average cost: $175,100
- 2010: 62 buildings, average cost: $186,500
- 2009: 3 buildings, average cost: $526,300
- 2008: 13 buildings, average cost: $232,800
- 2007: 41 buildings, average cost: $213,000
- 2006: 46 buildings, average cost: $188,200
- 2005: 85 buildings, average cost: $208,600
- 2004: 34 buildings, average cost: $210,500
- 2003: 88 buildings, average cost: $180,500
- 2002: 30 buildings, average cost: $178,400
- 2001: 36 buildings, average cost: $128,500
- 2000: 133 buildings, average cost: $123,000
- 1999: 173 buildings, average cost: $138,500
- 1998: 91 buildings, average cost: $111,700
- 1997: 88 buildings, average cost: $116,000
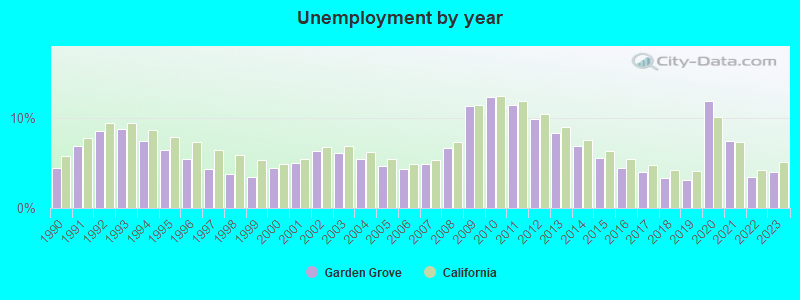
| Here: | 4.0% |
| California: | 5.1% |
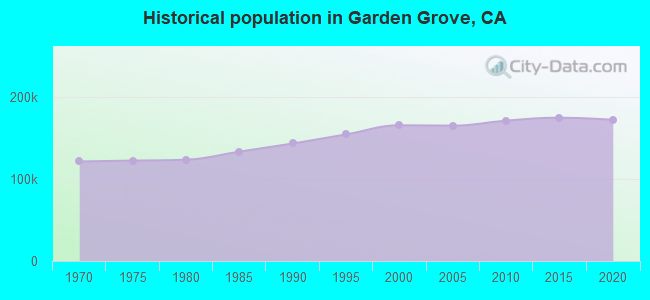
Population change in the 1990s: +21,124 (+14.7%).
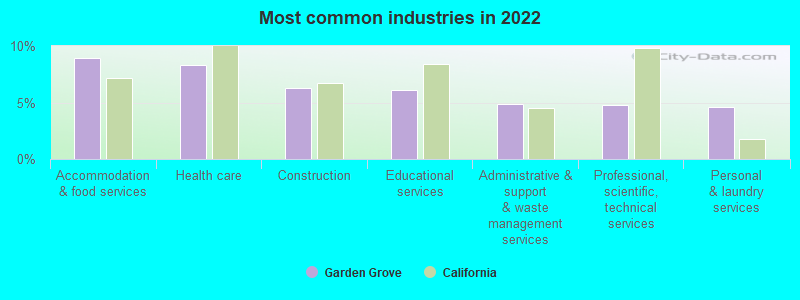
- Accommodation & food services (8.9%)
- Health care (8.3%)
- Construction (6.3%)
- Educational services (6.1%)
- Administrative & support & waste management services (4.8%)
- Professional, scientific, technical services (4.8%)
- Personal & laundry services (4.6%)
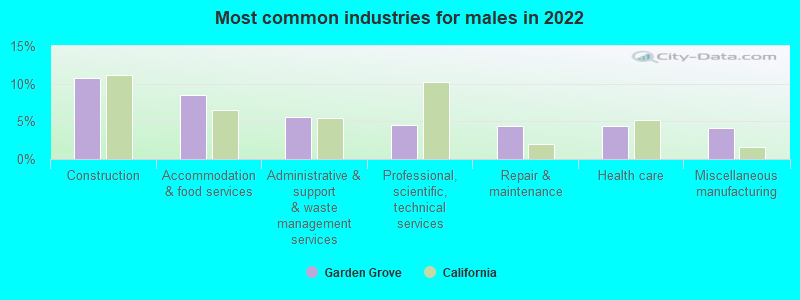
- Construction (10.8%)
- Accommodation & food services (8.5%)
- Administrative & support & waste management services (5.6%)
- Professional, scientific, technical services (4.5%)
- Repair & maintenance (4.4%)
- Health care (4.4%)
- Miscellaneous manufacturing (4.2%)
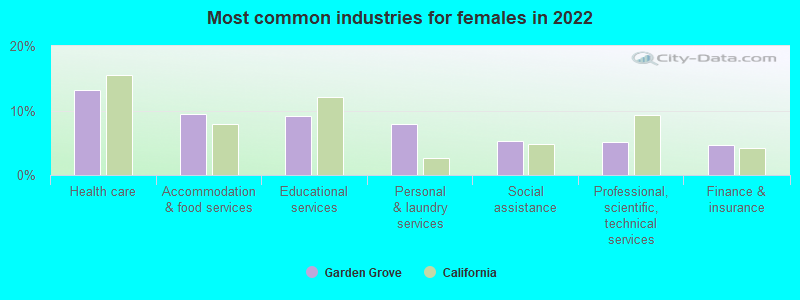
- Health care (13.2%)
- Accommodation & food services (9.5%)
- Educational services (9.1%)
- Personal & laundry services (8.0%)
- Social assistance (5.2%)
- Professional, scientific, technical services (5.2%)
- Finance & insurance (4.6%)
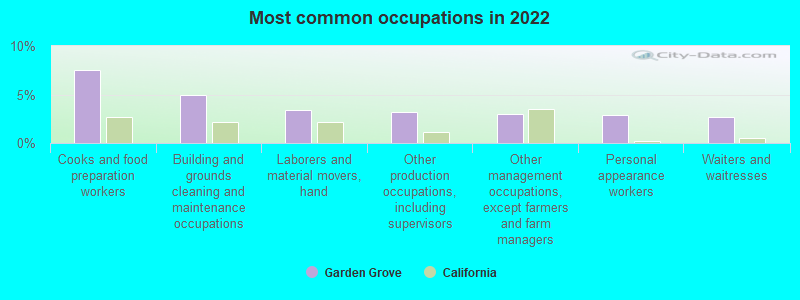
- Cooks and food preparation workers (7.6%)
- Building and grounds cleaning and maintenance occupations (5.0%)
- Laborers and material movers, hand (3.4%)
- Other production occupations, including supervisors (3.2%)
- Other management occupations, except farmers and farm managers (3.0%)
- Personal appearance workers (2.9%)
- Waiters and waitresses (2.7%)
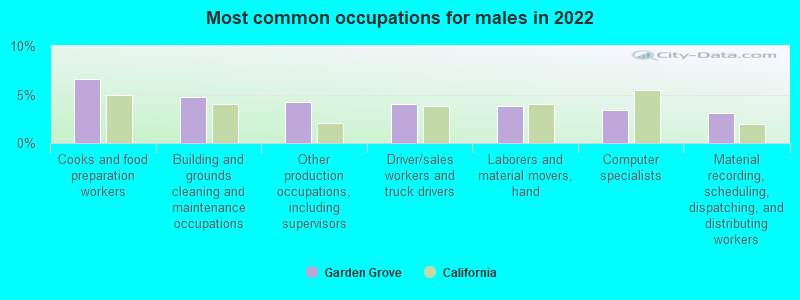
- Cooks and food preparation workers (6.6%)
- Building and grounds cleaning and maintenance occupations (4.8%)
- Other production occupations, including supervisors (4.2%)
- Driver/sales workers and truck drivers (4.0%)
- Laborers and material movers, hand (3.8%)
- Computer specialists (3.4%)
- Material recording, scheduling, dispatching, and distributing workers (3.1%)
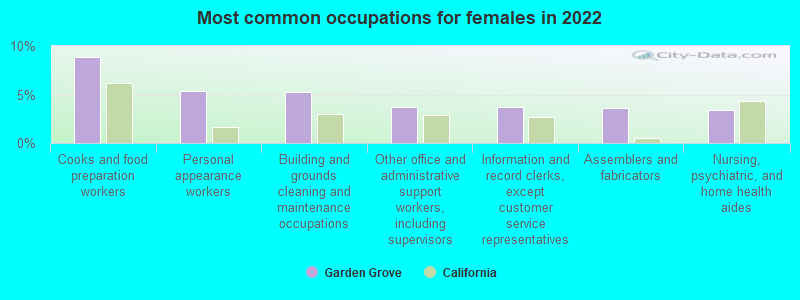
- Cooks and food preparation workers (8.8%)
- Personal appearance workers (5.4%)
- Building and grounds cleaning and maintenance occupations (5.2%)
- Other office and administrative support workers, including supervisors (3.7%)
- Information and record clerks, except customer service representatives (3.7%)
- Assemblers and fabricators (3.6%)
- Nursing, psychiatric, and home health aides (3.4%)
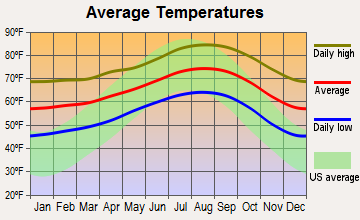
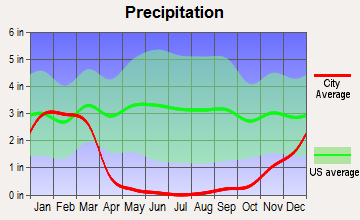
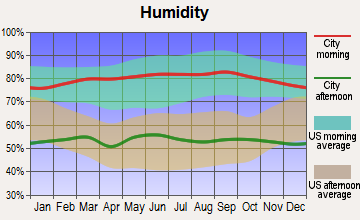
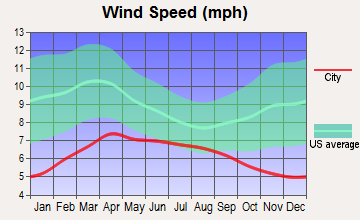
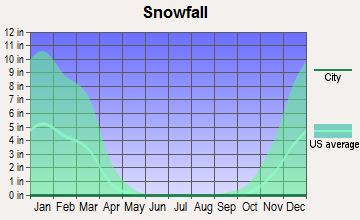
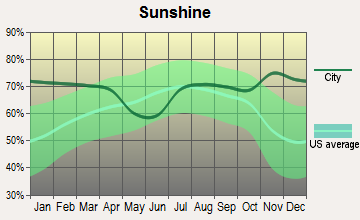
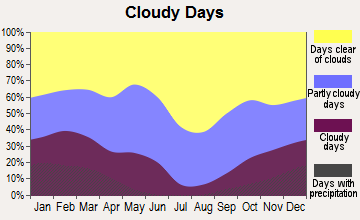
Average climate in Garden Grove, California
Based on data reported by over 4,000 weather stations
|
|


(lower is better)
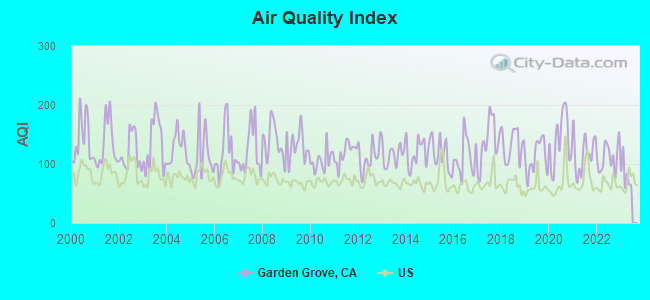
Air Quality Index (AQI) level in 2022 was 111. This is significantly worse than average.
| City: | 111 |
| U.S.: | 73 |
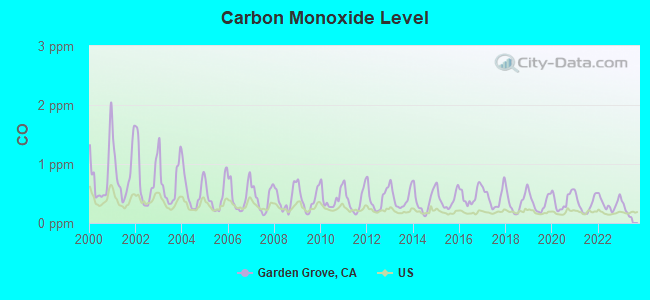
Carbon Monoxide (CO) [ppm] level in 2022 was 0.329. This is worse than average. Closest monitor was 3.8 miles away from the city center.
| City: | 0.329 |
| U.S.: | 0.251 |
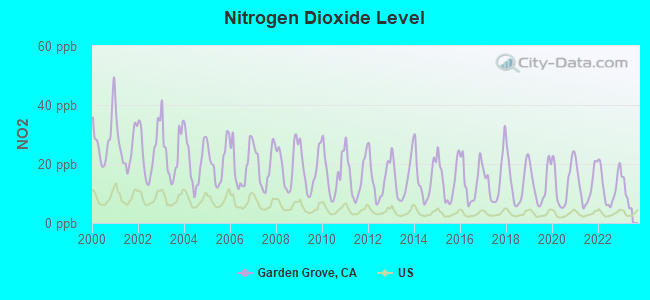
Nitrogen Dioxide (NO2) [ppb] level in 2022 was 12.4. This is significantly worse than average. Closest monitor was 0.9 miles away from the city center.
| City: | 12.4 |
| U.S.: | 5.1 |
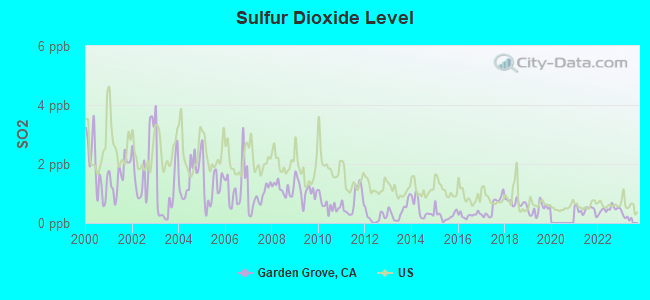
Sulfur Dioxide (SO2) [ppb] level in 2022 was 0.466. This is significantly better than average. Closest monitor was 0.9 miles away from the city center.
| City: | 0.466 |
| U.S.: | 1.515 |
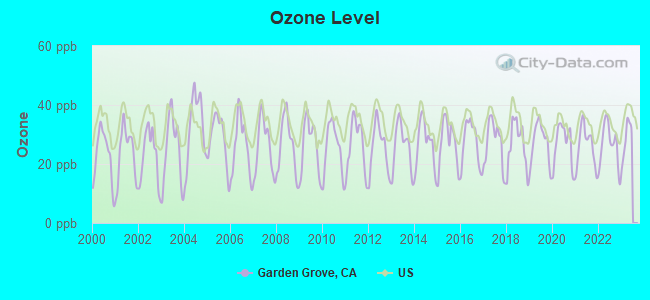
Ozone [ppb] level in 2022 was 26.4. This is better than average. Closest monitor was 3.8 miles away from the city center.
| City: | 26.4 |
| U.S.: | 33.3 |
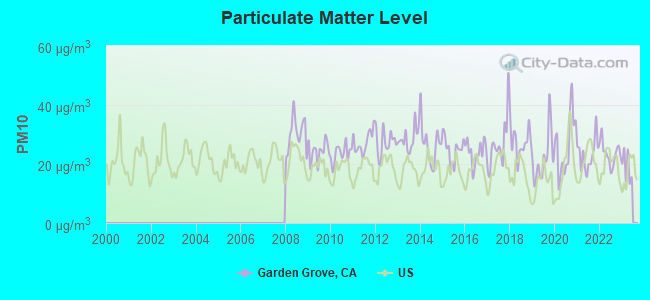
Particulate Matter (PM10) [µg/m3] level in 2022 was 23.6. This is worse than average. Closest monitor was 3.8 miles away from the city center.
| City: | 23.6 |
| U.S.: | 19.2 |
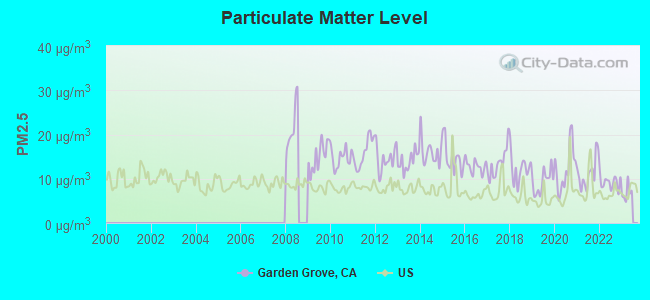
Particulate Matter (PM2.5) [µg/m3] level in 2022 was 9.18. This is about average. Closest monitor was 3.8 miles away from the city center.
| City: | 9.18 |
| U.S.: | 8.11 |
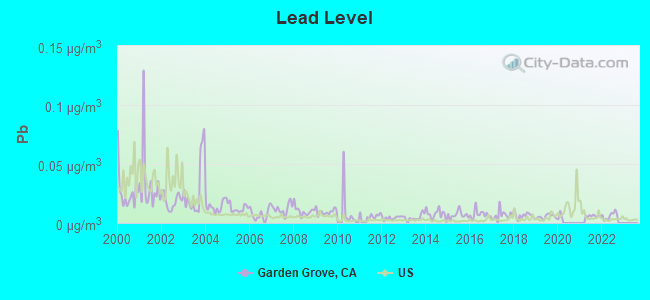
Lead (Pb) [µg/m3] level in 2022 was 0.00612. This is significantly better than average. Closest monitor was 4.0 miles away from the city center.
| City: | 0.00612 |
| U.S.: | 0.00931 |
Earthquake activity:
Garden Grove-area historical earthquake activity is significantly above California state average. It is 6841% greater than the overall U.S. average.On 7/21/1952 at 11:52:14, a magnitude 7.7 (7.7 UK, Class: Major, Intensity: VIII - XII) earthquake occurred 103.2 miles away from the city center, causing $50,000,000 total damage
On 6/28/1992 at 11:57:34, a magnitude 7.6 (6.2 MB, 7.6 MS, 7.3 MW, Depth: 0.7 mi) earthquake occurred 86.6 miles away from the city center, causing 3 deaths (1 shaking deaths, 2 other deaths) and 400 injuries, causing $100,000,000 total damage and $40,000,000 insured losses
On 10/16/1999 at 09:46:44, a magnitude 7.4 (6.3 MB, 7.4 MS, 7.2 MW, 7.3 ML) earthquake occurred 101.1 miles away from Garden Grove center
On 11/4/1927 at 13:51:53, a magnitude 7.5 (7.5 UK) earthquake occurred 192.2 miles away from the city center
On 4/21/1918 at 22:32:30, a magnitude 6.8 (6.8 UK, Class: Strong, Intensity: VII - IX) earthquake occurred 30.0 miles away from Garden Grove center
On 5/19/1940 at 04:36:40, a magnitude 7.2 (7.2 UK) earthquake occurred 136.1 miles away from the city center, causing $33,000,000 total damage
Magnitude types: body-wave magnitude (MB), local magnitude (ML), surface-wave magnitude (MS), moment magnitude (MW)
Natural disasters:
The number of natural disasters in Orange County (32) is a lot greater than the US average (15).Major Disasters (Presidential) Declared: 22
Emergencies Declared: 2
Causes of natural disasters: Floods: 15, Fires: 13, Storms: 9, Landslides: 6, Winter Storms: 6, Mudslides: 5, Earthquakes: 2, Heavy Rain: 1, Hurricane: 1, Snow: 1, Tornado: 1, Wind: 1, Other: 1 (Note: some incidents may be assigned to more than one category).

Main business address for: DPAC TECHNOLOGIES CORP (SEMICONDUCTORS & RELATED DEVICES), HYCOR BIOMEDICAL INC /DE/ (IN VITRO & IN VIVO DIAGNOSTIC SUBSTANCES), BRIDGE TECHNOLOGY INC (COMPUTER PERIPHERAL EQUIPMENT, NEC).
Hospitals in Garden Grove:
- GARDEN GROVE HOSPITAL & MEDICAL CENTER (Proprietary, provides emergency services, 12601 GARDEN GROVE BLVD)
- HILL ROAD HOME (10162 HILL ROAD)
- OCEAN BREEZE (9712 LENORE DRIVE)
- ODYSSEY HEALTHCARE OF ORANGE COUNTY (7077 ORANGEWOOD AVENUE, STE 201)
- REGENCY HOSPICE (12062 VALLEY VIEW STREET, UNIT 225B)
Nursing Homes in Garden Grove:
- ALTA GARDENS CARE CENTER (13075 BLACKBIRD STREET)
- CHAPMAN CARE CENTER (12232 CHAPMAN AVE)
- GARDEN GROVE CONVALESCENT HOSP (12882 SHACKELFORD LANE)
- GARDEN PARK CARE CENTER (12681 HASTER STREET)
- ORANGEGROVE REHABILITATION HOSPITAL (12332 GARDEN GROVE BLVD.)
- PACIFIC HAVEN HEALTHCARE CENTE (12072 TRASK AVE.)
Dialysis Facilities in Garden Grove:
- RAI-GARDEN GROVE BLVD.-GARDEN (12555 GARDEN GROVE BLVD., SUITE 100)
- RAI-HARBOR BLVD.-GARDEN GROVE (12761 HARBOR BLVD., SUITE I-3)
Home Health Centers in Garden Grove:
- ACTIVE HOME HEALTH SERVICES, INC (13522 NEWHOPE STREET)
- CARESOUTH HOME HEALTH (12419 LEWIS, SUITE 101 & 104)
- CAREWELL HOME HEALTH, INC (12630 BROOKHURST ST, SUITE E)
- PEC HEALTHCARE (10507 GARDEN GROVE BLVD)
- QUALITY HOME HEALTH SERVICES (11642 KNOTT STREET UNIT 7)
- STAFF BUILDERS SERVICES INC (12966 EUCLID STREET SUITE 200)
- UNITED INTEGRITY HOME HEALTH INC (12900-A GARDEN GROVE BLVD, SUITE 116)
Amtrak stations near Garden Grove:
- 5 miles: ANAHEIM (2150 KATELLA AVE.) . Services: ticket office, fully wheelchair accessible, enclosed waiting area, public restrooms, public payphones, vending machines, free short-term parking, free long-term parking, call for car rental service, call for taxi service.
- 7 miles: SANTA ANA (1000 E. SANTA ANA BLVD.) . Services: ticket office, fully wheelchair accessible, enclosed waiting area, public restrooms, public payphones, snack bar, free short-term parking, free long-term parking, call for car rental service, taxi stand, intercity bus service, public transit connection.
- 7 miles: FULLERTON (120 E. SANTA FE AVE.) . Services: ticket office, fully wheelchair accessible, enclosed waiting area, public restrooms, public payphones, full-service food facilities, free short-term parking, paid long-term parking, taxi stand, public transit connection.
Colleges/Universities in Garden Grove:
- Concorde Career College-Garden Grove (Full-time enrollment: 1,428; Location: 12951 Euclid Street, Suite 101; Private, for-profit; Website: www.concorde.edu)
- Advance Beauty College (Full-time enrollment: 322; Location: 10121 Westminster Ave; Private, for-profit; Website: www.advancebeautycollege.com)
- Career Academy of Beauty (Full-time enrollment: 214; Location: 12471 Valley View; Private, for-profit; Website: CAofB.com)
- CRU Institute (Full-time enrollment: 100; Location: 11889 Valley View St Suite C; Private, for-profit; Website: www.cruinstitute.com)
- California Career Institute (Full-time enrollment: 100; Location: 12141 Brookhurst Street; Private, for-profit; Website: www.ccinursing.com)
- Thanh Le College School of Cosmetology (Full-time enrollment: 48; Location: 12875 chapman ave; Private, for-profit; Website: WWW.thanhlecollege.com)
Colleges/universities with over 2000 students nearest to Garden Grove:
- West Coast University-Orange County (about 4 miles; Anaheim, CA; Full-time enrollment: 2,464)
- Golden West College (about 4 miles; Huntington Beach, CA; FT enrollment: 7,358)
- Santa Ana College (about 5 miles; Santa Ana, CA; FT enrollment: 11,756)
- Trident University International (about 5 miles; Cypress, CA; FT enrollment: 5,974)
- Cypress College (about 5 miles; Cypress, CA; FT enrollment: 8,732)
- Chapman University (about 7 miles; Orange, CA; FT enrollment: 7,089)
- Fullerton College (about 8 miles; Fullerton, CA; FT enrollment: 11,124)
Public high schools in Garden Grove:
- GARDEN GROVE HIGH (Students: 1,617, Location: 11271 STANFORD AVE., Grades: 9-12)
- SANTIAGO HIGH (Students: 1,543, Location: 12342 TRASK AVE., Grades: 9-12)
- RANCHO ALAMITOS HIGH (Students: 1,401, Location: 11351 DALE ST., Grades: 9-12)
- PACIFICA HIGH (Students: 1,366, Location: 6851 LAMPSON AVE., Grades: 9-12)
- BOLSA GRANDE HIGH (Students: 1,287, Location: 9401 W.MINSTER AVE., Grades: 9-12)
- MARIE L. HARE HIGH (Students: 99, Location: 12012 MAGNOLIA ST., Grades: 7-12)
- JORDAN SECONDARY LEARNING CENTER (Students: 19, Location: 9915 WOODBURY AVE., Grades: 9-12)
- LINCOLN HIGH CONTINUATION (Students: 18, Location: 11262 GARDEN GROVE BLVD., Grades: 9-12)
Private high schools in Garden Grove:
Biggest public elementary/middle schools in Garden Grove:
- LEROY L. DOIG INTERMEDIATE (Students: 863, Location: 12752 TRASK AVE., Grades: 7-8)
- ALAMITOS INTERMEDIATE (Students: 825, Location: 12381 DALE ST., Grades: 7-8)
- OCIA A. PETERS ELEMENTARY (Students: 820, Location: 13162 NEWHOPE ST., Grades: KG-6)
- JAMES IRVINE INTERMEDIATE (Students: 813, Location: 10552 HAZARD AVE., Grades: 7-8)
- DONALD S. JORDAN INTERMEDIATE (Students: 695, Location: 9821 WOODBURY RD., Grades: 7-8)
- HILTON D. BELL INTERMEDIATE (Students: 682, Location: 12345 SPRINGDALE ST., Grades: 7-8)
- PATTON ELEMENTARY (Students: 678, Location: 6861 SANTA RITA AVE., Grades: KG-6)
- IZAAK WALTON INTERMEDIATE (Students: 636, Location: 12181 BUARO ST., Grades: 7-8)
- DR. WALTER C. RALSTON INTERMEDIATE (Students: 584, Location: 10851 E. LAMPSON AVE., Grades: 7-8)
- LOUIS LAKE INTERMEDIATE (Students: 581, Location: 10801 ORANGEWOOD AVE., Grades: 7-8)
Private elementary/middle schools in Garden Grove:
- ORANGE CRESCENT SCHOOL (Students: 322, Location: 1 AL RAHMAN PLAZA, Grades: PK-8)
- ST COLUMBAN SCHOOL (Students: 232, Location: 10855 STANFORD AVE, Grades: PK-8)
- ST CALLISTUS CATHOLIC SCHOOL (Students: 175, Location: 12901 LEWIS ST, Grades: KG-8)
- ST PAUL'S LUTHERAN SCHOOL (Students: 161, Location: 13082 BOWEN ST, Grades: PK-8)
- MONTESSORI GREENHOUSE SCHOOL (Students: 148, Location: 5856 BELGRAVE AVE, Grades: PK-5)
- PAGE PRIVATE SCHOOL-GARDEN GROVE (Students: 92, Location: 12111 BUARO ST, Grades: PK-6)
- KING OF KINGS LUTHERAN (Students: 67, Location: 13431 NEWHOPE ST, Grades: PK-7)
- O C KIDS PRESCHOOL (Students: 28, Location: 11362 BROOKHURST ST, Grades: KG-T1)
Points of interest:
Notable locations in Garden Grove: Garden Grove Regional Library (A), Garden Grove City Hall (B), Chapman Branch Orange County Public Library (C), West Garden Grove Branch Orange County Public Library (D), American Medical Response Garden Grove (E), Americare Ambulance Service Station 3 (F), Garden Grove Fire Department Station 7 (G), Garden Grove Fire Department Station 6 (H), Garden Grove Fire Department Station 5 (I), Garden Grove Fire Department Station 4 (J), Garden Grove Fire Department Station 3 (K), Garden Grove Fire Department Station 2 (L), Garden Grove Fire Department Station 1 (M). Display/hide their locations on the map
Shopping Centers: Garden Grove Promenade Shopping Center (1), Garden Square Shopping Center (2), Pavilion Plaza Shopping Center (3), Harbor Town and Country Shopping Center (4), Harbor Plaza Shopping Center (5), Gardenland Shopping Center (6), Garden Grove Shopping Center (7), Eastgate Plaza Shopping Center (8). Display/hide their locations on the map
Main business address in Garden Grove include: DPAC TECHNOLOGIES CORP (A), HYCOR BIOMEDICAL INC /DE/ (B), BRIDGE TECHNOLOGY INC (C). Display/hide their locations on the map
Churches in Garden Grove include: Brazilian Evangelical Church (A), Chapman Avenue Baptist Church (B), Choonghyun Presbyterian Church (C), Church of Christ (D), Church of Christ of Garden Grove (E), Church of Jesus Christ of Latter Day Saints (F), Cross County Christian Church (G), Evangelical Formosan Church (H), Evangelical Free Church (I). Display/hide their locations on the map
Cemetery: Magnolia Memorial Park (1). Display/hide its location on the map
Reservoirs: Haster Retarding Basin (A), West Street Basin (B). Display/hide their locations on the map
Parks in Garden Grove include: Eastgate Park (1), Garden Grove Park (2), Gutosky Park (3), Magnolia Park (4), Sierra Park (5), Chapman Sports Park (6), Edgar Park (7), Westgrove Park (8), Woodbury Park (9). Display/hide their locations on the map
Tourist attractions: Crystal Cathedral (Cultural Attractions- Events- & Facilities; 12141 Lewis Street) (1), Jeri's Studio (Art Museums; 11562 Knott) (2), Amf Valley View Lanes (Amusement & Theme Parks; 12141 Valley View Street) (3). Display/hide their approximate locations on the map
Hotels: Best Western Plaza International Inn (7912 Garden Grove Boulevard) (1), Anaheim Marriott Suites (12015 Harbor Boulevard) (2), Angels Inn (11851 Harbor Boulevard) (3). Display/hide their approximate locations on the map
Birthplace of: Alan Trammell - Professional baseball player, Charlene Rink - Professional fitness competitor, Darryl Kile - Baseball player, Dexter Holland - Male singer, Justin Chon - Actor, Luis Gil - Soccer player, Matt Treanor - 2005 Major League Baseball player (Florida Marlins, born: Mar 3, 1976), Ralph Bacerra - Artist, Rick Bauer - 2005 Major League Baseball player (Baltimore Orioles, born: Jan 10, 1977), Troy Polamalu - 2005 NFL player (Pittsburgh Steelers, born: Apr 19, 1981).
| This city: | 3.7 people |
| California: | 2.9 people |
| This city: | 80.6% |
| Whole state: | 68.7% |
| This city: | 5.0% |
| Whole state: | 7.2% |
Likely homosexual households (counted as self-reported same-sex unmarried-partner households)
- Lesbian couples: 0.3% of all households
- Gay men: 0.3% of all households
People in group quarters in Garden Grove in 2010:
- 624 people in nursing facilities/skilled-nursing facilities
- 532 people in group homes intended for adults
- 281 people in other noninstitutional facilities
- 277 people in residential treatment centers for adults
- 74 people in workers' group living quarters and job corps centers
- 70 people in emergency and transitional shelters (with sleeping facilities) for people experiencing homelessness
- 67 people in correctional residential facilities
- 11 people in in-patient hospice facilities
- 5 people in mental (psychiatric) hospitals and psychiatric units in other hospitals
People in group quarters in Garden Grove in 2000:
- 701 people in nursing homes
- 638 people in other noninstitutional group quarters
- 295 people in homes for the mentally retarded
- 204 people in other nonhousehold living situations
- 187 people in homes or halfway houses for drug/alcohol abuse
- 87 people in halfway houses
- 87 people in homes for the mentally ill
- 14 people in religious group quarters
- 11 people in college dormitories (includes college quarters off campus)
- 5 people in homes for the physically handicapped
- 5 people in other group homes
Banks with most branches in Garden Grove (2011 data):
- Bank of America, National Association: Lampson-Valley View Branch, Harbor/Flagstone Branch, Brookhurst - Westminister Branch, West Garden Grove Industrial Branch, Garden Grove Main Branch. Info updated 2009/11/18: Bank assets: $1,451,969.3 mil, Deposits: $1,077,176.8 mil, headquarters in Charlotte, NC, positive income, 5782 total offices, Holding Company: Bank Of America Corporation
- JPMorgan Chase Bank, National Association: 12555 Valley View Branch, Harbor Boulevard Branch, Garden Grove Branch. Info updated 2011/11/10: Bank assets: $1,811,678.0 mil, Deposits: $1,190,738.0 mil, headquarters in Columbus, OH, positive income, International Specialization, 5577 total offices, Holding Company: Jpmorgan Chase & Co.
- Wells Fargo Bank, National Association: Garden Grove Promenade Branch, Garden Grove Branch, Garden Grove Valley View Branch. Info updated 2011/04/05: Bank assets: $1,161,490.0 mil, Deposits: $905,653.0 mil, headquarters in Sioux Falls, SD, positive income, 6395 total offices, Holding Company: Wells Fargo & Company
- U.S. Bank National Association: Valley View Vons Branch at 11861 Valley View Street, branch established on 2003/11/24; Garden Grove Branch at 12112 Valley View Street, branch established on 1928/01/01. Info updated 2012/01/30: Bank assets: $330,470.8 mil, Deposits: $236,091.5 mil, headquarters in Cincinnati, OH, positive income, 3121 total offices, Holding Company: U.S. Bancorp
- Hanmi Bank: Garden Grove-Brookhurst Branch at 9820 Garden Grove Boulevard, branch established on 1989/06/20; Garden Grove-Magnolia Branch at 9122 Garden Grove Boulevard, branch established on 1982/03/04. Info updated 2010/04/01: Bank assets: $2,739.6 mil, Deposits: $2,377.7 mil, headquarters in Los Angeles, CA, positive income, Commercial Lending Specialization, 28 total offices, Holding Company: Hanmi Financial Corporation
- Wilshire State Bank: Garden Grove Branch at 9672 Garden Grove Blvd, branch established on 2005/08/15. Info updated 2012/02/10: Bank assets: $2,691.4 mil, Deposits: $2,212.8 mil, headquarters in Los Angeles, CA, negative income in the last year, Commercial Lending Specialization, 24 total offices, Holding Company: Wilshire Bancorp, Inc.
- HSBC Bank USA, National Association: Garden Grove Branch at 9622 Garden Grove Boulevard, Suite 101, branch established on 2009/07/14. Info updated 2010/11/30: Bank assets: $206,009.7 mil, Deposits: $149,026.8 mil, headquarters in Mc Lean, VA, positive income, 474 total offices, Holding Company: Hsbc Holdings Plc
- US Metro Bank: Us Metro Bank at 9866 Garden Grove Boulevard, branch established on 2006/09/15. Info updated 2011/09/23: Bank assets: $94.2 mil, Deposits: $78.5 mil, local headquarters, negative income in the last year, Commercial Lending Specialization, 1 total offices
- Uniti Bank: Garden Grove Branch at 9252 Garden Grove Boulevard #27, branch established on 2005/04/11. Info updated 2011/01/18: Bank assets: $180.2 mil, Deposits: $158.6 mil, headquarters in Buena Park, CA, positive income, Commercial Lending Specialization, 3 total offices, Holding Company: Uniti Financial Corporation
- 8 other banks with 8 local branches
For population 15 years and over in Garden Grove:
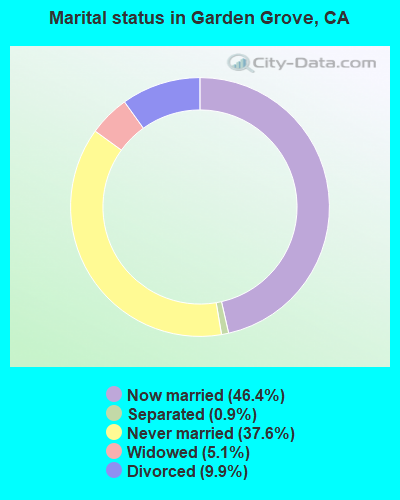
- Never married: 37.6%
- Now married: 46.4%
- Separated: 0.9%
- Widowed: 5.1%
- Divorced: 9.9%
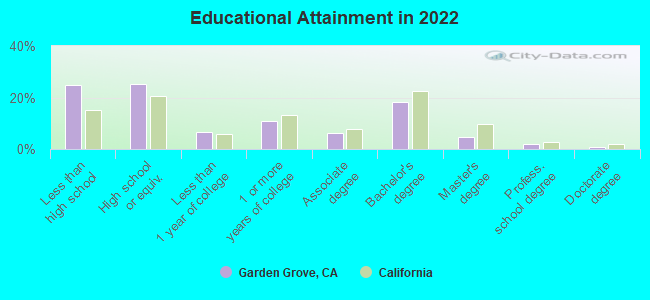
For population 25 years and over in Garden Grove:
- High school or higher: 75.3%
- Bachelor's degree or higher: 25.9%
- Graduate or professional degree: 7.6%
- Unemployed: 6.8%
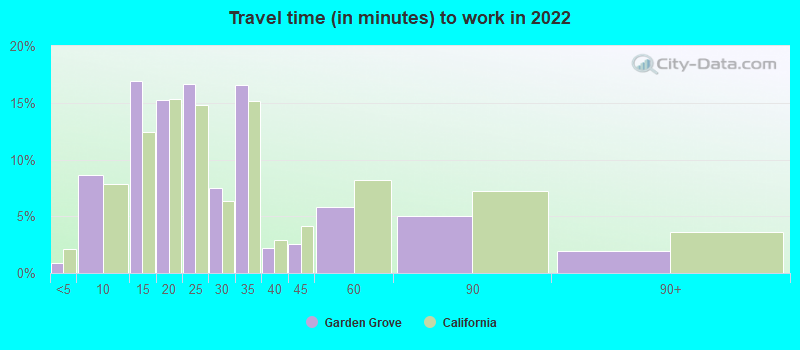
- Mean travel time to work (commute): 24.8 minutes
| Here: | 20.3 |
| California average: | 15.5 |


Graphs represent county-level data. Detailed 2008 Election Results
Religion statistics for Garden Grove, CA (based on Orange County data)


| Religion | Adherents | Congregations |
|---|---|---|
| Catholic | 797,473 | 67 |
| Evangelical Protestant | 345,893 | 894 |
| Other | 141,815 | 329 |
| Mainline Protestant | 76,574 | 202 |
| Orthodox | 13,406 | 19 |
| Black Protestant | 2,424 | 8 |
| None | 1,632,647 | - |
Food Environment Statistics:
| Orange County: | 1.78 / 10,000 pop. |
| State: | 2.14 / 10,000 pop. |
| This county: | 0.06 / 10,000 pop. |
| State: | 0.04 / 10,000 pop. |
| Here: | 0.49 / 10,000 pop. |
| State: | 0.62 / 10,000 pop. |
| Orange County: | 1.46 / 10,000 pop. |
| California: | 1.49 / 10,000 pop. |
| Orange County: | 8.19 / 10,000 pop. |
| State: | 7.42 / 10,000 pop. |
| Orange County: | 6.3% |
| State: | 7.3% |
| Here: | 18.5% |
| California: | 21.3% |
| Orange County: | 16.4% |
| California: | 17.9% |
Health and Nutrition:
| Garden Grove: | 50.7% |
| California: | 49.4% |
| This city: | 48.1% |
| State: | 48.0% |
| Garden Grove: | 27.3 |
| California: | 28.1 |
| Here: | 19.9% |
| California: | 20.2% |
| Garden Grove: | 14.5% |
| California: | 11.2% |
| This city: | 6.8 |
| State: | 6.8 |
| Garden Grove: | 27.6% |
| California: | 31.5% |
| This city: | 56.1% |
| California: | 56.4% |
| This city: | 81.4% |
| California: | 80.9% |
More about Health and Nutrition of Garden Grove, CA Residents
| Local government employment and payroll (March 2022) | |||||
| Function | Full-time employees | Monthly full-time payroll | Average yearly full-time wage | Part-time employees | Monthly part-time payroll |
|---|---|---|---|---|---|
| Police Protection - Officers | 148 | $1,617,799 | $131,173 | 2 | $2,203 |
| Police - Other | 92 | $844,796 | $110,191 | 21 | $36,369 |
| Water Supply | 50 | $456,434 | $109,544 | 1 | $648 |
| Streets and Highways | 48 | $431,255 | $107,814 | 8 | $11,900 |
| Financial Administration | 43 | $401,300 | $111,991 | 6 | $20,429 |
| Welfare | 28 | $254,055 | $108,881 | 16 | $22,502 |
| Housing and Community Development (Local) | 28 | $292,618 | $125,408 | 2 | $2,909 |
| Parks and Recreation | 25 | $217,026 | $104,172 | 27 | $55,087 |
| Other Government Administration | 23 | $287,090 | $149,786 | 9 | $13,231 |
| Other and Unallocable | 14 | $125,307 | $107,406 | 13 | $37,717 |
| Sewerage | 11 | $95,259 | $103,919 | 1 | $1,844 |
| Totals for Government | 510 | $5,022,939 | $118,187 | 106 | $204,840 |
Garden Grove government finances - Expenditure in 2018 (per resident):
- Construction - Housing and Community Development: $67,455,000 ($398.54)
Water Utilities: $6,442,000 ($38.06)
Regular Highways: $4,460,000 ($26.35)
Police Protection: $1,593,000 ($9.41)
- Current Operations - Police Protection: $56,391,000 ($333.17)
Housing and Community Development: $45,764,000 ($270.39)
Water Utilities: $30,302,000 ($179.03)
Local Fire Protection: $24,710,000 ($145.99)
Sewerage: $11,290,000 ($66.70)
Central Staff Services: $9,915,000 ($58.58)
Regular Highways: $8,657,000 ($51.15)
Parks and Recreation: $5,251,000 ($31.02)
Solid Waste Management: $3,969,000 ($23.45)
Health - Other: $3,128,000 ($18.48)
Protective Inspection and Regulation - Other: $838,000 ($4.95)
Financial Administration: $652,000 ($3.85)
- General - Interest on Debt: $5,418,000 ($32.01)
- Intergovernmental to Local - Other - Water Utilities: $16,155,000 ($95.45)
Other - Police Protection: $974,000 ($5.75)
Other - Local Fire Protection: $634,000 ($3.75)
- Other Capital Outlay - Water Utilities: $2,184,000 ($12.90)
Local Fire Protection: $971,000 ($5.74)
General - Other: $410,000 ($2.42)
General Public Building: $111,000 ($0.66)
Health - Other: $99,000 ($0.58)
- Water Utilities - Interest on Debt: $1,688,000 ($9.97)
Garden Grove government finances - Revenue in 2018 (per resident):
- Charges - Housing and Community Development: $31,461,000 ($185.88)
Sewerage: $17,801,000 ($105.17)
Other: $11,548,000 ($68.23)
Solid Waste Management: $4,312,000 ($25.48)
Parks and Recreation: $2,721,000 ($16.08)
Regular Highways: $264,000 ($1.56)
- Federal Intergovernmental - Other: $2,989,000 ($17.66)
Housing and Community Development: $1,521,000 ($8.99)
- Miscellaneous - General Revenue - Other: $11,074,000 ($65.43)
Fines and Forfeits: $4,107,000 ($24.27)
Interest Earnings: $2,644,000 ($15.62)
Special Assessments: $427,000 ($2.52)
Rents: $125,000 ($0.74)
Donations From Private Sources: $65,000 ($0.38)
- Revenue - Water Utilities: $35,595,000 ($210.31)
- State Intergovernmental - Other: $4,496,000 ($26.56)
Highways: $3,731,000 ($22.04)
General Local Government Support: $181,000 ($1.07)
Sewerage: $17,000 ($0.10)
- Tax - Property: $49,493,000 ($292.42)
Other Selective Sales: $25,983,000 ($153.51)
General Sales and Gross Receipts: $20,737,000 ($122.52)
Other License: $3,144,000 ($18.58)
Other: $2,882,000 ($17.03)
Occupation and Business License - Other: $2,830,000 ($16.72)
Public Utilities Sales: $2,408,000 ($14.23)
Documentary and Stock Transfer: $587,000 ($3.47)
Garden Grove government finances - Debt in 2018 (per resident):
- Long Term Debt - Outstanding Unspecified Public Purpose: $118,238,000 ($698.58)
Beginning Outstanding - Unspecified Public Purpose: $104,267,000 ($616.04)
Issue, Unspecified Public Purpose: $20,271,000 ($119.77)
Retired Unspecified Public Purpose: $6,300,000 ($37.22)
Garden Grove government finances - Cash and Securities in 2018 (per resident):
- Bond Funds - Cash and Securities: $29,625,000 ($175.03)
- Other Funds - Cash and Securities: $129,801,000 ($766.90)
4.86% of this county's 2021 resident taxpayers lived in other counties in 2020 ($95,983 average adjusted gross income)
| Here: | 4.86% |
| California average: | 5.19% |
0.01% of residents moved from foreign countries ($132 average AGI)
Orange County: 0.01% California average: 0.03%
Top counties from which taxpayers relocated into this county between 2020 and 2021:
| from Los Angeles County, CA | |
| from Riverside County, CA | |
| from San Diego County, CA |
5.71% of this county's 2020 resident taxpayers moved to other counties in 2021 ($106,828 average adjusted gross income)
| Here: | 5.71% |
| California average: | 6.14% |
0.01% of residents moved to foreign countries ($180 average AGI)
Orange County: 0.01% California average: 0.02%
Top counties to which taxpayers relocated from this county between 2020 and 2021:
| to Los Angeles County, CA | |
| to Riverside County, CA | |
| to San Diego County, CA |
| Businesses in Garden Grove, CA | ||||
| Name | Count | Name | Count | |
|---|---|---|---|---|
| 24 Hour Fitness | 1 | KFC | 3 | |
| 7-Eleven | 9 | Kroger | 1 | |
| 99 Cents Only Stores | 4 | LA Fitness | 1 | |
| AMF Bowling | 1 | Lane Furniture | 1 | |
| Albertsons | 1 | Little Caesars Pizza | 1 | |
| Arby's | 1 | Marriott | 1 | |
| AutoZone | 4 | Marshalls | 1 | |
| Avenue | 1 | McDonald's | 6 | |
| Baskin-Robbins | 2 | Nike | 4 | |
| Burger King | 3 | Nissan | 1 | |
| Burlington Coat Factory | 1 | Office Depot | 1 | |
| CVS | 1 | Outback | 1 | |
| Carl\s Jr. | 5 | Outback Steakhouse | 1 | |
| Chevrolet | 1 | Panda Express | 1 | |
| Chuck E. Cheese's | 1 | Payless | 2 | |
| Circle K | 1 | Pizza Hut | 3 | |
| Cold Stone Creamery | 1 | RadioShack | 3 | |
| Costco | 1 | Ramada | 1 | |
| Curves | 1 | Red Lobster | 1 | |
| DHL | 2 | Red Robin | 1 | |
| Dairy Queen | 2 | Rite Aid | 5 | |
| Dennys | 1 | SAS Shoes | 1 | |
| Discount Tire | 1 | Safeway | 2 | |
| Domino's Pizza | 2 | Sheraton | 1 | |
| Econo Lodge | 1 | Sprint Nextel | 1 | |
| El Pollo Loco | 2 | Staples | 1 | |
| FedEx | 10 | Starbucks | 6 | |
| Firestone Complete Auto Care | 2 | T-Mobile | 6 | |
| GNC | 4 | Taco Bell | 4 | |
| GameStop | 1 | Target | 2 | |
| Goodwill | 1 | Toyota | 1 | |
| H&R Block | 3 | U-Haul | 3 | |
| Hilton | 4 | UPS | 12 | |
| Holiday Inn | 3 | Vans | 1 | |
| Home Depot | 1 | Volkswagen | 1 | |
| HomeTown Buffet | 1 | Vons | 2 | |
| Hyatt | 1 | Walgreens | 3 | |
| IHOP | 1 | Wendy's | 1 | |
| Just Tires | 1 | |||
Strongest AM radio stations in Garden Grove:
- KFI (640 AM; 50 kW; LOS ANGELES, CA; Owner: CAPSTAR TX LIMITED PARTNERSHIP)
- KVNR (1480 AM; 5 kW; SANTA ANA, CA; Owner: LBI RADIO LICENSE CORP.)
- KTNQ (1020 AM; 50 kW; LOS ANGELES, CA; Owner: KTNQ-AM LICENSE CORP.)
- KLAC (570 AM; 50 kW; LOS ANGELES, CA; Owner: AMFM RADIO LICENSES, L.L.C.)
- KXTA (1150 AM; 50 kW; LOS ANGELES, CA; Owner: CITICASTERS LICENSES, L.P.)
- KPLS (830 AM; 50 kW; ORANGE, CA; Owner: CRN LICENSES, LLC)
- KNX (1070 AM; 50 kW; LOS ANGELES, CA; Owner: INFINITY BROADCASTING OPERATIONS, INC.)
- KFWB (980 AM; 50 kW; LOS ANGELES, CA; Owner: INFINITY BROADCASTING OPERATIONS, INC.)
- KDIS (1110 AM; 50 kW; PASADENA, CA; Owner: ABC,INC.)
- KMPC (1540 AM; 50 kW; LOS ANGELES, CA; Owner: ROSE CITY RADIO CORPORATION)
- KSPN (710 AM; 50 kW; LOS ANGELES, CA; Owner: KABC-AM RADIO, INC.)
- KBLA (1580 AM; 50 kW; SANTA MONICA, CA)
- KXMX (1190 AM; 25 kW; ANAHEIM, CA; Owner: NEW INSPIRATION BROADCASTING COMPANY)
Strongest FM radio stations in Garden Grove:
- KDLE (103.1 FM; NEWPORT BEACH, CA; Owner: ENTRAVISION HOLDINGS, LLC.)
- KEBN (94.3 FM; GARDEN GROVE, CA; Owner: LBI RADIO LICENSE CORP.)
- KWVE (107.9 FM; SAN CLEMENTE, CA; Owner: CALVARY CHAPEL OF COSTA MESA)
- KCBS-FM (93.1 FM; LOS ANGELES, CA; Owner: INFINITY BROADCASTING OPERATIONS, INC.)
- KZLA-FM (93.9 FM; LOS ANGELES, CA; Owner: EMMIS RADIO LICENSE CORPORATION)
- KPWR (105.9 FM; LOS ANGELES, CA; Owner: EMMIS RADIO LICENSE CORPORATION)
- KLSX (97.1 FM; LOS ANGELES, CA; Owner: INFINITY BROADCASTING OPERATIONS, INC.)
- KUSC (91.5 FM; LOS ANGELES, CA; Owner: UNIVERSITY OF SOUTHERN CALIFORNIA)
- KSCA (101.9 FM; GLENDALE, CA; Owner: HBC LICENSE CORPORATION)
- KLOS (95.5 FM; LOS ANGELES, CA; Owner: KLOS-FM RADIO, INC.)
- K212FA (90.3 FM; TEMPLE CITY, CA; Owner: EDUCATIONAL MEDIA FOUNDATION)
- KOST (103.5 FM; LOS ANGELES, CA; Owner: CAPSTAR TX LIMITED PARTNERSHIP)
- KKLA-FM (99.5 FM; LOS ANGELES, CA; Owner: NEW INSPIRATION BROADCASTING CO., INC.)
- KIIS-FM (102.7 FM; LOS ANGELES, CA; Owner: CITICASTERS LICENSES, L.P.)
- KLVE (107.5 FM; LOS ANGELES, CA; Owner: KLVE-FM LICENSE CORP.)
- KPCC (89.3 FM; PASADENA, CA; Owner: PASADENA AREA COMMUNITY COLLEGE DISTRICT)
- KHHT (92.3 FM; LOS ANGELES, CA; Owner: AMFM RADIO LICENSES, L.L.C.)
- KBIG-FM (104.3 FM; LOS ANGELES, CA; Owner: AMFM RADIO LICENSES, L.L.C.)
- KRTH-FM (101.1 FM; LOS ANGELES, CA; Owner: INFINITY BROADCASTING OPERATIONS, INC.)
- KMZT-FM (105.1 FM; LOS ANGELES, CA; Owner: MOUNT WILSON FM BROADCASTERS, INC.)
TV broadcast stations around Garden Grove:
- KTRO-LP (Channel 50; LANCASTER, CA; Owner: ROBERT D. ADELMAN)
- KCBS-TV (Channel 2; LOS ANGELES, CA; Owner: CBS BROADCASTING INC.)
- KNBC (Channel 4; LOS ANGELES, CA; Owner: NBC SUBSIDIARY (KNBC-TV), INC.)
- National Bridge Inventory (NBI) Statistics
- 37Number of bridges
- 341ft / 104mTotal length
- $2,965,000Total costs
- 2,913,000Total average daily traffic
- 139,060Total average daily truck traffic

- New bridges - historical statistics
- 11950-1959
- 281960-1969
- 11970-1979
- 62000-2009
- 12010-2019
FCC Registered Private Land Mobile Towers: 4 (See the full list of FCC Registered Private Land Mobile Towers in Garden Grove, CA)
FCC Registered Broadcast Land Mobile Towers: 40 (See the full list of FCC Registered Broadcast Land Mobile Towers)
FCC Registered Microwave Towers: 73 (See the full list of FCC Registered Microwave Towers in this town)
FCC Registered Paging Towers: 3 (See the full list of FCC Registered Paging Towers)
FCC Registered Amateur Radio Licenses: 900 (See the full list of FCC Registered Amateur Radio Licenses in Garden Grove)
FAA Registered Aircraft Manufacturers and Dealers: 1 (See the full list of FAA Registered Manufacturers and Dealers in Garden Grove)
FAA Registered Aircraft: 28 (See the full list of FAA Registered Aircraft)
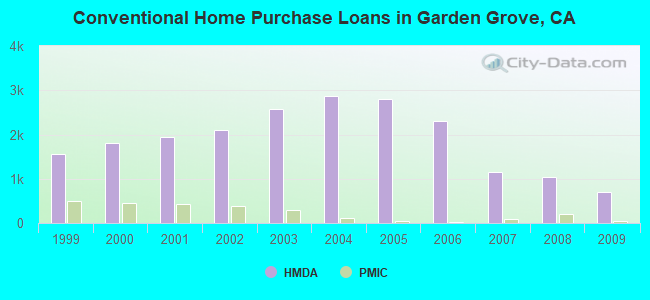
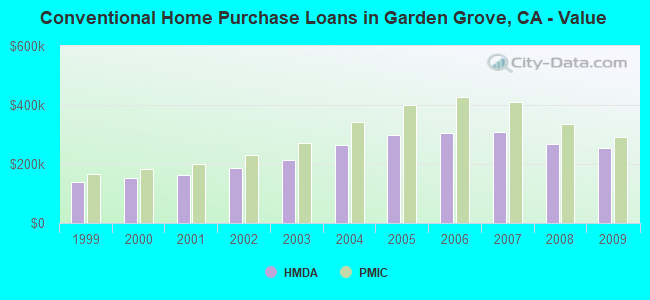
| Home Mortgage Disclosure Act Aggregated Statistics For Year 2009 (Based on 25 full and 15 partial tracts) | ||||||||||||||
| A) FHA, FSA/RHS & VA Home Purchase Loans | B) Conventional Home Purchase Loans | C) Refinancings | D) Home Improvement Loans | E) Loans on Dwellings For 5+ Families | F) Non-occupant Loans on < 5 Family Dwellings (A B C & D) | G) Loans On Manufactured Home Dwelling (A B C & D) | ||||||||
|---|---|---|---|---|---|---|---|---|---|---|---|---|---|---|
| Number | Average Value | Number | Average Value | Number | Average Value | Number | Average Value | Number | Average Value | Number | Average Value | Number | Average Value | |
| LOANS ORIGINATED | 215 | $310,625 | 708 | $252,596 | 2,082 | $261,882 | 101 | $181,826 | 13 | $1,461,752 | 257 | $237,173 | 7 | $53,194 |
| APPLICATIONS APPROVED, NOT ACCEPTED | 25 | $309,936 | 144 | $261,975 | 303 | $279,916 | 26 | $158,302 | 0 | $0 | 57 | $256,874 | 1 | $48,990 |
| APPLICATIONS DENIED | 71 | $287,873 | 231 | $246,381 | 813 | $293,290 | 63 | $112,609 | 1 | $4,800,000 | 131 | $240,398 | 13 | $83,064 |
| APPLICATIONS WITHDRAWN | 37 | $300,461 | 166 | $252,392 | 426 | $284,834 | 29 | $194,606 | 2 | $8,198,500 | 57 | $250,332 | 1 | $49,280 |
| FILES CLOSED FOR INCOMPLETENESS | 20 | $280,921 | 43 | $210,429 | 149 | $286,571 | 5 | $178,880 | 1 | $630,000 | 18 | $212,428 | 6 | $84,232 |
Detailed mortgage data for all 40 tracts in Garden Grove, CA
| Private Mortgage Insurance Companies Aggregated Statistics For Year 2009 (Based on 24 full and 15 partial tracts) | ||||||
| A) Conventional Home Purchase Loans | B) Refinancings | C) Non-occupant Loans on < 5 Family Dwellings (A & B) | ||||
|---|---|---|---|---|---|---|
| Number | Average Value | Number | Average Value | Number | Average Value | |
| LOANS ORIGINATED | 49 | $291,230 | 15 | $288,541 | 0 | $0 |
| APPLICATIONS APPROVED, NOT ACCEPTED | 33 | $316,518 | 14 | $408,480 | 0 | $0 |
| APPLICATIONS DENIED | 10 | $274,645 | 8 | $350,730 | 1 | $289,060 |
| APPLICATIONS WITHDRAWN | 4 | $345,518 | 5 | $263,978 | 1 | $384,000 |
| FILES CLOSED FOR INCOMPLETENESS | 3 | $399,333 | 0 | $0 | 0 | $0 |
2005 - 2018 National Fire Incident Reporting System (NFIRS) incidents
- Fire incident types reported to NFIRS in Garden Grove, CA
- 74635.2%Structure Fires
- 71833.8%Outside Fires
- 40919.3%Mobile Property/Vehicle Fires
- 24911.7%Other
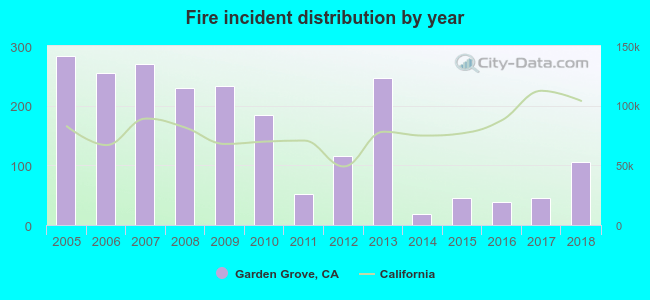 Based on the data from the years 2005 - 2018 the average number of fire incidents per year is 152. The highest number of fires - 284 took place in 2005, and the least - 18 in 2014. The data has a dropping trend.
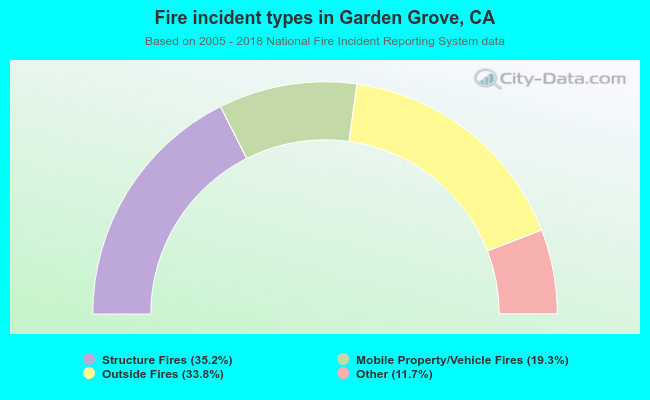 When looking into fire subcategories, the most incidents belonged to: Structure Fires (35.2%), and Outside Fires (33.8%).
Fire-safe hotels and motels in Garden Grove, California:
- Hyatt Regency Orange County, 11999 Harbor Blvd, Garden Grove, California 92840 , Phone: (714) 750-1234, Fax: (714) 740-0465
- Inn Cal, 8062 GDN GRV Blvd, Garden Grove, California 92644 , Phone: (714) 898-3500
- Harbor Motel, 12812 Palm St, Garden Grove, California 92840 , Phone: (714) 537-8008
- Wyndham Anaheim Garden Grove, 12021 Harbor Blvd, Garden Grove, California 92840 , Phone: (714) 867-5151, Fax: (714) 867-5100
- Embassy Suites Hotel Anaheim South, 11767 Harbor Blvd, Garden Grove, California 92840 , Phone: (714) 539-3300, Fax: (714) 539-4600
- Hampton Inn & Suites, 11747 Harbor Blvd, Garden Grove, California 92840 , Phone: (714) 703-8800, Fax: (714) 703-8900
- Holiday Inn Express Hotel & Suites Garden Grove, 12867 Gdn Grove Blvd, Garden Grove, California 92843 , Phone: (714) 539-3535, Fax: (714) 539-5656
- Residence Inn Anaheim Resort Area, 11931 Harbor Blvd, Garden Grove, California 92840 , Phone: (714) 591-4000, Fax: (714) 591-4001
- 4 other hotels and motels
| Most common first names in Garden Grove, CA among deceased individuals | ||
| Name | Count | Lived (average) |
|---|---|---|
| John | 192 | 75.1 years |
| Mary | 178 | 81.1 years |
| Robert | 175 | 73.5 years |
| James | 151 | 74.5 years |
| William | 141 | 77.3 years |
| Dorothy | 93 | 82.7 years |
| Margaret | 87 | 81.6 years |
| Helen | 79 | 83.4 years |
| Richard | 79 | 69.7 years |
| Charles | 76 | 73.9 years |
| Most common last names in Garden Grove, CA among deceased individuals | ||
| Last name | Count | Lived (average) |
|---|---|---|
| Nguyen | 384 | 74.9 years |
| Tran | 137 | 74.0 years |
| Le | 89 | 73.8 years |
| Pham | 85 | 75.2 years |
| Kim | 67 | 79.3 years |
| Smith | 57 | 78.2 years |
| Vu | 49 | 73.9 years |
| Lee | 48 | 79.0 years |
| Truong | 38 | 74.6 years |
| Miller | 35 | 75.0 years |
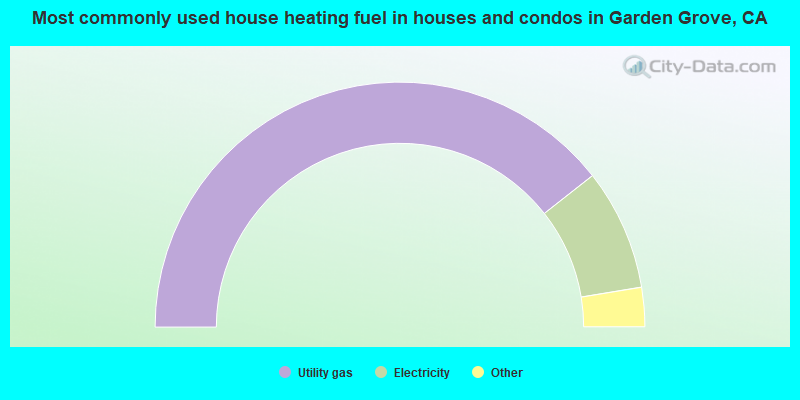
- 78.8%Utility gas
- 16.0%Electricity
- 2.4%No fuel used
- 1.6%Bottled, tank, or LP gas
- 0.8%Solar energy
- 0.2%Other fuel
- 0.1%Fuel oil, kerosene, etc.
- 60.3%Utility gas
- 28.6%Electricity
- 8.5%No fuel used
- 1.7%Bottled, tank, or LP gas
- 0.5%Wood
- 0.2%Solar energy
Garden Grove compared to California state average:
- Unemployed percentage below state average.
- Black race population percentage significantly below state average.
- Foreign-born population percentage above state average.
- Length of stay since moving in above state average.
Garden Grove, CA compared to other similar cities:
Garden Grove on our top lists:
- #6 on the list of "Top 101 cities with the most residents born in Vietnam (population 500+)"
- #7 on the list of "Top 101 cities with largest percentage of males in industries: other services, except public administration (population 50,000+)"
- #10 on the list of "Top 101 cities with largest percentage of females in occupations: personal care and service occupations (population 50,000+)"
- #14 on the list of "Top 101 cities with largest percentage of females in industries: other services, except public administration (population 50,000+)"
- #19 on the list of "Top 101 cities with the highest percentage of family households, population 100,000+"
- #24 on the list of "Top 101 cities with the lowest number of police officers per 1000 residents (population 50,000+)"
- #26 on the list of "Top 101 cities with the most cars per house, population 50,000+"
- #26 on the list of "Top 101 cities with the most residents born in South Eastern Asia (population 500+)"
- #30 on the list of "Top 101 cities with largest percentage of females in occupations: production occupations (population 50,000+)"
- #31 on the list of "Top 100 cities with highest percentage of foreign-born residents (pop. 50,000+)"
- #33 on the list of "Top 101 cities with largest percentage of females in industries: manufacturing (population 50,000+)"
- #42 on the list of "Top 101 cities with largest percentage of males in occupations: production occupations (population 50,000+)"
- #52 on the list of "Top 101 cities with the lowest percentage of English-only speaking households, population 50,000+"
- #54 on the list of "Top 101 cities with the least people having Doctorate degrees (population 50,000+)"
- #55 on the list of "Top 100 low-educated but high-earning cities (pop. 50,000+)"
- #62 on the list of "Top 101 cities with largest percentage of females in industries: arts, entertainment, and recreation (population 50,000+)"
- #72 on the list of "Top 101 cities with the least people having Master's or Doctorate degrees (population 50,000+)"
- #77 on the list of "Top 101 cities with the lowest number of rapes per 100,000 residents (population 50,000+)"
- #79 on the list of "Top 101 larger cities with the highest increase in house/condo value from 2000 (population 50,000+)"
- #84 on the list of "Top 101 cities with the most residents born in Asia (population 500+)"
- #11 (92703) on the list of "Top 101 zip codes with the largest percentage of taxpayers using paid preparers for 2012 taxes (pop 5,000+)"
- #85 (92683) on the list of "Top 101 zip codes with the most full service restaurants in 2005"
- #4 on the list of "Top 101 counties with the highest total withdrawal of fresh water for public supply"
- #5 on the list of "Top 101 counties with the most Catholic adherents"
- #6 on the list of "Top 101 counties with the highest ground withdrawal of fresh water for public supply"
- #7 on the list of "Top 101 counties with the most Evangelical Protestant adherents"
- #8 on the list of "Top 101 counties with the highest Particulate Matter (PM2.5) Annual air pollution readings in 2012 (µg/m3)"

|
|
Total of 576 patent applications in 2008-2024.