Estimated zip code population in 2022: 53,379 Zip code population in 2010: 54,083 Zip code population in 2000: 50,636
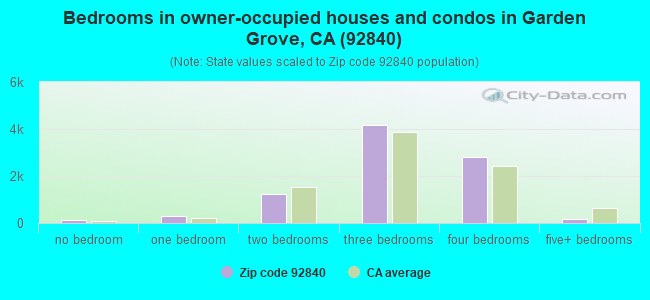
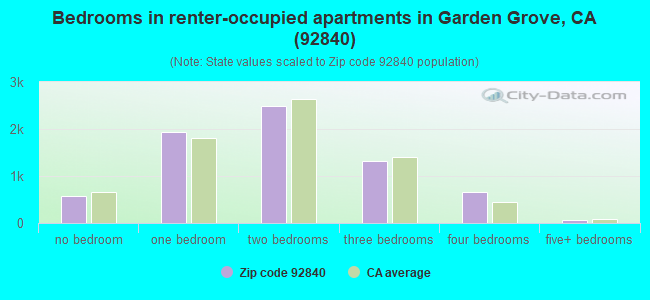
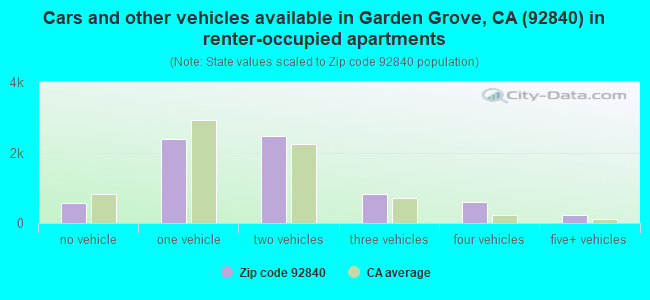
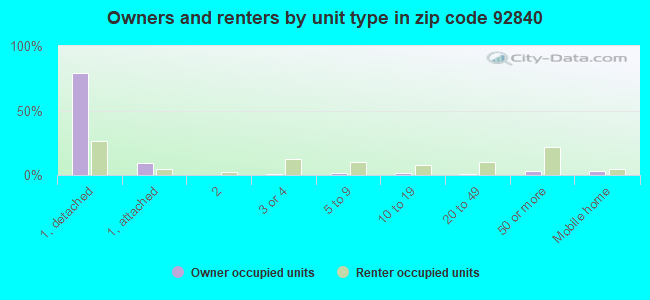
Houses and condos: 16,488 Renter-occupied apartments: 7,049
% of renters here:
44%
State:
44%
March 2022 cost of living index in zip code 92840: 87.0 (less than average, U.S. average is 100)
Land area: 5.2 sq. mi. Water area: 0.0 sq. mi.
Population density: 10,261 people per square mile
(high).
OSM Map
General Map
Google Map
MSN Map
OSM Map
General Map
Google Map
MSN Map
OSM Map
General Map
Google Map
MSN Map
OSM Map
General Map
Google Map
MSN Map
Please wait while loading the map...
Real estate property taxes paid for housing units in 2022:
This zip code:
0.7% ($4,845)
California:
0.7% ($4,831)
Median real estate property taxes paid for housing units with mortgages in 2022: $5,540 (0.7%) Median real estate property taxes paid for housing units with no mortgage in 2022: $3,886 (0.5%)
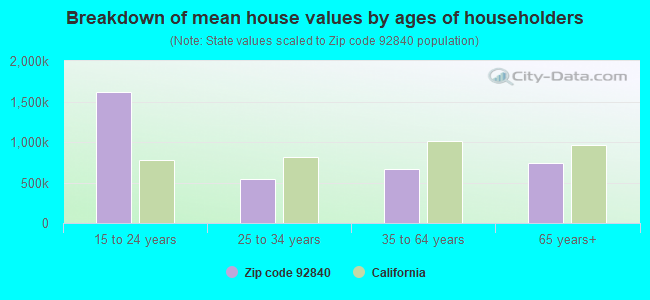
Estimated median house/condo value in 2022: $736,965
92840:
$736,965
California:
$715,900
According to our research of California and other state lists, there were 40 registered sex offenders living in 92840 zip code as of April 27, 2024. The ratio of all residents to sex offenders in zip code 92840 is 1,427 to 1. The ratio of registered sex offenders to all residents in this zip code is lower than the state average.
Median resident age:
This zip code:
38.1 years
California median age:
37.9 years
Average household size:
This zip code:
3.3 people
California:
2.8 people
Averages for the 2020 tax year for zip code 92840, filed in 2021:
Average Adjusted Gross Income (AGI) in 2020: $49,091 (Individual Income Tax Returns)
Here:
$49,091
State:
$95,910
Salary/wage: $45,427 (reported on 83.3% of returns)
Here:
$45,427
State:
$77,331
(% of AGI for various income ranges: 1135.8% for AGIs below $25k, 4047.6% for AGIs $25k-50k, 7835.6% for AGIs $50k-75k, 11152.1% for AGIs $75k-100k, 20537.2% for AGIs $100k-200k, 65370.8% for AGIs over 200k)
Taxable interest for individuals: $678 (reported on 25.5% of returns)
This zip code:
$678
California:
$2,294
(% of AGI for various income ranges: 8.9% for AGIs below $25k, 13.8% for AGIs $25k-50k, 28.4% for AGIs $50k-75k, 48.8% for AGIs $75k-100k, 109.3% for AGIs $100k-200k, 316.9% for AGIs over 200k)
Ordinary dividends: $1,964 (reported on 10.5% of returns)
Here:
$1,964
State:
$10,949
(% of AGI for various income ranges: 6.8% for AGIs below $25k, 12.6% for AGIs $25k-50k, 31.1% for AGIs $50k-75k, 55.1% for AGIs $75k-100k, 149.6% for AGIs $100k-200k, 641.5% for AGIs over 200k)
Net capital gain/loss in AGI: +$7,388 (reported on 12.7% of returns)
Here:
+$7,388
State:
+$49,306
(% of AGI for various income ranges: 7.0% for AGIs below $25k, 16.4% for AGIs $25k-50k, 60.5% for AGIs $50k-75k, 128.9% for AGIs $75k-100k, 428.8% for AGIs $100k-200k, 11566.2% for AGIs over 200k)
Profit/loss from business: +$7,576 (reported on 18.9% of returns)
Here:
+$7,576
State:
+$15,671
(% of AGI for various income ranges: 209.5% for AGIs below $25k, 160.2% for AGIs $25k-50k, 211.4% for AGIs $50k-75k, 227.4% for AGIs $75k-100k, 358.3% for AGIs $100k-200k, 2026.2% for AGIs over 200k)
Taxable individual retirement arrangement distribution: $15,878 (reported on 3.5% of returns)
92840:
$15,878
California:
$23,505
(% of AGI for various income ranges: 24.7% for AGIs below $25k, 34.3% for AGIs $25k-50k, 93.9% for AGIs $50k-75k, 188.0% for AGIs $75k-100k, 350.6% for AGIs $100k-200k, 1382.3% for AGIs over 200k)
Self-employed (Keogh) retirement plans: $14,575 (reported on 0.1% of returns)
92840:
$14,575
California:
$30,163
(% of AGI for various income ranges: 41.3% for AGIs $100k-200k)
Total itemized deductions: $28,525 (reported on 9.7% of returns)
Here:
$28,525
State:
$39,517
(% of AGI for various income ranges: 51.3% for AGIs below $25k, 146.2% for AGIs $25k-50k, 465.2% for AGIs $50k-75k, 920.5% for AGIs $75k-100k, 2071.8% for AGIs $100k-200k, 7876.9% for AGIs over 200k)
Charity contributions: $5,292 (reported on 8.0% of returns)
Here:
$5,292
State:
$12,598
(% of AGI for various income ranges: 2.8% for AGIs below $25k, 14.3% for AGIs $25k-50k, 49.5% for AGIs $50k-75k, 114.7% for AGIs $75k-100k, 303.3% for AGIs $100k-200k, 2630.0% for AGIs over 200k)
Taxes paid: $8,519 (reported on 9.7% of returns)
92840:
$8,519
State:
$8,807
(% of AGI for various income ranges: 14.2% for AGIs below $25k, 40.1% for AGIs $25k-50k, 146.5% for AGIs $50k-75k, 294.9% for AGIs $75k-100k, 661.4% for AGIs $100k-200k, 1740.0% for AGIs over 200k)
Earned income credit: $1,861 (reported on 18.5% of returns)
Here:
$1,861
State:
$2,074
(% of AGI for various income ranges: 83.3% for AGIs below $25k, 68.7% for AGIs $25k-50k, 1.0% for AGIs $50k-75k)
Percentage of individuals using paid preparers for their 2020 taxes: 92.8%
Here:
93%
State:
92%
(% for various income ranges: 91.1% for AGIs below $25k, 93.7% for AGIs $25k-50k, 94.0% for AGIs $50k-75k, 93.7% for AGIs $75k-100k, 93.6% for AGIs $100k-200k, 93.2% for AGIs over 200k)
Averages for the 2012 tax year for zip code 92840, filed in 2013:
Average Adjusted Gross Income (AGI) in 2012: $40,322 (Individual Income Tax Returns)
Here:
$40,322
State:
$72,726
Salary/wage: $39,253 (reported on 85.1% of returns)
Here:
$39,253
State:
$59,079
(% of AGI for various income ranges: 76.6% for AGIs below $25k, 86.8% for AGIs $25k-50k, 85.7% for AGIs $50k-75k, 83.8% for AGIs $75k-100k, 84.1% for AGIs $100k-200k, 59.5% for AGIs over 200k)
Taxable interest for individuals: $569 (reported on 26.3% of returns)
This zip code:
$569
California:
$2,146
(% of AGI for various income ranges: 0.5% for AGIs below $25k, 0.2% for AGIs $25k-50k, 0.3% for AGIs $50k-75k, 0.3% for AGIs $75k-100k, 0.4% for AGIs $100k-200k, 0.5% for AGIs over 200k)
Ordinary dividends: $2,183 (reported on 8.9% of returns)
Here:
$2,183
State:
$9,308
(% of AGI for various income ranges: 0.5% for AGIs below $25k, 0.3% for AGIs $25k-50k, 0.4% for AGIs $50k-75k, 0.3% for AGIs $75k-100k, 0.8% for AGIs $100k-200k, 0.5% for AGIs over 200k)
Net capital gain/loss in AGI: +$901 (reported on 8.3% of returns)
Here:
+$901
State:
+$30,460
(% of AGI for various income ranges: 0.2% for AGIs $75k-100k, 0.4% for AGIs $100k-200k, 2.7% for AGIs over 200k)
Profit/loss from business: +$10,285 (reported on 17.7% of returns)
Here:
+$10,285
State:
+$17,064
(% of AGI for various income ranges: 14.2% for AGIs below $25k, 4.3% for AGIs $25k-50k, 2.3% for AGIs $50k-75k, 2.1% for AGIs $75k-100k, 2.0% for AGIs $100k-200k, 4.9% for AGIs over 200k)
Taxable individual retirement arrangement distribution: $12,424 (reported on 4.7% of returns)
92840:
$12,424
California:
$19,557
(% of AGI for various income ranges: 1.4% for AGIs below $25k, 1.2% for AGIs $25k-50k, 1.5% for AGIs $50k-75k, 1.5% for AGIs $75k-100k, 1.5% for AGIs $100k-200k, 2.2% for AGIs over 200k)
Self-employment retirement plans: $14,925 (reported on 0.2% of returns)
92840:
$14,925
California:
$24,530
Total itemized deductions: $22,030 (29% of AGI, reported on 28.0% of returns)
Here:
$22,030
State:
$34,004
Here:
28.9% of AGI
State:
22.7% of AGI
(% of AGI for various income ranges: 7.5% for AGIs below $25k, 11.3% for AGIs $25k-50k, 16.7% for AGIs $50k-75k, 19.2% for AGIs $75k-100k, 19.7% for AGIs $100k-200k, 19.6% for AGIs over 200k)
Charity contributions: $2,437 (reported on 22.8% of returns)
Here:
$2,437
State:
$4,659
(% of AGI for various income ranges: 0.4% for AGIs below $25k, 0.9% for AGIs $25k-50k, 1.4% for AGIs $50k-75k, 1.8% for AGIs $75k-100k, 1.9% for AGIs $100k-200k, 2.6% for AGIs over 200k)
Taxes paid: $6,776 (reported on 27.8% of returns)
92840:
$6,776
State:
$14,448
(% of AGI for various income ranges: 1.5% for AGIs below $25k, 2.6% for AGIs $25k-50k, 4.6% for AGIs $50k-75k, 6.0% for AGIs $75k-100k, 7.4% for AGIs $100k-200k, 7.9% for AGIs over 200k)
Earned income credit: $2,254 (reported on 23.8% of returns)
Here:
$2,254
State:
$2,286
(% of AGI for various income ranges: 6.9% for AGIs below $25k, 1.4% for AGIs $25k-50k)
Percentage of individuals using paid preparers for their 2012 taxes: 72.9%
Here:
73%
State:
64%
(% for various income ranges: 72.1% for AGIs below $25k, 74.7% for AGIs $25k-50k, 73.0% for AGIs $50k-75k, 70.8% for AGIs $75k-100k, 73.5% for AGIs $100k-200k, 75.0% for AGIs over 200k)
Averages for the 2004 tax year for zip code 92840, filed in 2005:
Average Adjusted Gross Income (AGI) in 2004: $35,529 (Individual Income Tax Returns)
Here:
$35,529
State:
$58,600
Salary/wage: $34,572 (reported on 87.7% of returns)
Here:
$34,572
State:
$49,455
(% of AGI for various income ranges: 94.4% for AGIs below $10k, 82.4% for AGIs $10k-25k, 89.3% for AGIs $25k-50k, 87.5% for AGIs $50k-75k, 88.7% for AGIs $75k-100k, 74.0% for AGIs over 100k)
Taxable interest for individuals: $716 (reported on 35.9% of returns)
This zip code:
$716
California:
$2,365
(% of AGI for various income ranges: 3.1% for AGIs below $10k, 0.8% for AGIs $10k-25k, 0.6% for AGIs $25k-50k, 0.6% for AGIs $50k-75k, 0.7% for AGIs $75k-100k, 0.9% for AGIs over 100k)
Taxable dividends: $1,478 (reported on 11.1% of returns)
Here:
$1,478
State:
$4,746
(% of AGI for various income ranges: 1.5% for AGIs below $10k, 0.5% for AGIs $10k-25k, 0.3% for AGIs $25k-50k, 0.3% for AGIs $50k-75k, 0.3% for AGIs $75k-100k, 0.9% for AGIs over 100k)
Net capital gain/loss: +$6,597 (reported on 10.1% of returns)
Here:
+$6,597
State:
+$23,418
(% of AGI for various income ranges: -1.3% for AGIs below $10k, -0.2% for AGIs $10k-25k, 0.1% for AGIs $25k-50k, 0.3% for AGIs $50k-75k, 1.0% for AGIs $75k-100k, 9.8% for AGIs over 100k)
Profit/loss from business: +$9,285 (reported on 16.2% of returns)
Here:
+$9,285
State:
+$16,826
(% of AGI for various income ranges: 16.7% for AGIs below $10k, 8.8% for AGIs $10k-25k, 3.6% for AGIs $25k-50k, 3.0% for AGIs $50k-75k, 1.8% for AGIs $75k-100k, 3.5% for AGIs over 100k)
IRA payment deduction: $2,821 (reported on 1.9% of returns)
92840:
$2,821
California:
$3,192
(% of AGI for various income ranges: 0.2% for AGIs below $10k, 0.1% for AGIs $10k-25k, 0.1% for AGIs $25k-50k, 0.2% for AGIs $50k-75k, 0.1% for AGIs $75k-100k, 0.1% for AGIs over 100k)
Self-employed pension: $8,941 (reported on 0.3% of returns)
Here:
$8,941
California:
$17,688
(% of AGI for various income ranges: 0.0% for AGIs $25k-50k, 0.1% for AGIs $50k-75k, 0.1% for AGIs $75k-100k, 0.2% for AGIs over 100k)
Total itemized deductions: $20,044 (32% of AGI, reported on 33.5% of returns)
Here:
$20,044
State:
$28,113
Here:
32.3% of AGI
State:
25.3% of AGI
(% of AGI for various income ranges: 11.3% for AGIs below $10k, 9.8% for AGIs $10k-25k, 17.4% for AGIs $25k-50k, 22.8% for AGIs $50k-75k, 23.3% for AGIs $75k-100k, 21.2% for AGIs over 100k)
Charity contributions deductions: $2,292 (3% of AGI, reported on 28.5% of returns)
Here:
$2,292
State:
$3,923
Here:
3.5% of AGI
State:
3.3% of AGI
(% of AGI for various income ranges: 0.5% for AGIs below $10k, 0.6% for AGIs $10k-25k, 1.5% for AGIs $25k-50k, 2.3% for AGIs $50k-75k, 2.5% for AGIs $75k-100k, 2.5% for AGIs over 100k)
Total tax: $3,887 (reported on 69.5% of returns)
92840:
$3,887
State:
$10,761
(% of AGI for various income ranges: 4.4% for AGIs below $10k, 3.8% for AGIs $10k-25k, 5.6% for AGIs $25k-50k, 7.6% for AGIs $50k-75k, 8.8% for AGIs $75k-100k, 13.6% for AGIs over 100k)
Earned income credit: $1,774 (reported on 20.5% of returns)
Here:
$1,774
State:
$1,763
Percentage of individuals using paid preparers for their 2004 taxes: 70.3%
Here:
70%
State:
66%
(% for various income ranges: 62.6% for AGIs below $10k, 71.5% for AGIs $10k-25k, 71.2% for AGIs $25k-50k, 71.9% for AGIs $50k-75k, 74.7% for AGIs $75k-100k, 75.9% for AGIs over 100k)
Likely homosexual households (counted as self-reported same-sex unmarried-partner households)
Lesbian couples: 0.3% of all households
Gay men: 0.3% of all households
Household received Food Stamps/SNAP in the past 12 months: 2,187 Household did not receive Food Stamps/SNAP in the past 12 months: 13,710
Women who had a birth in the past 12 months: 625 (375 now married, 250 unmarried) Women who did not have a birth in the past 12 months: 12,754 (4,849 now married, 7,913 unmarried)
Housing units in zip code 92840 with a mortgage: 5,750 (371 second mortgage, 19 home equity loan, 261 both second mortgage and home equity loan) Houses without a mortgage: 260
Median monthly owner costs for units with a mortgage: $2,534 Median monthly owner costs for units without a mortgage: $657
Residents with income below the poverty level in 2022:
This zip code:
10.7%
Whole state:
12.2%
Residents with income below 50% of the poverty level in 2022:
This zip code:
5.8%
Whole state:
6.2%
Median number of rooms in houses and condos:
Here:
5.6
State:
6.0
Median number of rooms in apartments:
Here:
3.9
State:
3.9
Notable locations in this zip code not listed on our city pages
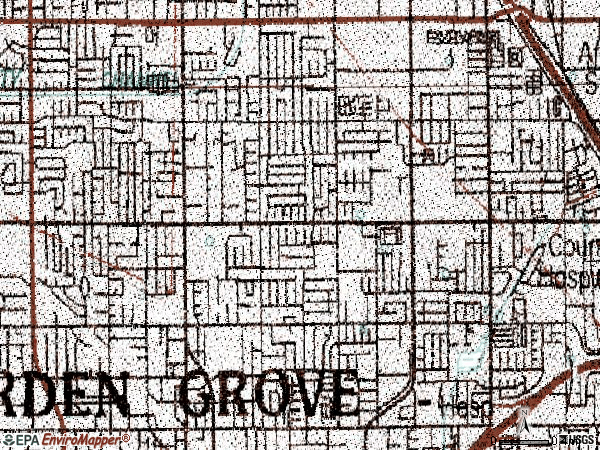
Notable locations in zip code 92840: Garden Grove Regional Library (A), Garden Grove City Hall (B), American Medical Response Garden Grove (C), Garden Grove Fire Department Station 6 (D), Garden Grove Fire Department Station 1 (E). Display/hide their locations on the map
Churches in zip code 92840 include: Chapman Avenue Baptist Church (A), Choonghyun Presbyterian Church (B), Church of Christ of Garden Grove (C), Church of Jesus Christ of Latter Day Saints (D), Evangelical Formosan Church (E), First Baptist Church of Garden Grove (F), First Christian Church (G), First Presbyterian Church (H), Garden Grove United Methodist Church (I). Display/hide their locations on the map
Parks in zip code 92840 include: Sierra Park (1), Community Center Park (2), Euclid Park (3), Faylane Park (4), Lake School Park (5), Westhaven Park (6), Pioneer Park (7), Twin Lakes Park (8). Display/hide their locations on the map
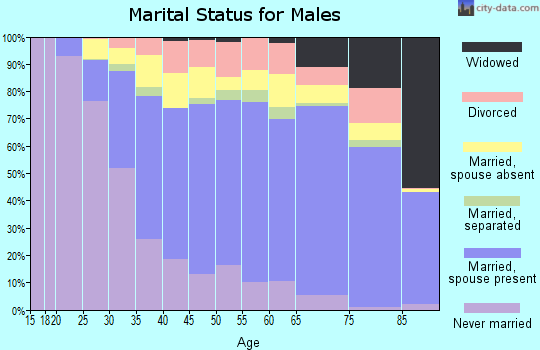
6,323 married couples with children.
2,818 single-parent households (713 men, 2,105 women).
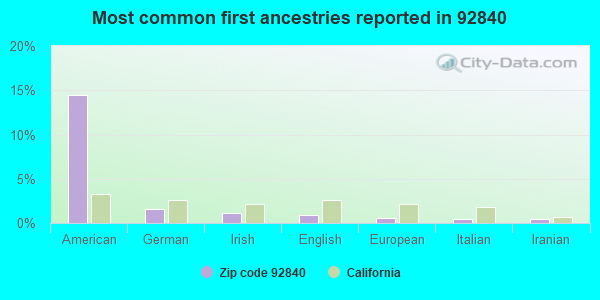
33.5% of residents of 92840 zip code speak English at home.
34.0% of residents speak Spanish at home (63% very well, 19% well, 11% not well, 6% not at all).
1.2% of residents speak other Indo-European language at home (83% very well, 10% well, 7% not well).
30.5% of residents speak Asian or Pacific Island language at home (41% very well, 27% well, 27% not well, 6% not at all).
0.6% of residents speak other language at home (36% very well, 38% well, 12% not well, 13% not at all).
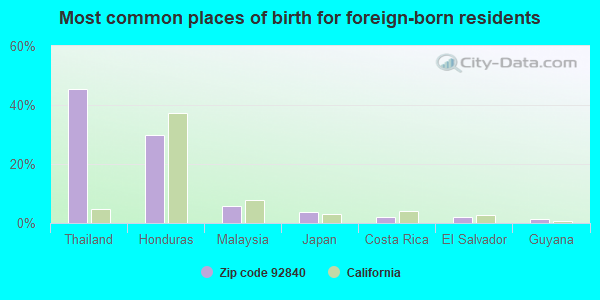
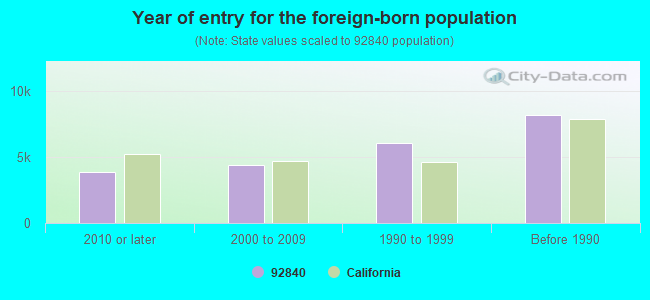
Foreign born population: 21,807 (40.9%) (68.5% of them are naturalized citizens)
Major facilities with environmental interests located in this zip code:
FIRESTONE STORE 2729 (10081 CHAMPAN AVE in GARDEN GROVE, CA)
STATE MASTER (California - Hazardous Waste Tracking) - HAZARDOU WASTE PROGRAM Small Quantity Generators, between 100 kg and 1000 kg of hazardous waste/month (Resource Conservation and Recovery Act (tracking hazardous waste)) - notification STATE MASTER (California - Used Oil Recycling System ) - USED OIL RECYCLING, USED OIL PROGRAM Organizations: FIRESTONE TIRE INC (CONTACT/OWNER)
Alternative names: FIRESTONE STORE #2729, FIRESTONE STORE #7180
EQUILON ENTERPRISES LLC (13471 MAGNOLIA in GARDEN GROVE, CA) . Federal Facility
STATE MASTER (California - Hazardous Waste Tracking) - HAZARDOU WASTE PROGRAM HAZARDOUS WASTE BIENNIAL REPORTER (Resource Conservation and Recovery Act (tracking hazardous waste)) Small Quantity Generators, between 100 kg and 1000 kg of hazardous waste/month (Resource Conservation and Recovery Act (tracking hazardous waste)) Small Quantity Generators, between 100 kg and 1000 kg of hazardous waste/month (Resource Conservation and Recovery Act (tracking hazardous waste)) - notification Organizations: JOE CHIM (CONTACT/OWNER)
Alternative names: MAGNOLIA TEXACO, TEXACO SVC STA
ELECTRON PLATING III (13932 ENTERPRISE DR in GARDEN GROVE, CA)
STATE MASTER (California - Hazardous Waste Tracking) - HAZARDOU WASTE PROGRAM HAZARDOUS WASTE BIENNIAL REPORTER (Resource Conservation and Recovery Act (tracking hazardous waste)) Large Quantity Generators, more that 1000 kg of hazardous waste/month (Resource Conservation and Recovery Act (tracking hazardous waste)) TRI REPORTER (Tracking of toxic chemicals releasing facilities) Business SIC and NAICS classification: ELECTROPLATING, PLATING, POLISHING, ANODIZING, AND COLORING
CANNON EQUIPMENT WEST, INC (12822 MONARCH ST in GARDEN GROVE, CA)
STATE MASTER (California - Hazardous Waste Tracking) - HAZARDOU WASTE PROGRAM Small Quantity Generators, between 100 kg and 1000 kg of hazardous waste/month (Resource Conservation and Recovery Act (tracking hazardous waste)) Small Quantity Generators, between 100 kg and 1000 kg of hazardous waste/month (Resource Conservation and Recovery Act (tracking hazardous waste)) Business NAICS classification: INDUSTRIAL TRUCK, TRACTOR, TRAILER, AND STACKER MACHINERY MANUFACTURING. Alternative names: ACME WIRE PRODUCTS INC
1-DAY PAINT & BODY CENTERS INC (13612 HARBOR BLVD in GARDEN GROVE, CA)
STATE MASTER (California - Hazardous Waste Tracking) - HAZARDOU WASTE PROGRAM CRITERIA AND HAZARDOUS AIR POLLUTANT INVENTORY (Inventory of air pollution sources) Small Quantity Generators, between 100 kg and 1000 kg of hazardous waste/month (Resource Conservation and Recovery Act (tracking hazardous waste)) Business SIC classification: TOP, BODY, AND UPHOLSTERY REPAIR SHOPS AND PAINT SHOPS Business NAICS classification: AUTOMOTIVE BODY, PAINT, AND INTERIOR REPAIR AND MAINTENANCE.
HI-TECH COLLISION & PAINTING S (13051 CANNERY ST in GARDEN GROVE, CA)
STATE MASTER (California - Hazardous Waste Tracking) - HAZARDOU WASTE PROGRAM Small Quantity Generators, between 100 kg and 1000 kg of hazardous waste/month (Resource Conservation and Recovery Act (tracking hazardous waste)) - notification Business NAICS classification: GENERAL AUTOMOTIVE REPAIR. Organizations: GEORGE BOUKATHER (CONTACT/OWNER)
Alternative names: HI-TECH COLLISION & GLASS CENTERS, INC., HI TECH COLLISION & PAINTING
MARK TWAIN SPECIAL CENTER (11802 LOARA ST. in GARDEN GROVE, CA)
(Geographic Names Information System) (National Center for Education Statistics) - STATE ID-6028633 Organizations: GARDEN GROVE UNIFIED (SCHOOL DISTRICT)
JULIES DRYCLEANER (12904 HARBOR BOULEVARD in GARDEN GROVE, CA)
STATE MASTER (California - Hazardous Waste Tracking) - HAZARDOU WASTE PROGRAM Small Quantity Generators, between 100 kg and 1000 kg of hazardous waste/month (Resource Conservation and Recovery Act (tracking hazardous waste)) - notification Organizations: THOMAS A DE PIPPO (CONTACT/OWNER)
G AND S TRANSMISSION (10422 STANFORD AVENUE in GARDEN GROVE, CA)
STATE MASTER (California - Hazardous Waste Tracking) - HAZARDOU WASTE PROGRAM Small Quantity Generators, between 100 kg and 1000 kg of hazardous waste/month (Resource Conservation and Recovery Act (tracking hazardous waste)) - notification Organizations: DAVID AND MARK SOSEBEE (CONTACT/OWNER)
ACE MACHINERY AND REPAIR (10372 STANFORD AVE in GARDEN GROVE, CA)
STATE MASTER (California - Hazardous Waste Tracking) - HAZARDOU WASTE PROGRAM Small Quantity Generators, between 100 kg and 1000 kg of hazardous waste/month (Resource Conservation and Recovery Act (tracking hazardous waste)) - notification Organizations: JAN DUNN (CONTACT/OWNER)
AGNES WARE STANLEY ELEMENTARY SCHOOL (12201 ELMWOOD AVE in GARDEN GROVE, CA)
(Geographic Names Information System) (National Center for Education Statistics) - STATE ID-6028229 Organizations: GARDEN GROVE UNIFIED (SCHOOL DISTRICT)
Alternative names: STANLEY (AGNES WARE) ELEMENTARY
LEGRANDOS CLEANERS (10084 CHAPMAN AVE in GARDEN GROVE, CA)
STATE MASTER (California - Hazardous Waste Tracking) - HAZARDOU WASTE PROGRAM Small Quantity Generators, between 100 kg and 1000 kg of hazardous waste/month (Resource Conservation and Recovery Act (tracking hazardous waste)) Alternative names: LEGRANDS CLEANERS
EVANS (ETHEL M.) ELEMENTARY (12281 NELSON ST. in GARDEN GROVE, CA)
(National Center for Education Statistics) - STATE ID-6028377 Organizations: GARDEN GROVE UNIFIED (SCHOOL DISTRICT)
Housing units lacking complete plumbing facilities: 0.5% Housing units lacking complete kitchen facilities: 3.5%
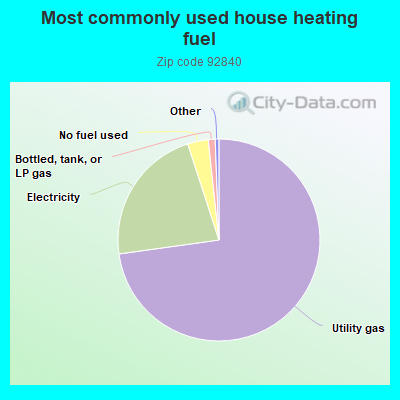
72.8%Utility gas
22.2%Electricity
3.3%No fuel used
1.1%Bottled, tank, or LP gas
Place of birth for U.S.-born residents:
This state: 27,571
Northeast: 820
Midwest: 972
South: 828
West: 677
52% of the 92840 zip code residents lived in the same house 5 years ago. Out of people who lived in different houses, 83% lived in this county. Out of people who lived in different counties, 50% lived in California.
93% of the 92840 zip code residents lived in the same house 1 year ago. Out of people who lived in different houses, 66% moved from this county. Out of people who lived in different houses, 22% moved from different county within same state. Out of people who lived in different houses, 7% moved from different state. Out of people who lived in different houses, 7% moved from abroad.
Private vs. public school enrollment:
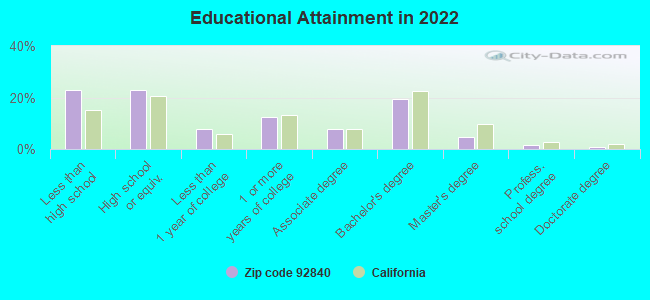
Students in private schools in grades 1 to 8 (elementary and middle school): 424
Here:
8.5%
California:
10.5%
Students in private schools in grades 9 to 12 (high school): 141
Here:
4.7%
California:
8.5%
Students in private undergraduate colleges: 421
Here:
11.0%
California:
15.9%
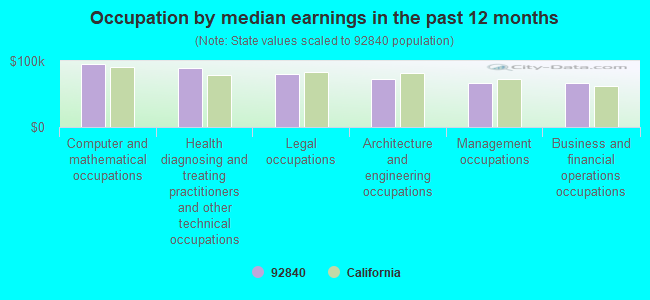
Occupation by median earnings in the past 12 months ($)
94,871Computer and mathematical occupations
88,900Health diagnosing and treating practitioners and other technical occupations
79,851Legal occupations
71,980Architecture and engineering occupations
67,406Management occupations
66,298Business and financial operations occupations
Companies with federal contracts located in this zip code:
HILTON GARDEN INN (11777 HARBOR BLVD in GARDEN GROVE, CA)
$104,880 with Navy for Maintenance, Repair or Alteration of Real Property -- Troop Housing Facilities. Taking place in NY. Signed on 2005-05-17. Completion date: 2005-06-02.
ACTS AUTOMATION INC (12912 HASTER ST in GARDEN GROVE, CA; small business) : $45,136 in 6 contractsfrom 2003 to 2005
Contracts for Automated Information System Design and Integration Services, ADP Software by Army, U.S. Army Corps of Engineers - civil program financing only Signed by year:2000: $0; 2001: $0; 2002: $0; 2003: $15,112; 2004: $15,112; 2005: $14,912; 2006: $0.
Biggest contracts:
$7,556 with Army for Automated Information System Design and Integration Services. Taking place in AL. Signed on 2003-12-12. Completion date: 2004-09-30.
$7,556 with U.S. Army Corps of Engineers - civil program financing only for Automated Information System Design and Integration Services. Taking place in AL. Signed on 2003-12-12. Completion date: 2004-09-30.
$7,556 with Army for ADP Software. Signed on 2004-08-27. Completion date: 2005-09-30.
$7,556 with U.S. Army Corps of Engineers - civil program financing only for ADP Software. Signed on 2004-08-27. Completion date: 2005-09-30.
CRYSTAL CATHEDRAL MINISTRIES (13280 CHAPMAN AVE in GARDEN GROVE, CA)
$3,735 with Navy for Other Social Services. Signed on 2005-08-01. Completion date: 2005-09-11.
Top industries in this zip code by the number of employees in 2005:
Other Services (except Public Administration): Religious Organizations (250-499 employees: 2 establishments, 20-49 employees: 4 establishments, 5-9 employees: 4 establishments, 1-4 employees: 10 establishments)
Accommodation and Food Services: Hotels (except Casino Hotels) and Motels (100-249: 4, 50-99: 1, 10-19: 1, 5-9: 1, 1-4: 2)
2005 - 2018 National Fire Incident Reporting System (NFIRS) incidents
According to the data from the years 2005 - 2018 the average number of fire incidents per year is 38. The highest number of fire incidents - 91 took place in 2007, and the least - 0 in 2014. The data has a decreasing trend.
When looking into fire subcategories, the most incidents belonged to: Outside Fires (39.6%), and Structure Fires (31.3%).
Fire incident types reported to NFIRS in Zip Code 92840


 Nearest zip codes: 92802, 92843, 92844, 92703, 92841, 92805.


 According to the data from the years 2005 - 2018 the average number of fire incidents per year is 38. The highest number of fire incidents - 91 took place in 2007, and the least - 0 in 2014. The data has a decreasing trend.
 When looking into fire subcategories, the most incidents belonged to: Outside Fires (39.6%), and Structure Fires (31.3%).