Estimated zip code population in 2022: 33,904 Zip code population in 2010: 32,845 Zip code population in 2000: 31,427
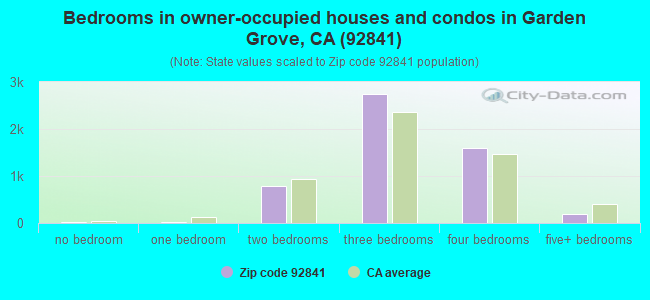
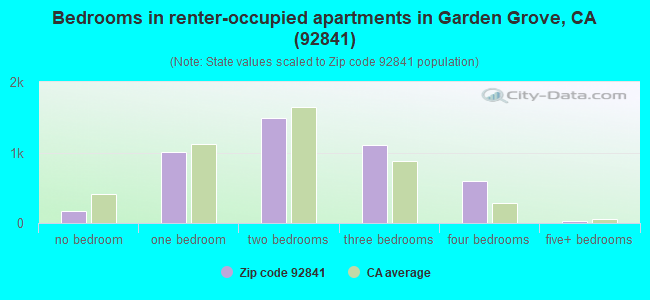
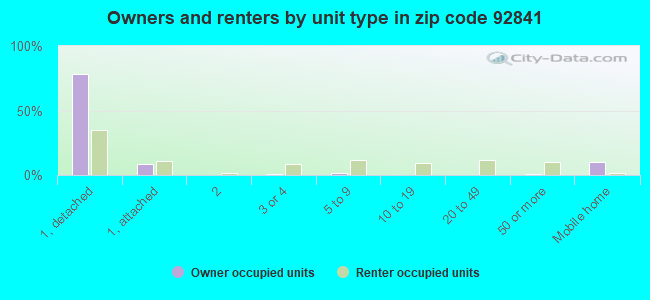
Houses and condos: 9,944 Renter-occupied apartments: 4,403
% of renters here:
45%
State:
44%
March 2022 cost of living index in zip code 92841: 88.4 (less than average, U.S. average is 100)
Land area: 4.5 sq. mi. Water area: 0.0 sq. mi.
Population density: 7,566 people per square mile
(high).
OSM Map
General Map
Google Map
MSN Map
OSM Map
General Map
Google Map
MSN Map
OSM Map
General Map
Google Map
MSN Map
OSM Map
General Map
Google Map
MSN Map
Please wait while loading the map...
Real estate property taxes paid for housing units in 2022:
This zip code:
0.6% ($4,796)
California:
0.7% ($4,831)
Median real estate property taxes paid for housing units with mortgages in 2022: $5,155 (0.7%) Median real estate property taxes paid for housing units with no mortgage in 2022: $4,261 (0.6%)
Estimated median house/condo value in 2022: $766,935
92841:
$766,935
California:
$715,900
According to our research of California and other state lists, there were 28 registered sex offenders living in 92841 zip code as of April 27, 2024. The ratio of all residents to sex offenders in zip code 92841 is 1,233 to 1. The ratio of registered sex offenders to all residents in this zip code is lower than the state average.
Median resident age:
This zip code:
40.5 years
California median age:
37.9 years
Average household size:
This zip code:
3.4 people
California:
2.8 people
Averages for the 2020 tax year for zip code 92841, filed in 2021:
Average Adjusted Gross Income (AGI) in 2020: $50,655 (Individual Income Tax Returns)
Here:
$50,655
State:
$95,910
Salary/wage: $45,016 (reported on 80.0% of returns)
Here:
$45,016
State:
$77,331
(% of AGI for various income ranges: 1107.4% for AGIs below $25k, 3968.1% for AGIs $25k-50k, 7697.6% for AGIs $50k-75k, 11023.5% for AGIs $75k-100k, 20264.3% for AGIs $100k-200k, 86025.0% for AGIs over 200k)
Taxable interest for individuals: $1,044 (reported on 24.8% of returns)
This zip code:
$1,044
California:
$2,294
(% of AGI for various income ranges: 10.2% for AGIs below $25k, 16.1% for AGIs $25k-50k, 33.6% for AGIs $50k-75k, 60.6% for AGIs $75k-100k, 150.5% for AGIs $100k-200k, 1561.2% for AGIs over 200k)
Ordinary dividends: $3,251 (reported on 11.0% of returns)
Here:
$3,251
State:
$10,949
(% of AGI for various income ranges: 7.0% for AGIs below $25k, 12.0% for AGIs $25k-50k, 33.9% for AGIs $50k-75k, 76.1% for AGIs $75k-100k, 150.2% for AGIs $100k-200k, 3887.5% for AGIs over 200k)
Net capital gain/loss in AGI: +$14,589 (reported on 13.8% of returns)
Here:
+$14,589
State:
+$49,306
(% of AGI for various income ranges: 3.7% for AGIs below $25k, 16.2% for AGIs $25k-50k, 95.6% for AGIs $50k-75k, 169.9% for AGIs $75k-100k, 611.4% for AGIs $100k-200k, 32697.5% for AGIs over 200k)
Profit/loss from business: +$7,336 (reported on 21.3% of returns)
Here:
+$7,336
State:
+$15,671
(% of AGI for various income ranges: 215.6% for AGIs below $25k, 215.5% for AGIs $25k-50k, 220.1% for AGIs $50k-75k, 212.6% for AGIs $75k-100k, 534.0% for AGIs $100k-200k, 1188.8% for AGIs over 200k)
Taxable individual retirement arrangement distribution: $16,067 (reported on 3.7% of returns)
92841:
$16,067
California:
$23,505
(% of AGI for various income ranges: 25.1% for AGIs below $25k, 31.7% for AGIs $25k-50k, 84.2% for AGIs $50k-75k, 195.5% for AGIs $75k-100k, 495.7% for AGIs $100k-200k, 1503.8% for AGIs over 200k)
Total itemized deductions: $29,058 (reported on 9.1% of returns)
Here:
$29,058
State:
$39,517
(% of AGI for various income ranges: 46.5% for AGIs below $25k, 158.2% for AGIs $25k-50k, 411.0% for AGIs $50k-75k, 916.2% for AGIs $75k-100k, 2104.8% for AGIs $100k-200k, 9593.8% for AGIs over 200k)
Charity contributions: $4,995 (reported on 7.5% of returns)
Here:
$4,995
State:
$12,598
(% of AGI for various income ranges: 2.2% for AGIs below $25k, 14.4% for AGIs $25k-50k, 48.1% for AGIs $50k-75k, 101.9% for AGIs $75k-100k, 339.3% for AGIs $100k-200k, 1960.0% for AGIs over 200k)
Taxes paid: $8,481 (reported on 9.1% of returns)
92841:
$8,481
State:
$8,807
(% of AGI for various income ranges: 13.1% for AGIs below $25k, 42.3% for AGIs $25k-50k, 126.2% for AGIs $50k-75k, 296.4% for AGIs $75k-100k, 644.0% for AGIs $100k-200k, 2283.8% for AGIs over 200k)
Earned income credit: $1,857 (reported on 19.8% of returns)
Here:
$1,857
State:
$2,074
(% of AGI for various income ranges: 87.7% for AGIs below $25k, 74.6% for AGIs $25k-50k, 1.0% for AGIs $50k-75k)
Percentage of individuals using paid preparers for their 2020 taxes: 92.8%
Here:
93%
State:
92%
(% for various income ranges: 91.6% for AGIs below $25k, 93.1% for AGIs $25k-50k, 94.1% for AGIs $50k-75k, 94.4% for AGIs $75k-100k, 93.9% for AGIs $100k-200k, 91.7% for AGIs over 200k)
Averages for the 2012 tax year for zip code 92841, filed in 2013:
Average Adjusted Gross Income (AGI) in 2012: $42,121 (Individual Income Tax Returns)
Here:
$42,121
State:
$72,726
Salary/wage: $39,692 (reported on 81.7% of returns)
Here:
$39,692
State:
$59,079
(% of AGI for various income ranges: 72.3% for AGIs below $25k, 84.6% for AGIs $25k-50k, 83.1% for AGIs $50k-75k, 82.7% for AGIs $75k-100k, 79.0% for AGIs $100k-200k, 42.7% for AGIs over 200k)
Taxable interest for individuals: $806 (reported on 26.7% of returns)
This zip code:
$806
California:
$2,146
(% of AGI for various income ranges: 0.6% for AGIs below $25k, 0.3% for AGIs $25k-50k, 0.4% for AGIs $50k-75k, 0.4% for AGIs $75k-100k, 0.5% for AGIs $100k-200k, 1.1% for AGIs over 200k)
Ordinary dividends: $2,633 (reported on 9.6% of returns)
Here:
$2,633
State:
$9,308
(% of AGI for various income ranges: 0.5% for AGIs below $25k, 0.3% for AGIs $25k-50k, 0.6% for AGIs $50k-75k, 0.6% for AGIs $75k-100k, 0.8% for AGIs $100k-200k, 0.9% for AGIs over 200k)
Net capital gain/loss in AGI: +$2,079 (reported on 9.4% of returns)
Here:
+$2,079
State:
+$30,460
(% of AGI for various income ranges: 0.3% for AGIs $75k-100k, 0.9% for AGIs $100k-200k, 3.0% for AGIs over 200k)
Profit/loss from business: +$11,089 (reported on 20.6% of returns)
Here:
+$11,089
State:
+$17,064
(% of AGI for various income ranges: 17.4% for AGIs below $25k, 5.9% for AGIs $25k-50k, 3.5% for AGIs $50k-75k, 1.8% for AGIs $75k-100k, 2.2% for AGIs $100k-200k, 3.6% for AGIs over 200k)
Taxable individual retirement arrangement distribution: $14,191 (reported on 5.5% of returns)
92841:
$14,191
California:
$19,557
(% of AGI for various income ranges: 1.3% for AGIs below $25k, 1.2% for AGIs $25k-50k, 1.8% for AGIs $50k-75k, 1.9% for AGIs $75k-100k, 2.8% for AGIs $100k-200k, 2.0% for AGIs over 200k)
Self-employment retirement plans: $12,267 (reported on 0.2% of returns)
92841:
$12,267
California:
$24,530
Total itemized deductions: $23,527 (28% of AGI, reported on 27.4% of returns)
Here:
$23,527
State:
$34,004
Here:
27.9% of AGI
State:
22.7% of AGI
(% of AGI for various income ranges: 7.5% for AGIs below $25k, 12.0% for AGIs $25k-50k, 16.8% for AGIs $50k-75k, 18.9% for AGIs $75k-100k, 19.5% for AGIs $100k-200k, 16.4% for AGIs over 200k)
Charity contributions: $2,756 (reported on 22.4% of returns)
Here:
$2,756
State:
$4,659
(% of AGI for various income ranges: 0.4% for AGIs below $25k, 0.9% for AGIs $25k-50k, 1.5% for AGIs $50k-75k, 1.9% for AGIs $75k-100k, 2.0% for AGIs $100k-200k, 2.2% for AGIs over 200k)
Taxes paid: $7,620 (reported on 27.2% of returns)
92841:
$7,620
State:
$14,448
(% of AGI for various income ranges: 1.5% for AGIs below $25k, 2.9% for AGIs $25k-50k, 4.5% for AGIs $50k-75k, 5.8% for AGIs $75k-100k, 7.3% for AGIs $100k-200k, 8.4% for AGIs over 200k)
Earned income credit: $2,199 (reported on 25.7% of returns)
Here:
$2,199
State:
$2,286
(% of AGI for various income ranges: 7.5% for AGIs below $25k, 1.4% for AGIs $25k-50k)
Percentage of individuals using paid preparers for their 2012 taxes: 73.0%
Here:
73%
State:
64%
(% for various income ranges: 72.5% for AGIs below $25k, 73.0% for AGIs $25k-50k, 73.2% for AGIs $50k-75k, 75.3% for AGIs $75k-100k, 72.6% for AGIs $100k-200k, 85.7% for AGIs over 200k)
Averages for the 2004 tax year for zip code 92841, filed in 2005:
Average Adjusted Gross Income (AGI) in 2004: $36,822 (Individual Income Tax Returns)
Here:
$36,822
State:
$58,600
Salary/wage: $35,008 (reported on 84.2% of returns)
Here:
$35,008
State:
$49,455
(% of AGI for various income ranges: 107.5% for AGIs below $10k, 79.3% for AGIs $10k-25k, 86.2% for AGIs $25k-50k, 84.7% for AGIs $50k-75k, 82.9% for AGIs $75k-100k, 65.4% for AGIs over 100k)
Taxable interest for individuals: $1,051 (reported on 37.5% of returns)
This zip code:
$1,051
California:
$2,365
(% of AGI for various income ranges: 4.4% for AGIs below $10k, 1.0% for AGIs $10k-25k, 0.8% for AGIs $25k-50k, 1.0% for AGIs $50k-75k, 0.9% for AGIs $75k-100k, 1.3% for AGIs over 100k)
Taxable dividends: $1,680 (reported on 12.0% of returns)
Here:
$1,680
State:
$4,746
(% of AGI for various income ranges: 1.6% for AGIs below $10k, 0.6% for AGIs $10k-25k, 0.4% for AGIs $25k-50k, 0.5% for AGIs $50k-75k, 0.6% for AGIs $75k-100k, 0.6% for AGIs over 100k)
Net capital gain/loss: +$6,533 (reported on 11.9% of returns)
Here:
+$6,533
State:
+$23,418
(% of AGI for various income ranges: -0.9% for AGIs below $10k, -0.2% for AGIs $10k-25k, -0.1% for AGIs $25k-50k, 0.6% for AGIs $50k-75k, 1.1% for AGIs $75k-100k, 8.2% for AGIs over 100k)
Profit/loss from business: +$11,125 (reported on 18.9% of returns)
Here:
+$11,125
State:
+$16,826
(% of AGI for various income ranges: 27.8% for AGIs below $10k, 10.9% for AGIs $10k-25k, 4.8% for AGIs $25k-50k, 3.4% for AGIs $50k-75k, 3.8% for AGIs $75k-100k, 5.1% for AGIs over 100k)
IRA payment deduction: $3,154 (reported on 2.0% of returns)
92841:
$3,154
California:
$3,192
(% of AGI for various income ranges: 0.1% for AGIs $10k-25k, 0.2% for AGIs $25k-50k, 0.2% for AGIs $50k-75k, 0.2% for AGIs $75k-100k, 0.2% for AGIs over 100k)
Self-employed pension: $9,167 (reported on 0.3% of returns)
Here:
$9,167
California:
$17,688
(% of AGI for various income ranges: 0.1% for AGIs $50k-75k, 0.2% for AGIs $75k-100k, 0.2% for AGIs over 100k)
Total itemized deductions: $21,050 (31% of AGI, reported on 32.1% of returns)
Here:
$21,050
State:
$28,113
Here:
31.2% of AGI
State:
25.3% of AGI
(% of AGI for various income ranges: 14.4% for AGIs below $10k, 10.3% for AGIs $10k-25k, 16.1% for AGIs $25k-50k, 21.3% for AGIs $50k-75k, 22.7% for AGIs $75k-100k, 20.6% for AGIs over 100k)
Charity contributions deductions: $2,424 (3% of AGI, reported on 26.9% of returns)
Here:
$2,424
State:
$3,923
Here:
3.4% of AGI
State:
3.3% of AGI
(% of AGI for various income ranges: 0.5% for AGIs below $10k, 0.8% for AGIs $10k-25k, 1.4% for AGIs $25k-50k, 2.3% for AGIs $50k-75k, 2.3% for AGIs $75k-100k, 2.1% for AGIs over 100k)
Total tax: $4,493 (reported on 71.8% of returns)
92841:
$4,493
State:
$10,761
(% of AGI for various income ranges: 6.1% for AGIs below $10k, 4.2% for AGIs $10k-25k, 6.0% for AGIs $25k-50k, 7.8% for AGIs $50k-75k, 9.3% for AGIs $75k-100k, 15.4% for AGIs over 100k)
Earned income credit: $1,760 (reported on 21.3% of returns)
Here:
$1,760
State:
$1,763
Percentage of individuals using paid preparers for their 2004 taxes: 69.5%
Here:
69%
State:
66%
(% for various income ranges: 61.9% for AGIs below $10k, 70.4% for AGIs $10k-25k, 69.6% for AGIs $25k-50k, 74.4% for AGIs $50k-75k, 73.6% for AGIs $75k-100k, 75.6% for AGIs over 100k)
Likely homosexual households (counted as self-reported same-sex unmarried-partner households)
Lesbian couples: 0.2% of all households
Gay men: 0.0% of all households
Household received Food Stamps/SNAP in the past 12 months: 1,943 Household did not receive Food Stamps/SNAP in the past 12 months: 7,972
Women who had a birth in the past 12 months: 389 (230 now married, 160 unmarried) Women who did not have a birth in the past 12 months: 7,415 (2,716 now married, 4,708 unmarried)
Housing units in zip code 92841 with a mortgage: 3,037 (196 second mortgage, 11 home equity loan, 131 both second mortgage and home equity loan) Houses without a mortgage: 62
Median monthly owner costs for units with a mortgage: $2,487 Median monthly owner costs for units without a mortgage: $690
Residents with income below the poverty level in 2022:
This zip code:
14.9%
Whole state:
12.2%
Residents with income below 50% of the poverty level in 2022:
This zip code:
6.6%
Whole state:
6.2%
Median number of rooms in houses and condos:
Here:
5.7
State:
6.0
Median number of rooms in apartments:
Here:
4.1
State:
3.9
Notable locations in this zip code not listed on our city pages
Notable locations in zip code 92841: Chapman Branch Orange County Public Library (A), Garden Grove Fire Department Station 5 (B), Garden Grove Fire Department Station 2 (C). Display/hide their locations on the map
Churches in zip code 92841 include: Brazilian Evangelical Church (A), Garden Grove Friends Church (B), Glory Korean Methodist Church (C), Lien Hoa Temple (D), Our Redeemer Lutheran Church (E), Rejoice Community Church (F). Display/hide their locations on the map
Parks in zip code 92841 include: Gutosky Park (1), Magnolia Park (2), Chapman Sports Park (3), Hare School Park (4). Display/hide their locations on the map
3,697 married couples with children.
1,886 single-parent households (700 men, 1,186 women).
30.3% of residents of 92841 zip code speak English at home.
24.9% of residents speak Spanish at home (60% very well, 19% well, 15% not well, 6% not at all).
1.0% of residents speak other Indo-European language at home (53% very well, 31% well, 16% not well).
42.5% of residents speak Asian or Pacific Island language at home (37% very well, 27% well, 30% not well, 6% not at all).
0.9% of residents speak other language at home (72% very well, 25% well, 3% not well).
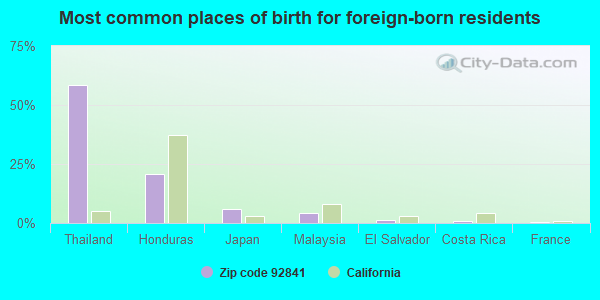
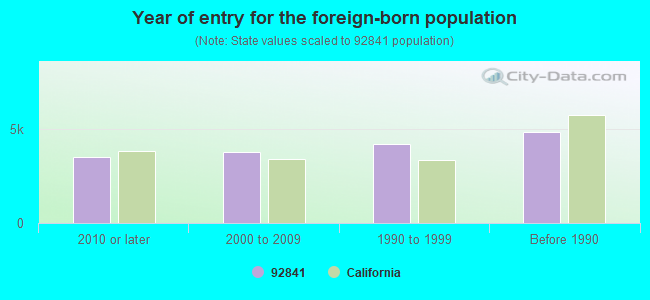
Foreign born population: 15,888 (46.9%) (67.8% of them are naturalized citizens)
Major facilities with environmental interests located in this zip code:
CALSCIENCE ENVIRONMENTAL LABORATORIES INCORPORATED (7440 LINCOLN WAY in GARDEN GROVE, CA)
STATE MASTER (California - Hazardous Waste Tracking) - HAZARDOU WASTE PROGRAM (Integrated Compliance Information System) - ICIS-09-2003-0096, FORMAL ENFORCEMENT ACTION HAZARDOUS WASTE BIENNIAL REPORTER (Resource Conservation and Recovery Act (tracking hazardous waste)) Large Quantity Generators, more that 1000 kg of hazardous waste/month (Resource Conservation and Recovery Act (tracking hazardous waste)) - notification Organizations: CALSCIENCE ENGINEERING (CONTACT/OWNER)
Alternative names: CALSCIENCE ENV LABS INC, CALSCIENCE ENVIRONMENTAL LABORATORIES, I
GRAPHIC PACKAGING CORPORATION (7340 LAMPSON AVENUE in GARDEN GROVE, CA)
AIR MAJOR (AIRS/AFS) STATE MASTER (California - Hazardous Waste Tracking) - HAZARDOU WASTE PROGRAM CRITERIA AND HAZARDOUS AIR POLLUTANT INVENTORY (Inventory of air pollution sources) HAZARDOUS WASTE BIENNIAL REPORTER (Resource Conservation and Recovery Act (tracking hazardous waste)) Large Quantity Generators, more that 1000 kg of hazardous waste/month (Resource Conservation and Recovery Act (tracking hazardous waste)) TRI REPORTER (Tracking of toxic chemicals releasing facilities) Business SIC classification: CORRUGATED AND SOLID FIBER BOXES; FOLDING PAPERBOARD BOXES, INCLUDING SANITARY; PETROLEUM BULK STATIONS AND TERMINALS Business NAICS classification: FOLDING PAPERBOARD BOX MANUFACTURING. Organizations: GRAPHIC PACKAGING INTERNATIONAL, INC. (CONTACT/OPERATOR)
Alternative names: GRAPHIC PACKAGING CORP/ FORT JAMES OPR C, GRAPHIC PACKAGING INTERNATIONAL INC., JAMES RIVER CORP, SOUTHERN CALIFORNIA CARTON
ELASCO INCORPORATED (11377 MARKON DR in GARDEN GROVE, CA)
STATE MASTER (California - Hazardous Waste Tracking) - HAZARDOU WASTE PROGRAM HAZARDOUS WASTE BIENNIAL REPORTER (Resource Conservation and Recovery Act (tracking hazardous waste)) Small Quantity Generators, between 100 kg and 1000 kg of hazardous waste/month (Resource Conservation and Recovery Act (tracking hazardous waste)) - notification TRI REPORTER (Tracking of toxic chemicals releasing facilities) Business SIC classification: PLASTICS MATERIALS, SYNTHETIC RESINS, AND NONVULCANIZABLE ELASTOMERS; ADHESIVES AND SEALANTS Business NAICS classification: PLASTICS MATERIAL AND RESIN MANUFACTURING.
CALIFORNIA SHIRT PRINT INC (12221 MONARCH ST in GARDEN GROVE, CA)
STATE MASTER (California - Hazardous Waste Tracking) - HAZARDOU WASTE PROGRAM CRITERIA AND HAZARDOUS AIR POLLUTANT INVENTORY (Inventory of air pollution sources) Small Quantity Generators, between 100 kg and 1000 kg of hazardous waste/month (Resource Conservation and Recovery Act (tracking hazardous waste)) - notification Business SIC classification: COMMERCIAL PRINTING Organizations: GULU WATUMULL (CONTACT/OWNER)
Alternative names: CALIFORNIA SHIRT PRINTER INC
AARON THOMAS COMPANY INCORPORATED (7390 HUNT AVENUE in GARDEN GROVE, CA)
STATE MASTER (California - Hazardous Waste Tracking) - HAZARDOU WASTE PROGRAM Small Quantity Generators, between 100 kg and 1000 kg of hazardous waste/month (Resource Conservation and Recovery Act (tracking hazardous waste)) - notification Business NAICS classification: ALL OTHER BUSINESS SUPPORT SERVICES. Organizations: BACON & CHONG (CONTACT/OWNER)
LEINER HEALTH PRODUCTS (7366 ORANGEWOOD AVE in GARDEN GROVE, CA)
STATE MASTER (California - Hazardous Waste Tracking) - HAZARDOU WASTE PROGRAM CRITERIA AND HAZARDOUS AIR POLLUTANT INVENTORY (Inventory of air pollution sources) Small Quantity Generators, between 100 kg and 1000 kg of hazardous waste/month (Resource Conservation and Recovery Act (tracking hazardous waste)) - notification Business SIC classification: NONCLASSIFIABLE ESTABLISHMENTS
AAMCO TRANSMISSION (7571 CHAPMAN AVENUE in GARDEN GROVE, CA)
STATE MASTER (California - Hazardous Waste Tracking) - HAZARDOU WASTE PROGRAM Small Quantity Generators, between 100 kg and 1000 kg of hazardous waste/month (Resource Conservation and Recovery Act (tracking hazardous waste)) - notification Business NAICS classification: AUTOMOTIVE TRANSMISSION REPAIR. Organizations: FRANI LU CO INC (CONTACT/OWNER)
C AND D INTERIORS (7330 LINCOLN WAY in GARDEN GROVE, CA)
STATE MASTER (California - Hazardous Waste Tracking) - HAZARDOU WASTE PROGRAM Small Quantity Generators, between 100 kg and 1000 kg of hazardous waste/month (Resource Conservation and Recovery Act (tracking hazardous waste)) - notification
C AND D AEROSPACE (12472 INDUSTRY STREET in GARDEN GROVE, CA)
STATE MASTER (California - Hazardous Waste Tracking) - HAZARDOU WASTE PROGRAM Small Quantity Generators, between 100 kg and 1000 kg of hazardous waste/month (Resource Conservation and Recovery Act (tracking hazardous waste)) - notification
NELSON ENGINEERING (11600 MONARCH ST in GARDEN GROVE, CA)
STATE MASTER (California - Hazardous Waste Tracking) - HAZARDOU WASTE PROGRAM Small Quantity Generators, between 100 kg and 1000 kg of hazardous waste/month (Resource Conservation and Recovery Act (tracking hazardous waste)) - notification
GOODWIN CO. (12361 MONARCH STREET in GARDEN GROVE, CA)
COMPLIANCE ACTIVITY (Tracking inspections of insecticide, fungicide, and rodenticide, and toxic substances) CRITERIA AND HAZARDOUS AIR POLLUTANT INVENTORY (Inventory of air pollution sources) Large Quantity Generators, more that 1000 kg of hazardous waste/month (Resource Conservation and Recovery Act (tracking hazardous waste)) - notification TRI REPORTER (Tracking of toxic chemicals releasing facilities) Business SIC classification: SOAP AND OTHER DETERGENTS, EXCEPT SPECIALTY CLEANERS Business NAICS classification: SOAP AND OTHER DETERGENT MANUFACTURING. Alternative names: GOODWIN CO C O CLOROX, GOODWIN CO C O CLOROX
GRAPHIC RESOURCES CORP (12311 INDUSTRY STREET in GARDEN GROVE, CA)
STATE MASTER (California - Hazardous Waste Tracking) - HAZARDOU WASTE PROGRAM Small Quantity Generators, between 100 kg and 1000 kg of hazardous waste/month (Resource Conservation and Recovery Act (tracking hazardous waste))
GREEN TWEED AND COMPANY INC (7101 PATTERSON DRIVE in GARDEN GROVE, CA)
STATE MASTER (California - Hazardous Waste Tracking) - HAZARDOU WASTE PROGRAM Small Quantity Generators, between 100 kg and 1000 kg of hazardous waste/month (Resource Conservation and Recovery Act (tracking hazardous waste)) - notification Organizations: GREENE TWEED AND CO INC (CONTACT/OWNER)
Alternative names: ALPS ELECTRIC (USA), INC, GREENE TWEED AND CO INC
Housing units lacking complete plumbing facilities: 0.4% Housing units lacking complete kitchen facilities: 3.3%
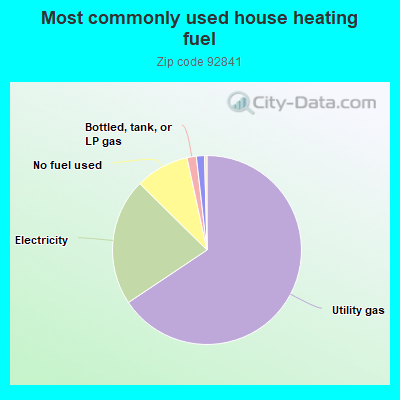
65.7%Utility gas
21.8%Electricity
9.2%No fuel used
1.6%Bottled, tank, or LP gas
1.4%Solar energy
Place of birth for U.S.-born residents:
This state: 15,702
Northeast: 556
Midwest: 511
South: 552
West: 414
53% of the 92841 zip code residents lived in the same house 5 years ago. Out of people who lived in different houses, 82% lived in this county. Out of people who lived in different counties, 50% lived in California.
94% of the 92841 zip code residents lived in the same house 1 year ago. Out of people who lived in different houses, 69% moved from this county. Out of people who lived in different houses, 18% moved from different county within same state. Out of people who lived in different houses, 4% moved from different state. Out of people who lived in different houses, 12% moved from abroad.
Private vs. public school enrollment:
Students in private schools in grades 1 to 8 (elementary and middle school): 177
Here:
5.3%
California:
10.5%
Students in private schools in grades 9 to 12 (high school): 44
Here:
2.4%
California:
8.5%
Students in private undergraduate colleges: 114
Here:
4.6%
California:
15.9%
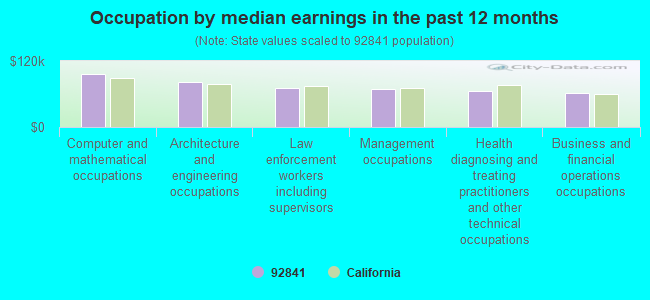
Occupation by median earnings in the past 12 months ($)
96,194Computer and mathematical occupations
81,817Architecture and engineering occupations
71,073Law enforcement workers including supervisors
69,594Management occupations
66,083Health diagnosing and treating practitioners and other technical occupations
61,988Business and financial operations occupations
Companies with biggest federal contracts located in this zip code (GARDEN GROVE, CA):
GKN AEROSPACE TRANSPARENCY SYS (12122 WESTERN AVE; small business) : $40,576,036 in 191 contractsfrom 1999 to 2006
Contracts for Airframe Structural Components, Aircraft Propellers and Components, Miscellaneous Aircraft Accessories and Components, Helicopter Rotor Blades, Drive Mechanisms and Components, and moreby Defense Logistics Agency, Navy, Air Force, Army, and others Signed by year:2000: $6,940,402; 2001: $5,728,292; 2002: $12,328,958; 2003: $5,400,966; 2004: $1,578,051; 2005: $5,434,087; 2006: $1,824,416.
Biggest contracts:
$1,836,900 with Defense Logistics Agency for Airframe Structural Components. Signed on 2000-09-06. Completion date: 2001-07-18.
$1,810,369, same as above.Signed on 2002-04-08. Completion date: 2003-02-02.
$1,280,000 with Navy for Airframe Structural Components. Signed on 2003-04-02. Completion date: 2004-04-26.
$1,260,000, same as above.Signed on 2003-04-02. Completion date: 2004-05-26.
KOR ELECTRONICS, INC (11958 MONARCH STREET; small business) : $29,132,370 in 72 contractsfrom 1999 to 2006
Contracts for Miscellaneous Items, Electronic Countermeasures, Counter-Countermeasures and Quick Reaction Capability Equipment, Antennas, Waveguides, and Related Equipment, Laboratory Equipment and Supplies, and moreby Air Force, Navy, Army Signed by year:2000: $335,000; 2001: $3,750,852; 2002: $3,136,463; 2003: $5,159,997; 2004: $7,853,668; 2005: $6,656,283; 2006: $2,072,607.
Biggest contracts:
$2,395,000 with Air Force for Miscellaneous Items. Signed on 2004-08-17. Completion date: 2006-02-20.
$2,377,535 with Navy for Electronic Countermeasures, Counter-Countermeasures and Quick Reaction Capability Equipment. Signed on 2003-06-23. Completion date: 2009-03-30.
$2,300,130, same as above.Signed on 2005-03-07. Completion date: 2006-06-30.
$1,630,200, same as above.Signed on 2004-03-30. Completion date: 2005-10-30.
MCCOMBS-WALL, INC (12634 HOOVER STREET; small business) : $3,616,431 in 14 contractsfrom 2000 to 2005
Contracts for Conveyors, Engineering and Technical Services, Maintenance, Repair and Rebuilding of Equipment -- Materials Handling Equipment, Miscellaneous Items by Defense Logistics Agency, Navy, Army, Bureau of Land Management, and others Signed by year:2000: $1,938,166; 2001: $719,039; 2002: $585,044; 2003: $0; 2004: $397,730; 2005: -$23,548; 2006: $0.
Biggest contracts:
$1,938,166 with Defense Logistics Agency for Conveyors. Signed on 2000-04-06. Completion date: 2001-01-31.
$516,144 with Navy for Conveyors. Signed on 2002-09-26. Completion date: 2003-01-13.
$366,812 with Defense Logistics Agency for Conveyors. Taking place in OK. Signed on 2001-09-21. Completion date: 2002-03-23.
$320,227 with Defense Logistics Agency for Conveyors. Signed on 2001-04-06. Completion date: 2001-07-31.
UMPCO INC (7100 LAMPSON AVE; small business) 100 employees, $0 revenue. : $2,119,087 in 145 contractsfrom 2000 to 2006
Contracts for Hardware, Commercial, Engine Electrical System Components, Aircraft Prime Moving, Fans, Air Circulators, and Blower Equipment, Sawmill and Planing Mill Machinery, and moreby Defense Logistics Agency, Air Force, U.S. Army Corps of Engineers - civil program financing only, Army, and others Signed by year:2000: $57,395; 2001: $208,618; 2002: $28,800; 2003: $102; 2004: $143,015; 2005: $1,384,854; 2006: $296,303.
Biggest contracts:
$284,550 with Defense Logistics Agency for Hardware, Commercial. Signed on 2005-01-13. Completion date: 2005-05-13.
$215,142 with Air Force for Hardware, Commercial. Signed on 2005-09-27. Completion date: 2006-06-02.
$189,700 with Defense Logistics Agency for Hardware, Commercial. Signed on 2005-01-13. Completion date: 2005-05-13.
$98,055 with Air Force for Hardware, Commercial. Signed on 2005-09-28. Completion date: 2006-02-28.
SAINT-GOBAIN PERFORMANCE PLAST (7301 ORANGEWOOD AVE) : $1,231,787 in 89 contractsfrom 2004 to 2006
Contracts for Packing and Gasket Materials by Defense Logistics Agency Signed by year:2000: $0; 2001: $0; 2002: $0; 2003: $0; 2004: $568,238; 2005: $499,079; 2006: $164,470.
Biggest contracts:
$81,950 with Defense Logistics Agency for Packing and Gasket Materials. Signed on 2004-09-01. Completion date: 2004-10-12.
$81,950, same as above.Signed on 2004-09-01. Completion date: 2004-10-12.
$80,846, same as above.Signed on 2004-07-13. Completion date: 2004-10-20.
$75,300, same as above.Signed on 2004-12-06. Completion date: 2005-02-10.
SYNERTECH P/M, INC (11652 MONARCH ST; small business) : $836,794 in 2 contractsfrom 2003 to 2004
$741,149 with Air Force for Defense Missile and Space Systems -- Operational Systems Development (R&D). Signed on 2004-08-27. Completion date: 2006-11-30.
$95,645, same as above.Signed on 2003-06-27. Completion date: 2004-02-27.
SAINT-GOBAIN PERFORMANCE PLAST (7301 ORANGEWOOD AVENUE) : $766,396 in 3 contractsfrom 2001 to 2002
$338,718 with Navy for Packing and Gasket Materials. Signed on 2002-01-18. Completion date: 2002-03-18.
$284,154, same as above.Signed on 2001-12-16. Completion date: 2002-02-28.
$143,524, same as above.Signed on 2001-09-20. Completion date: 2001-11-30.
CALSCIENCE ENVIRONMENTAL LABOR (7440 LINCOLN WAY; small business) : $492,042 in 50 contractsfrom 2002 to 2004
Contracts for Facilities Operations Support Services by Navy Signed by year:2000: $0; 2001: $0; 2002: $88,193; 2003: $101,240; 2004: $302,609; 2005: $0; 2006: $0.
Biggest contracts:
$100,000 with Navy for Facilities Operations Support Services. Signed on 2004-11-18. Completion date: 2005-09-30.
$50,000, same as above.Signed on 2002-08-27. Completion date: 2002-09-30.
$28,000, same as above.Signed on 2004-07-09. Completion date: 2004-05-28.
$25,000, same as above.Signed on 2003-10-23. Completion date: 2003-11-28.
BASIC ELECTRONICS INC (11371 MONARCH ST; small business) : $474,627 in 4 contractsfrom 2000 to 2004
$330,628 with Defense Logistics Agency for Converters, Electrical, Nonrotating. Signed on 2000-08-07. Completion date: 2000-11-05.
$68,043 with Navy for Electrical and Electronic assemblies, Boards, Cards, and Associated Hardware. Signed on 2004-04-15. Completion date: 2004-09-30.
$41,600, same as above.Signed on 2002-09-11. Completion date: 2003-01-10.
$34,356 with Air Force for Cable, Cord, and Wire Assemblies: Communications Equipment. Signed on 2001-01-09. Completion date: 2001-05-11.
AIR INDUSTRIES COMPANY LLC (12570 KNOTT STREET) : $378,926 in 20 contractsfrom 2001 to 2006
Contracts for Bolts, Screws, Rivets by Defense Logistics Agency, Army Signed by year:2000: $0; 2001: $59,193; 2002: $72,875; 2003: $6,335; 2004: $17,817; 2005: $143,926; 2006: $78,780.
Biggest contracts:
$81,329 with Defense Logistics Agency for Bolts. Signed on 2005-07-24. Completion date: 2006-06-23.
$72,875 with Defense Logistics Agency for Screws. Signed on 2002-04-11. Completion date: 2002-09-18.
$70,520 with Defense Logistics Agency for Bolts. Signed on 2006-04-19. Completion date: 2007-06-16.
$30,888 with Defense Logistics Agency for Screws. Signed on 2001-04-24. Completion date: 2001-12-24.
Top industries in this zip code by the number of employees in 2005:
2005 - 2018 National Fire Incident Reporting System (NFIRS) incidents
According to the data from the years 2005 - 2018 the average number of fire incidents per year is 30. The highest number of fire incidents - 64 took place in 2005, and the least - 0 in 2014. The data has a decreasing trend.
When looking into fire subcategories, the most incidents belonged to: Outside Fires (37.0%), and Structure Fires (27.6%).
Fire incident types reported to NFIRS in Zip Code 92841

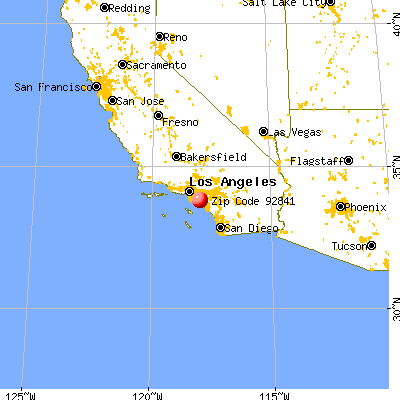


 Nearest zip codes: 90680, 92844, 92804, 92683, 92655, 92845.


 According to the data from the years 2005 - 2018 the average number of fire incidents per year is 30. The highest number of fire incidents - 64 took place in 2005, and the least - 0 in 2014. The data has a decreasing trend.
 When looking into fire subcategories, the most incidents belonged to: Outside Fires (37.0%), and Structure Fires (27.6%).