Estimated zip code population in 2022: 30,843 Zip code population in 2010: 29,945 Zip code population in 2000: 29,679
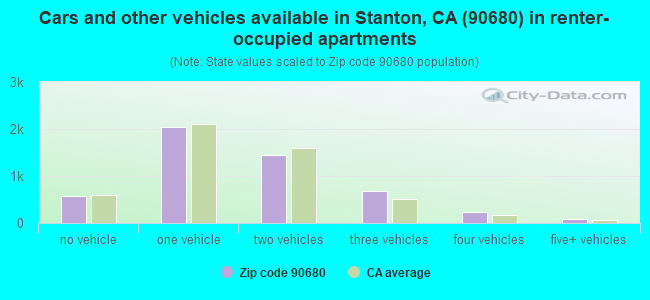
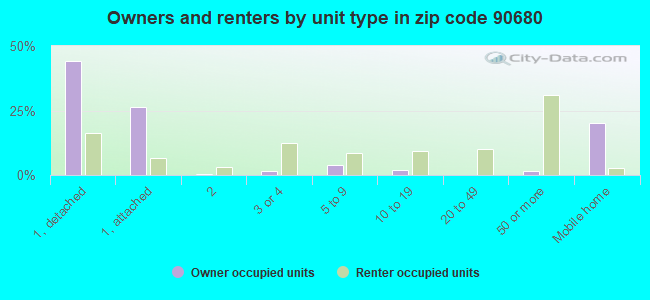
Houses and condos: 10,533 Renter-occupied apartments: 5,049
% of renters here:
50%
State:
44%
March 2022 cost of living index in zip code 90680: 86.5 (less than average, U.S. average is 100)
Land area: 2.7 sq. mi. Water area: 0.0 sq. mi.
Population density: 11,443 people per square mile
(high).
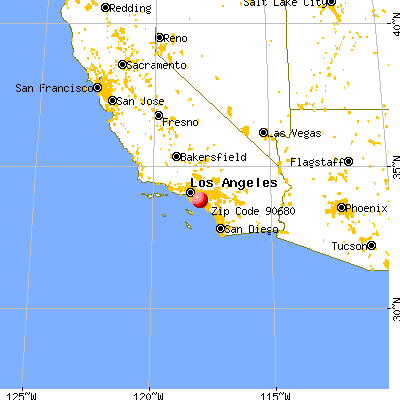
OSM Map
General Map
Google Map
MSN Map
OSM Map
General Map
Google Map
MSN Map
OSM Map
General Map
Google Map
MSN Map
OSM Map
General Map
Google Map
MSN Map
Please wait while loading the map...
Real estate property taxes paid for housing units in 2022:
This zip code:
0.7% ($3,893)
California:
0.7% ($4,831)
Median real estate property taxes paid for housing units with mortgages in 2022: $4,528 (0.7%) Median real estate property taxes paid for housing units with no mortgage in 2022: $2,274 (0.5%)
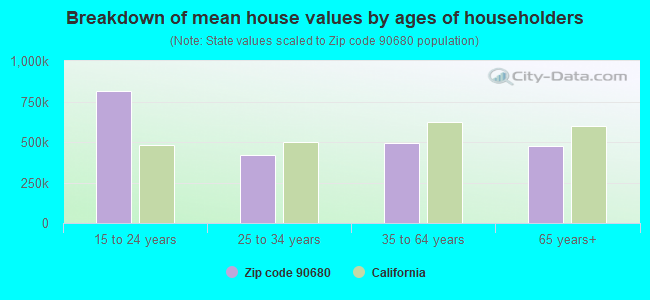
Estimated median house/condo value in 2022: $578,323
90680:
$578,323
California:
$715,900
According to our research of California and other state lists, there were 35 registered sex offenders living in 90680 zip code as of April 26, 2024. The ratio of all residents to sex offenders in zip code 90680 is 880 to 1. The ratio of registered sex offenders to all residents in this zip code is near the state average.
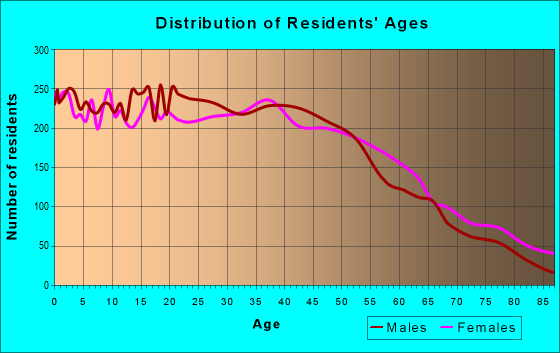
Median resident age:
This zip code:
38.8 years
California median age:
37.9 years
Average household size:
This zip code:
3.0 people
California:
2.8 people
Averages for the 2020 tax year for zip code 90680, filed in 2021:
Average Adjusted Gross Income (AGI) in 2020: $46,001 (Individual Income Tax Returns)
Here:
$46,001
State:
$95,910
Salary/wage: $43,679 (reported on 83.9% of returns)
Here:
$43,679
State:
$77,331
(% of AGI for various income ranges: 1201.6% for AGIs below $25k, 4075.3% for AGIs $25k-50k, 7633.5% for AGIs $50k-75k, 11734.1% for AGIs $75k-100k, 19865.1% for AGIs $100k-200k, 50775.0% for AGIs over 200k)
Taxable interest for individuals: $532 (reported on 23.9% of returns)
This zip code:
$532
California:
$2,294
(% of AGI for various income ranges: 7.1% for AGIs below $25k, 12.1% for AGIs $25k-50k, 25.2% for AGIs $50k-75k, 32.6% for AGIs $75k-100k, 55.6% for AGIs $100k-200k, 401.7% for AGIs over 200k)
Ordinary dividends: $2,046 (reported on 8.9% of returns)
Here:
$2,046
State:
$10,949
(% of AGI for various income ranges: 7.6% for AGIs below $25k, 11.9% for AGIs $25k-50k, 27.7% for AGIs $50k-75k, 32.7% for AGIs $75k-100k, 139.7% for AGIs $100k-200k, 691.7% for AGIs over 200k)
Net capital gain/loss in AGI: +$4,227 (reported on 10.8% of returns)
Here:
+$4,227
State:
+$49,306
(% of AGI for various income ranges: 6.4% for AGIs below $25k, 11.0% for AGIs $25k-50k, 41.0% for AGIs $50k-75k, 110.9% for AGIs $75k-100k, 401.6% for AGIs $100k-200k, 3191.7% for AGIs over 200k)
Profit/loss from business: +$7,086 (reported on 17.1% of returns)
Here:
+$7,086
State:
+$15,671
(% of AGI for various income ranges: 203.9% for AGIs below $25k, 149.2% for AGIs $25k-50k, 160.9% for AGIs $50k-75k, 142.7% for AGIs $75k-100k, 265.2% for AGIs $100k-200k, 876.7% for AGIs over 200k)
Taxable individual retirement arrangement distribution: $13,807 (reported on 3.6% of returns)
90680:
$13,807
California:
$23,505
(% of AGI for various income ranges: 31.1% for AGIs below $25k, 32.4% for AGIs $25k-50k, 87.4% for AGIs $50k-75k, 151.9% for AGIs $75k-100k, 394.5% for AGIs $100k-200k)
Total itemized deductions: $26,615 (reported on 9.7% of returns)
Here:
$26,615
State:
$39,517
(% of AGI for various income ranges: 38.8% for AGIs below $25k, 154.4% for AGIs $25k-50k, 560.4% for AGIs $50k-75k, 900.4% for AGIs $75k-100k, 1965.2% for AGIs $100k-200k, 5181.7% for AGIs over 200k)
Charity contributions: $4,438 (reported on 7.9% of returns)
Here:
$4,438
State:
$12,598
(% of AGI for various income ranges: 1.8% for AGIs below $25k, 13.4% for AGIs $25k-50k, 74.4% for AGIs $50k-75k, 119.2% for AGIs $75k-100k, 305.3% for AGIs $100k-200k, 1015.0% for AGIs over 200k)
Taxes paid: $7,923 (reported on 9.7% of returns)
90680:
$7,923
State:
$8,807
(% of AGI for various income ranges: 9.0% for AGIs below $25k, 41.1% for AGIs $25k-50k, 155.7% for AGIs $50k-75k, 305.9% for AGIs $75k-100k, 623.2% for AGIs $100k-200k, 1296.7% for AGIs over 200k)
Earned income credit: $2,037 (reported on 19.1% of returns)
Here:
$2,037
State:
$2,074
(% of AGI for various income ranges: 93.4% for AGIs below $25k, 72.2% for AGIs $25k-50k, 1.8% for AGIs $50k-75k)
Percentage of individuals using paid preparers for their 2020 taxes: 92.8%
Here:
93%
State:
92%
(% for various income ranges: 91.3% for AGIs below $25k, 93.8% for AGIs $25k-50k, 93.9% for AGIs $50k-75k, 93.3% for AGIs $75k-100k, 93.2% for AGIs $100k-200k, 93.3% for AGIs over 200k)
Averages for the 2012 tax year for zip code 90680, filed in 2013:
Average Adjusted Gross Income (AGI) in 2012: $37,661 (Individual Income Tax Returns)
Here:
$37,661
State:
$72,726
Salary/wage: $37,063 (reported on 85.7% of returns)
Here:
$37,063
State:
$59,079
(% of AGI for various income ranges: 76.2% for AGIs below $25k, 87.7% for AGIs $25k-50k, 87.3% for AGIs $50k-75k, 85.9% for AGIs $75k-100k, 85.1% for AGIs $100k-200k, 61.8% for AGIs over 200k)
Taxable interest for individuals: $520 (reported on 23.9% of returns)
This zip code:
$520
California:
$2,146
(% of AGI for various income ranges: 0.4% for AGIs below $25k, 0.2% for AGIs $25k-50k, 0.3% for AGIs $50k-75k, 0.2% for AGIs $75k-100k, 0.3% for AGIs $100k-200k, 2.0% for AGIs over 200k)
Ordinary dividends: $2,163 (reported on 7.8% of returns)
Here:
$2,163
State:
$9,308
(% of AGI for various income ranges: 0.3% for AGIs below $25k, 0.3% for AGIs $25k-50k, 0.4% for AGIs $50k-75k, 0.5% for AGIs $75k-100k, 0.8% for AGIs $100k-200k)
Net capital gain/loss in AGI: +$644 (reported on 6.7% of returns)
Here:
+$644
State:
+$30,460
(% of AGI for various income ranges: 1.0% for AGIs $100k-200k)
Profit/loss from business: +$8,500 (reported on 16.3% of returns)
Here:
+$8,500
State:
+$17,064
(% of AGI for various income ranges: 12.7% for AGIs below $25k, 3.4% for AGIs $25k-50k, 0.9% for AGIs $50k-75k, 1.1% for AGIs $75k-100k, 1.6% for AGIs $100k-200k)
Taxable individual retirement arrangement distribution: $11,157 (reported on 4.3% of returns)
90680:
$11,157
California:
$19,557
(% of AGI for various income ranges: 1.3% for AGIs below $25k, 0.9% for AGIs $25k-50k, 1.5% for AGIs $50k-75k, 1.3% for AGIs $75k-100k, 1.7% for AGIs $100k-200k)
Total itemized deductions: $21,027 (30% of AGI, reported on 26.1% of returns)
Here:
$21,027
State:
$34,004
Here:
29.6% of AGI
State:
22.7% of AGI
(% of AGI for various income ranges: 6.1% for AGIs below $25k, 11.8% for AGIs $25k-50k, 16.9% for AGIs $50k-75k, 19.3% for AGIs $75k-100k, 19.4% for AGIs $100k-200k, 16.1% for AGIs over 200k)
Charity contributions: $2,318 (reported on 21.5% of returns)
Here:
$2,318
State:
$4,659
(% of AGI for various income ranges: 0.3% for AGIs below $25k, 1.0% for AGIs $25k-50k, 1.7% for AGIs $50k-75k, 1.9% for AGIs $75k-100k, 1.8% for AGIs $100k-200k, 1.1% for AGIs over 200k)
Taxes paid: $5,983 (reported on 26.0% of returns)
90680:
$5,983
State:
$14,448
(% of AGI for various income ranges: 1.0% for AGIs below $25k, 2.5% for AGIs $25k-50k, 4.4% for AGIs $50k-75k, 6.0% for AGIs $75k-100k, 7.1% for AGIs $100k-200k, 7.3% for AGIs over 200k)
Earned income credit: $2,371 (reported on 24.1% of returns)
Here:
$2,371
State:
$2,286
(% of AGI for various income ranges: 7.0% for AGIs below $25k, 1.3% for AGIs $25k-50k)
Percentage of individuals using paid preparers for their 2012 taxes: 74.4%
Here:
74%
State:
64%
(% for various income ranges: 73.2% for AGIs below $25k, 77.0% for AGIs $25k-50k, 72.9% for AGIs $50k-75k, 74.1% for AGIs $75k-100k, 74.3% for AGIs $100k-200k, 100.0% for AGIs over 200k)
Averages for the 2004 tax year for zip code 90680, filed in 2005:
Average Adjusted Gross Income (AGI) in 2004: $33,328 (Individual Income Tax Returns)
Here:
$33,328
State:
$58,600
Salary/wage: $32,839 (reported on 87.5% of returns)
Here:
$32,839
State:
$49,455
(% of AGI for various income ranges: 100.7% for AGIs below $10k, 83.0% for AGIs $10k-25k, 89.1% for AGIs $25k-50k, 88.3% for AGIs $50k-75k, 88.3% for AGIs $75k-100k, 73.9% for AGIs over 100k)
Taxable interest for individuals: $822 (reported on 34.1% of returns)
This zip code:
$822
California:
$2,365
(% of AGI for various income ranges: 3.0% for AGIs below $10k, 0.9% for AGIs $10k-25k, 0.6% for AGIs $25k-50k, 0.8% for AGIs $50k-75k, 0.6% for AGIs $75k-100k, 1.2% for AGIs over 100k)
Taxable dividends: $1,554 (reported on 10.3% of returns)
Here:
$1,554
State:
$4,746
(% of AGI for various income ranges: 1.8% for AGIs below $10k, 0.5% for AGIs $10k-25k, 0.4% for AGIs $25k-50k, 0.4% for AGIs $50k-75k, 0.4% for AGIs $75k-100k, 0.9% for AGIs over 100k)
Net capital gain/loss: +$4,239 (reported on 9.1% of returns)
Here:
+$4,239
State:
+$23,418
(% of AGI for various income ranges: -1.5% for AGIs below $10k, -0.2% for AGIs $10k-25k, 0.2% for AGIs $25k-50k, 0.2% for AGIs $50k-75k, 0.7% for AGIs $75k-100k, 8.3% for AGIs over 100k)
Profit/loss from business: +$7,645 (reported on 13.5% of returns)
Here:
+$7,645
State:
+$16,826
(% of AGI for various income ranges: 12.7% for AGIs below $10k, 7.1% for AGIs $10k-25k, 2.6% for AGIs $25k-50k, 1.3% for AGIs $50k-75k, 1.1% for AGIs $75k-100k, 2.9% for AGIs over 100k)
IRA payment deduction: $2,557 (reported on 1.6% of returns)
90680:
$2,557
California:
$3,192
(% of AGI for various income ranges: 0.1% for AGIs $10k-25k, 0.1% for AGIs $25k-50k, 0.2% for AGIs $50k-75k, 0.1% for AGIs $75k-100k, 0.1% for AGIs over 100k)
Self-employed pension: $5,789 (reported on 0.2% of returns)
Here:
$5,789
California:
$17,688
Total itemized deductions: $18,824 (33% of AGI, reported on 31.0% of returns)
Here:
$18,824
State:
$28,113
Here:
32.8% of AGI
State:
25.3% of AGI
(% of AGI for various income ranges: 11.8% for AGIs below $10k, 9.4% for AGIs $10k-25k, 16.2% for AGIs $25k-50k, 21.1% for AGIs $50k-75k, 21.9% for AGIs $75k-100k, 20.8% for AGIs over 100k)
Charity contributions deductions: $2,233 (4% of AGI, reported on 26.4% of returns)
Here:
$2,233
State:
$3,923
Here:
3.7% of AGI
State:
3.3% of AGI
(% of AGI for various income ranges: 0.5% for AGIs below $10k, 0.8% for AGIs $10k-25k, 1.4% for AGIs $25k-50k, 2.2% for AGIs $50k-75k, 2.6% for AGIs $75k-100k, 2.5% for AGIs over 100k)
Total tax: $3,656 (reported on 66.4% of returns)
90680:
$3,656
State:
$10,761
(% of AGI for various income ranges: 3.9% for AGIs below $10k, 3.3% for AGIs $10k-25k, 5.5% for AGIs $25k-50k, 7.7% for AGIs $50k-75k, 9.5% for AGIs $75k-100k, 14.3% for AGIs over 100k)
Earned income credit: $1,837 (reported on 21.4% of returns)
Here:
$1,837
State:
$1,763
Percentage of individuals using paid preparers for their 2004 taxes: 71.2%
Here:
71%
State:
66%
(% for various income ranges: 64.2% for AGIs below $10k, 74.1% for AGIs $10k-25k, 71.4% for AGIs $25k-50k, 72.1% for AGIs $50k-75k, 73.5% for AGIs $75k-100k, 72.7% for AGIs over 100k)
Likely homosexual households (counted as self-reported same-sex unmarried-partner households)
Lesbian couples: 0.2% of all households
Gay men: 0.0% of all households
Household received Food Stamps/SNAP in the past 12 months: 1,840 Household did not receive Food Stamps/SNAP in the past 12 months: 8,458
Women who had a birth in the past 12 months: 159 (103 now married, 56 unmarried) Women who did not have a birth in the past 12 months: 7,295 (2,899 now married, 4,395 unmarried)
Housing units in zip code 90680 with a mortgage: 2,940 (117 second mortgage, 9 home equity loan, 80 both second mortgage and home equity loan) Houses without a mortgage: 7
Median monthly owner costs for units with a mortgage: $2,335 Median monthly owner costs for units without a mortgage: $672
Residents with income below the poverty level in 2022:
This zip code:
13.0%
Whole state:
12.2%
Residents with income below 50% of the poverty level in 2022:
This zip code:
6.4%
Whole state:
6.2%
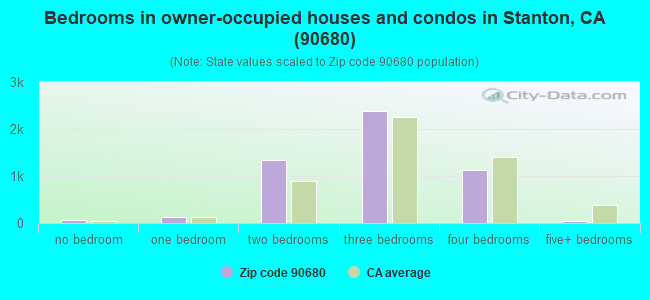
Median number of rooms in houses and condos:
Here:
5.3
State:
6.0
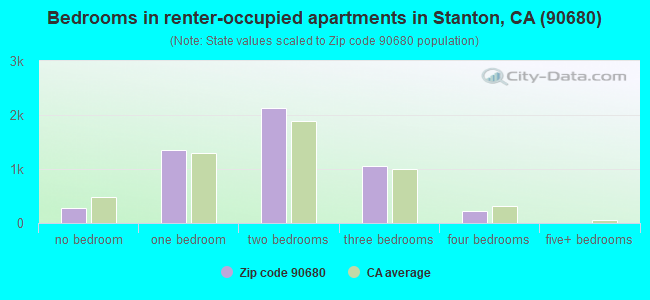
Median number of rooms in apartments:
Here:
4.0
State:
3.9
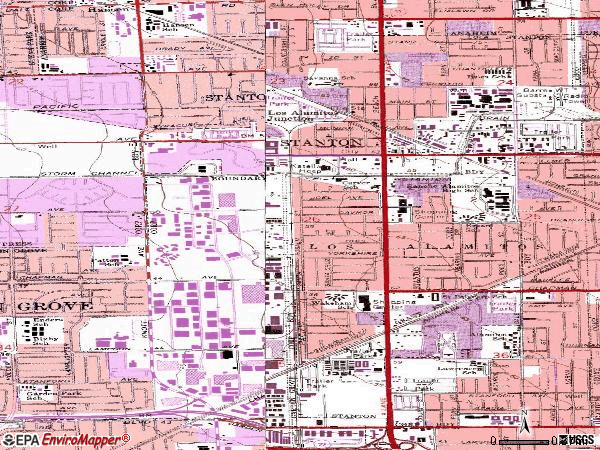
Notable locations in this zip code not listed on our city pages
Notable locations in zip code 90680: Barre Substation (A), Stanton City Hall (B), Stanton Branch Orange County Public Library (C), Orange County Fire Authority Station 46 (D). Display/hide their locations on the map
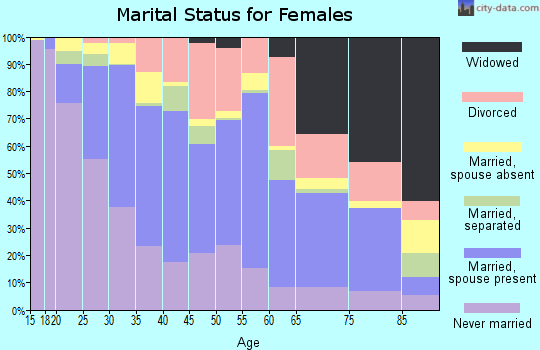
4,108 married couples with children.
1,404 single-parent households (394 men, 1,010 women).
35.6% of residents of 90680 zip code speak English at home.
38.6% of residents speak Spanish at home (59% very well, 18% well, 16% not well, 7% not at all).
0.8% of residents speak other Indo-European language at home (33% very well, 59% well, 8% not well).
23.0% of residents speak Asian or Pacific Island language at home (37% very well, 23% well, 32% not well, 8% not at all).
1.9% of residents speak other language at home (65% very well, 22% well, 14% not well).
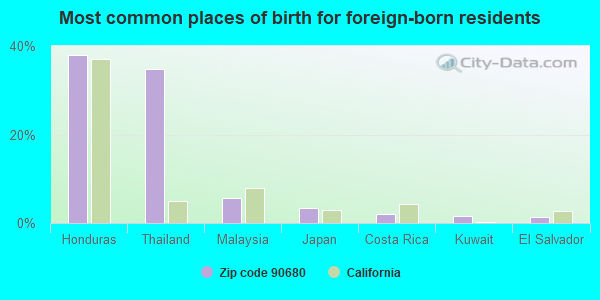
Foreign born population: 12,434 (40.3%) (61.2% of them are naturalized citizens)
This zip code:
40.3%
Whole state:
26.7%
38%Honduras
35%Thailand
6%Malaysia
3%Japan
2%Costa Rica
2%Kuwait
1%El Salvador
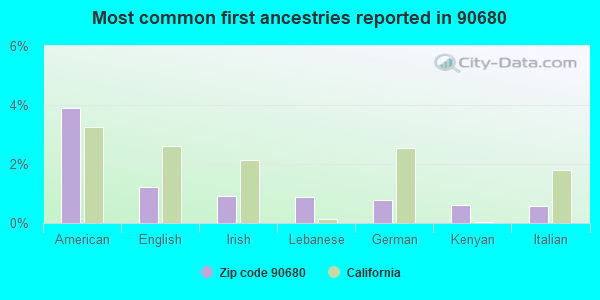
4%American
1%English
1%Irish
1%Lebanese
1%German
1%Kenyan
1%Italian
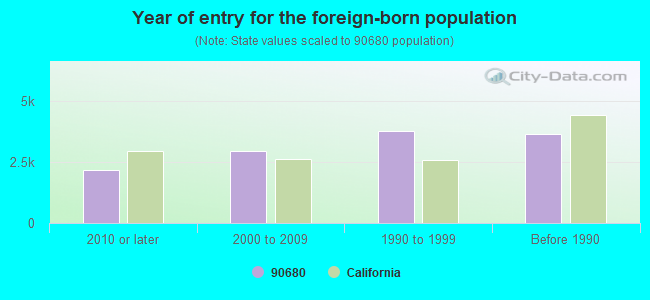
Year of entry for the foreign-born population
2,1812010 or later
2,9442000 to 2009
3,7901990 to 1999
3,651Before 1990
Major facilities with environmental interests located in this zip code:
ALL METALS PROCESSING OF ORANGE COUNTY (8401 STANDUSTRIAL AVENUE in STANTON, CA)
STATE MASTER (California - Hazardous Waste Tracking) - HAZARDOU WASTE PROGRAM CRITERIA AND HAZARDOUS AIR POLLUTANT INVENTORY (Inventory of air pollution sources) HAZARDOUS WASTE BIENNIAL REPORTER (Resource Conservation and Recovery Act (tracking hazardous waste)) Large Quantity Generators, more that 1000 kg of hazardous waste/month (Resource Conservation and Recovery Act (tracking hazardous waste)) TRI REPORTER (Tracking of toxic chemicals releasing facilities) Business SIC and NAICS classification: ELECTROPLATING, PLATING, POLISHING, ANODIZING, AND COLORING Alternative names: ALL METALS PROCESSING INC, ALL METALS PROCESSING CO OF ORANGE CNTY
FOX ELECTRIC MOTOR REPAIR (8307 STANDUSTRIAL in STANTON, CA)
STATE MASTER (California - Hazardous Waste Tracking) - HAZARDOU WASTE PROGRAM Small Quantity Generators, between 100 kg and 1000 kg of hazardous waste/month (Resource Conservation and Recovery Act (tracking hazardous waste)) - notification Organizations: WALLY FOX (CONTACT/OWNER)
CALTRANS DIST 12 (8122 KATELLA AVE in STANTON, CA) . Federal Facility
STATE MASTER (California - Hazardous Waste Tracking) - HAZARDOU WASTE PROGRAM Small Quantity Generators, between 100 kg and 1000 kg of hazardous waste/month (Resource Conservation and Recovery Act (tracking hazardous waste)) - notification Organizations: STATE OF CALIFORNIA (CONTACT/OWNER)
Alternative names: CAL TRANS STANTON MTCE STATION
CHEVRON STATION SW88054 (11250 BEACH BLVD in STANTON, CA)
STATE MASTER (California - Hazardous Waste Tracking) - HAZARDOU WASTE PROGRAM Small Quantity Generators, between 100 kg and 1000 kg of hazardous waste/month (Resource Conservation and Recovery Act (tracking hazardous waste)) - notification Organizations: CHEVRON USA PRODUCTS CO (CONTACT/OWNER)
Alternative names: CHERVON 93484
MODERN ALLOYS INC (11172 WESTERN AVE in STANTON, CA)
STATE MASTER (California - Hazardous Waste Tracking) - HAZARDOU WASTE PROGRAM Small Quantity Generators, between 100 kg and 1000 kg of hazardous waste/month (Resource Conservation and Recovery Act (tracking hazardous waste))
CARVER (MABEL) ELEMENTARY (11150 SANTA ROSALIA ST. in STANTON, CA)
(National Center for Education Statistics) - STATE ID-6028617 Organizations: GARDEN GROVE UNIFIED (SCHOOL DISTRICT)
MALCO TOOL & MACHINE INC (10931 COURT ST in STANTON, CA)
(Resource Conservation and Recovery Act (tracking hazardous waste))
HOT RODS BY BOYD INC (8372 MONROE in STANTON, CA)
(Resource Conservation and Recovery Act (tracking hazardous waste)) Business NAICS classification: AUTOMOTIVE BODY, PAINT, AND INTERIOR REPAIR AND MAINTENANCE. Organizations: BOYD CODDINTON (CONTACT/OWNER)
CALSCIENCE ENVIR LABS INC (11631 SEABOARD CIR in STANTON, CA)
CHEMICAL WASTE MANAGEMENT INC (10960 BOATMAN WY in STANTON, CA)
(Resource Conservation and Recovery Act (tracking hazardous waste))
ABLE DEGASSING INC (8230 PACIFIC ST in STANTON, CA)
TRANSPORTER (Resource Conservation and Recovery Act (tracking hazardous waste)) USED OIL PROGRAM (Resource Conservation and Recovery Act (tracking hazardous waste)) Organizations: BRIAN FITZPATRICK (CONTACT/OPERATOR)
, PETER A VALOV (CONTACT/OWNER)
FIRESTONE BUILDING MTRLS (10961 DALE in STANTON, CA)
Small Quantity Generators, between 100 kg and 1000 kg of hazardous waste/month (Resource Conservation and Recovery Act (tracking hazardous waste)) - notification Organizations: BRAD COOK (CONTACT/OWNER)
G & G AUTO (8100 ELECTRIC AVE in STANTON, CA)
Small Quantity Generators, between 100 kg and 1000 kg of hazardous waste/month (Resource Conservation and Recovery Act (tracking hazardous waste)) - notification Organizations: GLEN GROSS (CONTACT/OWNER)
Housing units lacking complete plumbing facilities: 0.4% Housing units lacking complete kitchen facilities: 4.7%
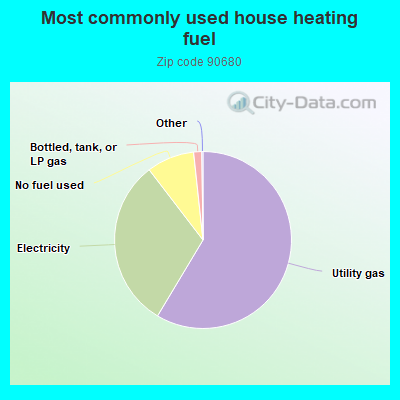
58.6%Utility gas
31.0%Electricity
8.7%No fuel used
1.5%Bottled, tank, or LP gas
Population in 1990: 25,160. Population change in the 1990s: +4,519 (+18.0%).
Place of birth for U.S.-born residents:
This state: 15,906
Northeast: 410
Midwest: 750
South: 695
West: 489
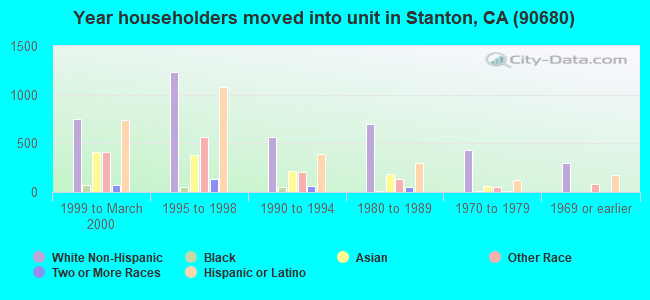
48% of the 90680 zip code residents lived in the same house 5 years ago. Out of people who lived in different houses, 77% lived in this county. Out of people who lived in different counties, 50% lived in California.
94% of the 90680 zip code residents lived in the same house 1 year ago. Out of people who lived in different houses, 65% moved from this county. Out of people who lived in different houses, 27% moved from different county within same state. Out of people who lived in different houses, 5% moved from different state. Out of people who lived in different houses, 6% moved from abroad.
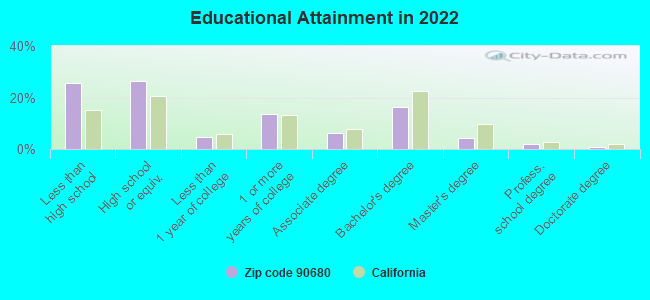
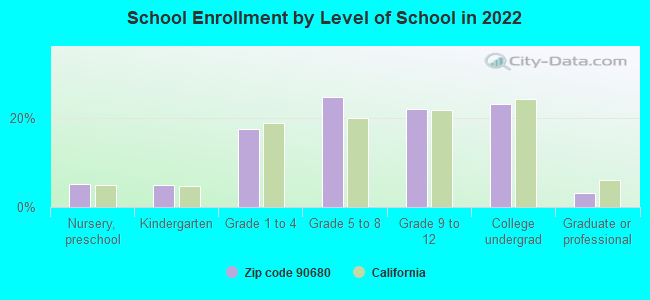
Private vs. public school enrollment:
Students in private schools in grades 1 to 8 (elementary and middle school): 94
Here:
2.8%
California:
10.5%
Students in private schools in grades 9 to 12 (high school): 121
Here:
6.8%
California:
8.5%
Students in private undergraduate colleges: 204
Here:
11.0%
California:
15.9%
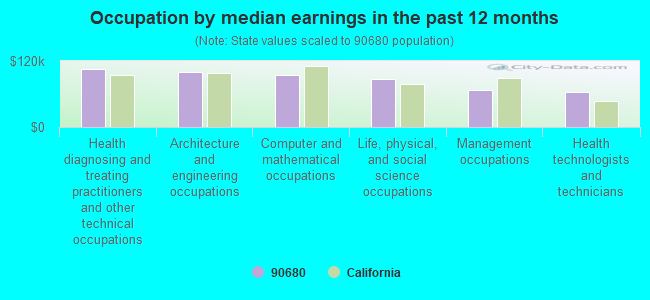
Occupation by median earnings in the past 12 months ($)
104,620Health diagnosing and treating practitioners and other technical occupations
100,356Architecture and engineering occupations
95,359Computer and mathematical occupations
87,217Life, physical, and social science occupations
66,405Management occupations
63,884Health technologists and technicians
Companies with federal contracts located in this zip code (STANTON, CA):
YOUNG CONSTRUCTION CO INC (10160 SONNET ST; small business) : $7,479,671 in 44 contractsfrom 1999 to 2006
Contracts for Maintenance, Repair or Alteration of Real Property -- Water Supply Facilities, Maintenance, Repair or Alteration of Real Property -- Other Administrative Facilities and Service Buildings, Maintenance, Repair or Alteration of Real Property -- Troop Housing Facilities, Maintenance, Repair or Alteration of Real Property -- Maintenance Buildings, and moreby Navy Signed by year:2000: $1,709,911; 2001: $2,596,645; 2002: $272,413; 2003: $1,869,300; 2004: $345,829; 2005: $635,281; 2006: $41,422.
Biggest contracts:
$1,184,000 with Navy for Maintenance, Repair or Alteration of Real Property -- Water Supply Facilities. Signed on 2003-09-12. Completion date: 2004-03-25.
$958,200, same as above.Signed on 2001-08-27. Completion date: 2002-03-10.
$874,130 with Navy for Maintenance, Repair or Alteration of Real Property -- Other Administrative Facilities and Service Buildings. Signed on 2000-09-05. Completion date: 2001-07-17.
$857,200 with Navy for Maintenance, Repair or Alteration of Real Property -- Troop Housing Facilities. Signed on 2001-09-27. Completion date: 2002-04-10.
B&E MANUFACTURING CO INC (7562 ORANGEWOOD AVE; small business) : $2,943,616 in 536 contractsfrom 1999 to 2006
Contracts for Hose, Pipe, Tube, Lubrication, and Railing Fittings, Nuts and Washers, Bushings, Rings, Shims, and Spacers, Valves, Nonpowered, and moreby Defense Logistics Agency, Army, Navy Signed by year:2000: $106,671; 2001: $0; 2002: $61,715; 2003: $53,479; 2004: $529,355; 2005: $1,441,851; 2006: $666,587.
Biggest contracts:
$78,111 with Defense Logistics Agency for Hose, Pipe, Tube, Lubrication, and Railing Fittings. Signed on 2000-05-17. Completion date: 2000-06-07.
$42,000, same as above.Signed on 1999-12-20. Completion date: 2000-03-30.
$41,958, same as above.Signed on 1999-10-06. Completion date: 2000-02-23.
$31,815 with Defense Logistics Agency for Nuts and Washers. Signed on 2002-03-06. Completion date: 2002-09-30.
CYNTHIA GARCIA (11782 WESTERN AVE STE 7; small business) : $826,647 in 27 contractsfrom 1999 to 2006
Contracts for Airframe Structural Components, Aircraft Air Conditioning, Heating, and Pressurizing Equipment by Defense Logistics Agency Signed by year:2000: $365,761; 2001: $73,800; 2002: $0; 2003: $0; 2004: $211,300; 2005: $70,566; 2006: $75,828.
Biggest contracts:
$110,599 with Defense Logistics Agency for Airframe Structural Components. Signed on 2000-05-31. Completion date: 2000-05-31.
$106,399, same as above.Signed on 2000-07-13. Completion date: 2001-02-06.
$77,311, same as above.Signed on 2000-07-05. Completion date: 2001-06-30.
$60,268, same as above.Signed on 2004-01-08. Completion date: 2004-06-01.
NEWCOMB SPRING OF CONNECTICUT, (8380 CERRITOS AVE; small business) : $100,180 in 13 contractsfrom 2004 to 2006
Contracts for Nails, Machine Keys, and Pins, Coil, Flat, Leaf, and Wire Springs, Fastening Device, Guns, through 30 mm, and moreby Defense Logistics Agency, Army, Navy Signed by year:2000: $0; 2001: $0; 2002: $0; 2003: $0; 2004: $28,500; 2005: $44,650; 2006: $27,030.
Biggest contracts:
$21,000 with Defense Logistics Agency for Nails, Machine Keys, and Pins. Signed on 2005-03-18. Completion date: 2005-06-02.
$18,000 with Defense Logistics Agency for Coil, Flat, Leaf, and Wire Springs. Signed on 2004-10-08. Completion date: 2004-12-28.
$10,500, same as above.Signed on 2004-11-19. Completion date: 2005-01-29.
$10,379 with Defense Logistics Agency for Fastening Device. Signed on 2006-04-19. Completion date: 2006-06-19.
DRILUBE COMPANY (8401 STANDUSTRIAL ST; small business) : $66,803 in 4 contractsfrom 2001 to 2006
$61,534 with Defense Logistics Agency for Oils and Greases: Cutting, Lubricating, and Hydraulic. Signed on 2001-10-16. Completion date: 2002-10-15.
$2,628, same as above.Signed on 2004-12-06. Completion date: 2005-02-05.
$2,501, same as above.Signed on 2004-12-11. Completion date: 2005-02-11.
$140 with Navy for Airframe Structural Components. Signed on 2006-05-17. Completion date: 2006-05-24.
ALPINE FASTENER & HARDWARE (8381 KATELLA AVE UNIT N; small business) : $61,484 in 12 contractsfrom 2005 to 2006
Contracts for Rivets, Hardware, Commercial by Defense Logistics Agency, Navy Signed by year:2000: $0; 2001: $0; 2002: $0; 2003: $0; 2004: $0; 2005: $33,411; 2006: $28,073.
Biggest contracts:
$10,880 with Defense Logistics Agency for Rivets. Signed on 2005-07-09. Completion date: 2005-07-20.
$10,470, same as above.Signed on 2006-05-04. Completion date: 2006-05-20.
$9,240, same as above.Signed on 2005-01-26. Completion date: 2005-03-13.
$5,208, same as above.Signed on 2006-03-03. Completion date: 2006-03-16.
CYPRESS INN & SUITES (7161 W KATELLA AVE; small business) : $51,516 in 5 contractsin 2004
Contracts for Lodging - Hotel/Motel by Army Signed by year:2000: $0; 2001: $0; 2002: $0; 2003: $0; 2004: $51,516; 2005: $0; 2006: $0.
Biggest contracts:
$32,319 with Army for Lodging - Hotel/Motel. Signed on 2004-03-17. Completion date: 2004-01-22.
$12,036, same as above.Signed on 2004-08-13. Completion date: 2004-08-18.
$3,432, same as above.Signed on 2004-09-03. Completion date: 2004-09-10.
$1,947, same as above.Signed on 2004-08-16. Completion date: 2004-08-18.
STEININGER, PHILIP B (7506 SANTA RITA CIRCLE; small business)
$15,000 with Navy for Power and Hand Pumps. Signed on 2005-06-01. Completion date: 2005-08-31.
CAMERON WELDING SUPPLY (11061 DALE STREET; small business)
$5,601 with Army for Welding Positioners and Manipulators. Signed on 2003-05-30. Completion date: 2003-06-03.
Top industries in this zip code by the number of employees in 2005:
Administrative and Support and Waste Management and Remediation Services: Solid Waste Collection (250-499 employees: 1 establishment, 100-249 employees: 1 establishment)
2005 - 2018 National Fire Incident Reporting System (NFIRS) incidents
According to the data from the years 2005 - 2018 the average number of fire incidents per year is 7. The highest number of fires - 17 took place in 2005, and the least - 1 in 2009. The data has a dropping trend.
When looking into fire subcategories, the most reports belonged to: Outside Fires (40.2%), and Structure Fires (36.3%).
Fire incident types reported to NFIRS in Zip Code 90680


 Nearest zip codes: 92841, 92804, 92845, 92844, 90630, 90620.


 According to the data from the years 2005 - 2018 the average number of fire incidents per year is 7. The highest number of fires - 17 took place in 2005, and the least - 1 in 2009. The data has a dropping trend.
 When looking into fire subcategories, the most reports belonged to: Outside Fires (40.2%), and Structure Fires (36.3%).