Estimated zip code population in 2022: 15,401 Zip code population in 2010: 16,333 Zip code population in 2000: 15,864
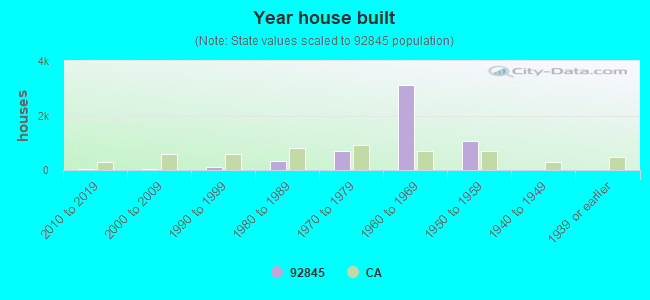
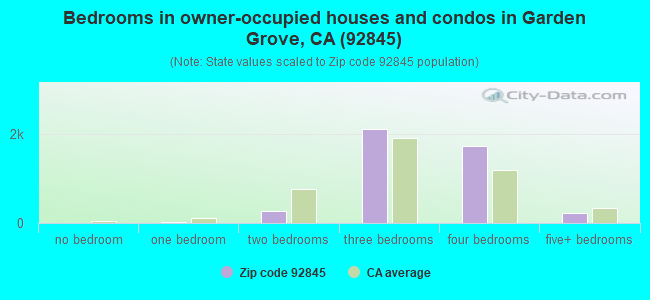
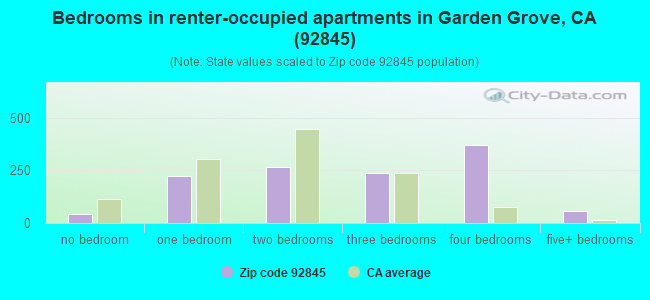
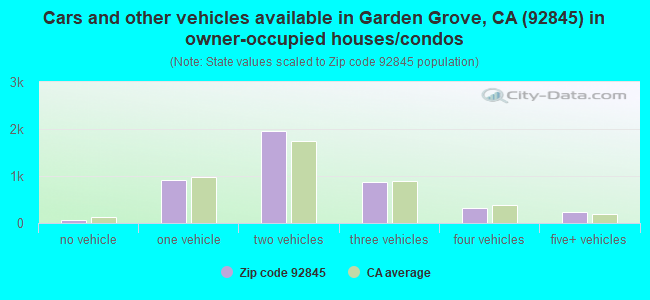
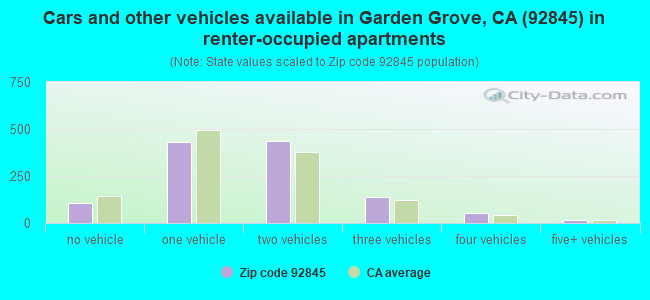
Houses and condos: 5,617 Renter-occupied apartments: 1,190
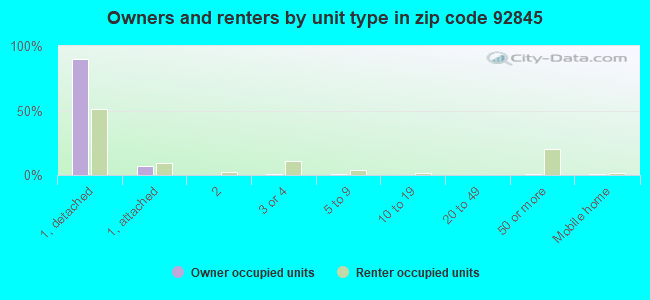
% of renters here:
21%
State:
44%
March 2022 cost of living index in zip code 92845: 87.2 (less than average, U.S. average is 100)
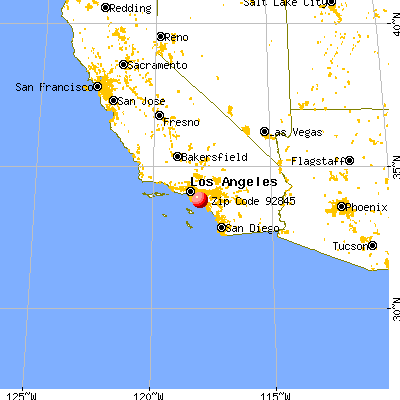
Land area: 2.2 sq. mi. Water area: 0.0 sq. mi.
Population density: 7,037 people per square mile
(high).
OSM Map
General Map
Google Map
MSN Map
OSM Map
General Map
Google Map
MSN Map
OSM Map
General Map
Google Map
MSN Map
OSM Map
General Map
Google Map
MSN Map
Please wait while loading the map...
Real estate property taxes paid for housing units in 2022:
This zip code:
0.6% ($5,143)
California:
0.7% ($4,831)
Median real estate property taxes paid for housing units with mortgages in 2022: $6,488 (0.7%) Median real estate property taxes paid for housing units with no mortgage in 2022: $4,255 (0.5%)
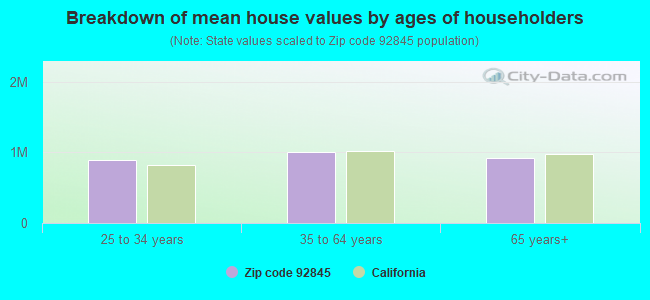
Estimated median house/condo value in 2022: $906,684
92845:
$906,684
California:
$715,900
According to our research of California and other state lists, there were 2 registered sex offenders living in 92845 zip code as of April 27, 2024. The ratio of all residents to sex offenders in zip code 92845 is 8,762 to 1. The ratio of registered sex offenders to all residents in this zip code is much lower than the state average.
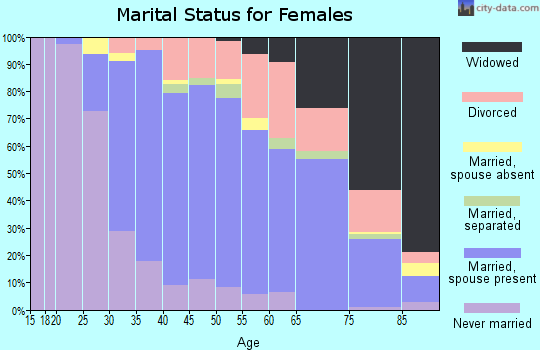
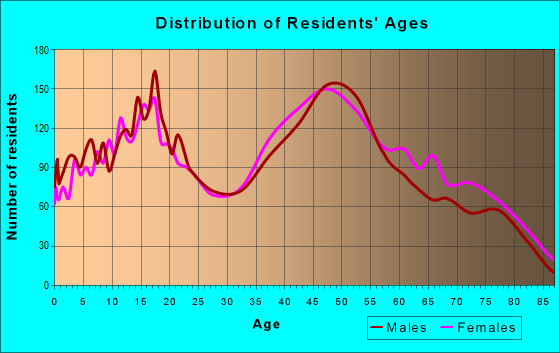
Median resident age:
This zip code:
44.3 years
California median age:
37.9 years
Average household size:
This zip code:
2.8 people
California:
2.8 people
Averages for the 2020 tax year for zip code 92845, filed in 2021:
Average Adjusted Gross Income (AGI) in 2020: $88,989 (Individual Income Tax Returns)
Here:
$88,989
State:
$95,910
Salary/wage: $83,425 (reported on 78.3% of returns)
Here:
$83,425
State:
$77,331
(% of AGI for various income ranges: 1097.5% for AGIs below $25k, 3606.5% for AGIs $25k-50k, 6575.9% for AGIs $50k-75k, 9948.4% for AGIs $75k-100k, 20931.8% for AGIs $100k-200k, 60612.7% for AGIs over 200k)
Taxable interest for individuals: $947 (reported on 50.7% of returns)
This zip code:
$947
California:
$2,294
(% of AGI for various income ranges: 25.1% for AGIs below $25k, 40.0% for AGIs $25k-50k, 50.3% for AGIs $50k-75k, 129.1% for AGIs $75k-100k, 131.2% for AGIs $100k-200k, 287.7% for AGIs over 200k)
Ordinary dividends: $3,739 (reported on 26.5% of returns)
Here:
$3,739
State:
$10,949
(% of AGI for various income ranges: 38.0% for AGIs below $25k, 74.0% for AGIs $25k-50k, 110.8% for AGIs $50k-75k, 221.3% for AGIs $75k-100k, 241.9% for AGIs $100k-200k, 893.8% for AGIs over 200k)
Net capital gain/loss in AGI: +$10,414 (reported on 24.3% of returns)
Here:
+$10,414
State:
+$49,306
(% of AGI for various income ranges: 11.0% for AGIs below $25k, 36.5% for AGIs $25k-50k, 113.0% for AGIs $50k-75k, 134.2% for AGIs $75k-100k, 427.5% for AGIs $100k-200k, 5477.7% for AGIs over 200k)
Profit/loss from business: +$10,634 (reported on 15.4% of returns)
Here:
+$10,634
State:
+$15,671
(% of AGI for various income ranges: 92.2% for AGIs below $25k, 246.7% for AGIs $25k-50k, 202.3% for AGIs $50k-75k, 318.2% for AGIs $75k-100k, 332.9% for AGIs $100k-200k, 1246.5% for AGIs over 200k)
Taxable individual retirement arrangement distribution: $19,872 (reported on 11.4% of returns)
92845:
$19,872
California:
$23,505
(% of AGI for various income ranges: 76.3% for AGIs below $25k, 168.0% for AGIs $25k-50k, 336.6% for AGIs $50k-75k, 669.5% for AGIs $75k-100k, 672.9% for AGIs $100k-200k, 994.2% for AGIs over 200k)
Self-employed (Keogh) retirement plans: $21,840 (reported on 0.6% of returns)
92845:
$21,840
California:
$30,163
(% of AGI for various income ranges: 60.5% for AGIs $75k-100k, 291.9% for AGIs over 200k)
Total itemized deductions: $32,406 (reported on 26.3% of returns)
Here:
$32,406
State:
$39,517
(% of AGI for various income ranges: 135.0% for AGIs below $25k, 330.2% for AGIs $25k-50k, 765.9% for AGIs $50k-75k, 1462.4% for AGIs $75k-100k, 3061.5% for AGIs $100k-200k, 6956.9% for AGIs over 200k)
Charity contributions: $5,906 (reported on 23.2% of returns)
Here:
$5,906
State:
$12,598
(% of AGI for various income ranges: 6.6% for AGIs below $25k, 29.8% for AGIs $25k-50k, 78.9% for AGIs $50k-75k, 173.8% for AGIs $75k-100k, 468.0% for AGIs $100k-200k, 1631.5% for AGIs over 200k)
Taxes paid: $9,073 (reported on 26.3% of returns)
92845:
$9,073
State:
$8,807
(% of AGI for various income ranges: 25.8% for AGIs below $25k, 71.6% for AGIs $25k-50k, 215.6% for AGIs $50k-75k, 435.8% for AGIs $75k-100k, 911.8% for AGIs $100k-200k, 1782.7% for AGIs over 200k)
Earned income credit: $1,550 (reported on 6.7% of returns)
Here:
$1,550
State:
$2,074
(% of AGI for various income ranges: 38.0% for AGIs below $25k, 41.4% for AGIs $25k-50k)
Percentage of individuals using paid preparers for their 2020 taxes: 93.2%
Here:
93%
State:
92%
(% for various income ranges: 91.0% for AGIs below $25k, 92.4% for AGIs $25k-50k, 92.7% for AGIs $50k-75k, 94.6% for AGIs $75k-100k, 94.0% for AGIs $100k-200k, 97.2% for AGIs over 200k)
Averages for the 2012 tax year for zip code 92845, filed in 2013:
Average Adjusted Gross Income (AGI) in 2012: $71,652 (Individual Income Tax Returns)
Here:
$71,652
State:
$72,726
Salary/wage: $66,260 (reported on 79.9% of returns)
Here:
$66,260
State:
$59,079
(% of AGI for various income ranges: 65.9% for AGIs below $25k, 69.9% for AGIs $25k-50k, 70.8% for AGIs $50k-75k, 75.5% for AGIs $75k-100k, 82.6% for AGIs $100k-200k, 55.3% for AGIs over 200k)
Taxable interest for individuals: $895 (reported on 49.5% of returns)
This zip code:
$895
California:
$2,146
(% of AGI for various income ranges: 1.7% for AGIs below $25k, 1.1% for AGIs $25k-50k, 0.8% for AGIs $50k-75k, 0.7% for AGIs $75k-100k, 0.4% for AGIs $100k-200k, 0.2% for AGIs over 200k)
Ordinary dividends: $3,144 (reported on 24.4% of returns)
Here:
$3,144
State:
$9,308
(% of AGI for various income ranges: 1.5% for AGIs below $25k, 1.4% for AGIs $25k-50k, 1.0% for AGIs $50k-75k, 1.0% for AGIs $75k-100k, 0.9% for AGIs $100k-200k, 1.3% for AGIs over 200k)
Net capital gain/loss in AGI: +$3,699 (reported on 18.3% of returns)
Here:
+$3,699
State:
+$30,460
(% of AGI for various income ranges: 0.3% for AGIs $75k-100k, 0.4% for AGIs $100k-200k, 5.2% for AGIs over 200k)
Profit/loss from business: +$11,790 (reported on 14.4% of returns)
Here:
+$11,790
State:
+$17,064
(% of AGI for various income ranges: 8.4% for AGIs below $25k, 4.4% for AGIs $25k-50k, 2.7% for AGIs $50k-75k, 2.9% for AGIs $75k-100k, 1.3% for AGIs $100k-200k, 1.5% for AGIs over 200k)
Taxable individual retirement arrangement distribution: $15,672 (reported on 13.7% of returns)
92845:
$15,672
California:
$19,557
(% of AGI for various income ranges: 5.9% for AGIs below $25k, 3.9% for AGIs $25k-50k, 4.3% for AGIs $50k-75k, 3.6% for AGIs $75k-100k, 2.4% for AGIs $100k-200k, 1.7% for AGIs over 200k)
Self-employment retirement plans: $13,200 (reported on 0.5% of returns)
92845:
$13,200
California:
$24,530
Total itemized deductions: $28,492 (26% of AGI, reported on 49.1% of returns)
Here:
$28,492
State:
$34,004
Here:
25.6% of AGI
State:
22.7% of AGI
(% of AGI for various income ranges: 16.2% for AGIs below $25k, 14.9% for AGIs $25k-50k, 18.9% for AGIs $50k-75k, 21.3% for AGIs $75k-100k, 21.6% for AGIs $100k-200k, 16.2% for AGIs over 200k)
Charity contributions: $3,063 (reported on 43.5% of returns)
Here:
$3,063
State:
$4,659
(% of AGI for various income ranges: 0.9% for AGIs below $25k, 1.3% for AGIs $25k-50k, 1.8% for AGIs $50k-75k, 2.0% for AGIs $75k-100k, 2.2% for AGIs $100k-200k, 1.4% for AGIs over 200k)
Taxes paid: $10,017 (reported on 49.1% of returns)
92845:
$10,017
State:
$14,448
(% of AGI for various income ranges: 2.8% for AGIs below $25k, 3.3% for AGIs $25k-50k, 5.2% for AGIs $50k-75k, 6.5% for AGIs $75k-100k, 8.0% for AGIs $100k-200k, 9.0% for AGIs over 200k)
Earned income credit: $1,749 (reported on 8.7% of returns)
Here:
$1,749
State:
$2,286
(% of AGI for various income ranges: 3.1% for AGIs below $25k, 0.7% for AGIs $25k-50k)
Percentage of individuals using paid preparers for their 2012 taxes: 62.6%
Here:
63%
State:
64%
(% for various income ranges: 52.4% for AGIs below $25k, 63.1% for AGIs $25k-50k, 67.0% for AGIs $50k-75k, 67.9% for AGIs $75k-100k, 68.3% for AGIs $100k-200k, 70.8% for AGIs over 200k)
Averages for the 2004 tax year for zip code 92845, filed in 2005:
Average Adjusted Gross Income (AGI) in 2004: $56,959 (Individual Income Tax Returns)
Here:
$56,959
State:
$58,600
Salary/wage: $54,426 (reported on 81.8% of returns)
Here:
$54,426
State:
$49,455
(% of AGI for various income ranges: 132.4% for AGIs below $10k, 64.6% for AGIs $10k-25k, 72.0% for AGIs $25k-50k, 76.8% for AGIs $50k-75k, 84.6% for AGIs $75k-100k, 78.3% for AGIs over 100k)
Taxable interest for individuals: $1,186 (reported on 61.2% of returns)
This zip code:
$1,186
California:
$2,365
(% of AGI for various income ranges: 6.9% for AGIs below $10k, 2.9% for AGIs $10k-25k, 1.9% for AGIs $25k-50k, 1.2% for AGIs $50k-75k, 1.0% for AGIs $75k-100k, 0.9% for AGIs over 100k)
Taxable dividends: $1,787 (reported on 29.3% of returns)
Here:
$1,787
State:
$4,746
(% of AGI for various income ranges: 3.8% for AGIs below $10k, 1.7% for AGIs $10k-25k, 0.9% for AGIs $25k-50k, 1.0% for AGIs $50k-75k, 0.9% for AGIs $75k-100k, 0.8% for AGIs over 100k)
Net capital gain/loss: +$5,762 (reported on 22.5% of returns)
Here:
+$5,762
State:
+$23,418
(% of AGI for various income ranges: -1.5% for AGIs below $10k, -0.4% for AGIs $10k-25k, 0.2% for AGIs $25k-50k, 0.2% for AGIs $50k-75k, 0.7% for AGIs $75k-100k, 5.0% for AGIs over 100k)
Profit/loss from business: +$12,545 (reported on 16.2% of returns)
Here:
+$12,545
State:
+$16,826
(% of AGI for various income ranges: -2.3% for AGIs below $10k, 7.4% for AGIs $10k-25k, 5.6% for AGIs $25k-50k, 3.2% for AGIs $50k-75k, 2.5% for AGIs $75k-100k, 3.2% for AGIs over 100k)
IRA payment deduction: $3,261 (reported on 3.5% of returns)
92845:
$3,261
California:
$3,192
(% of AGI for various income ranges: 0.2% for AGIs $10k-25k, 0.4% for AGIs $25k-50k, 0.2% for AGIs $50k-75k, 0.2% for AGIs $75k-100k, 0.1% for AGIs over 100k)
Self-employed pension: $11,302 (reported on 0.8% of returns)
Here:
$11,302
California:
$17,688
(% of AGI for various income ranges: 0.2% for AGIs $50k-75k, 0.2% for AGIs $75k-100k, 0.2% for AGIs over 100k)
Total itemized deductions: $23,602 (28% of AGI, reported on 51.5% of returns)
Here:
$23,602
State:
$28,113
Here:
27.6% of AGI
State:
25.3% of AGI
(% of AGI for various income ranges: 26.0% for AGIs below $10k, 16.9% for AGIs $10k-25k, 17.5% for AGIs $25k-50k, 23.8% for AGIs $50k-75k, 24.6% for AGIs $75k-100k, 20.4% for AGIs over 100k)
Charity contributions deductions: $2,915 (3% of AGI, reported on 47.9% of returns)
Here:
$2,915
State:
$3,923
Here:
3.3% of AGI
State:
3.3% of AGI
(% of AGI for various income ranges: 1.2% for AGIs below $10k, 1.6% for AGIs $10k-25k, 1.9% for AGIs $25k-50k, 2.6% for AGIs $50k-75k, 2.8% for AGIs $75k-100k, 2.6% for AGIs over 100k)
Total tax: $7,214 (reported on 83.9% of returns)
92845:
$7,214
State:
$10,761
(% of AGI for various income ranges: 4.5% for AGIs below $10k, 4.9% for AGIs $10k-25k, 7.5% for AGIs $25k-50k, 8.4% for AGIs $50k-75k, 9.0% for AGIs $75k-100k, 14.2% for AGIs over 100k)
Earned income credit: $1,359 (reported on 6.8% of returns)
Here:
$1,359
State:
$1,763
Percentage of individuals using paid preparers for their 2004 taxes: 64.3%
Here:
64%
State:
66%
(% for various income ranges: 49.6% for AGIs below $10k, 59.0% for AGIs $10k-25k, 63.8% for AGIs $25k-50k, 68.9% for AGIs $50k-75k, 72.1% for AGIs $75k-100k, 72.9% for AGIs over 100k)
Likely homosexual households (counted as self-reported same-sex unmarried-partner households)
Lesbian couples: 0.2% of all households
Gay men: 0.0% of all households
Household received Food Stamps/SNAP in the past 12 months: 198 Household did not receive Food Stamps/SNAP in the past 12 months: 5,224
Women who had a birth in the past 12 months: 137 (112 now married, 24 unmarried) Women who did not have a birth in the past 12 months: 2,688 (1,471 now married, 1,200 unmarried)
Housing units in zip code 92845 with a mortgage: 2,902 (305 second mortgage, 15 home equity loan, 270 both second mortgage and home equity loan) Houses without a mortgage: 26
Median monthly owner costs for units with a mortgage: $2,966 Median monthly owner costs for units without a mortgage: $634
Residents with income below the poverty level in 2022:
This zip code:
4.2%
Whole state:
12.2%
Residents with income below 50% of the poverty level in 2022:
This zip code:
1.0%
Whole state:
6.2%
Median number of rooms in houses and condos:
Here:
6.0
State:
6.0
Median number of rooms in apartments:
Here:
5.4
State:
3.9
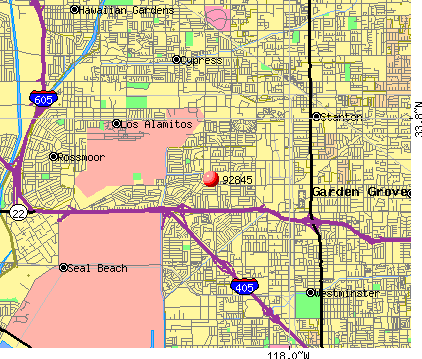
Notable locations in this zip code not listed on our city pages
Notable locations in zip code 92845: West Garden Grove Branch Orange County Public Library (A), Garden Grove Fire Department Station 4 (B). Display/hide their locations on the map
In group quarters: 136 (-1 institutionalized population)
Size of family households: 1,618 2-persons, 1,124 3-persons, 708 4-persons, 458 5-persons, 65 6-persons, 132 7-or-more-persons
Size of nonfamily households: 1,255 1-person, 149 2-persons, 12 4-persons
2,262 married couples with children.
208 single-parent households (57 men, 151 women).
80.6% of residents of 92845 zip code speak English at home.
6.3% of residents speak Spanish at home (83% very well, 11% well, 6% not well, 1% not at all).
2.8% of residents speak other Indo-European language at home (93% very well, 4% well, 4% not well).
9.2% of residents speak Asian or Pacific Island language at home (47% very well, 25% well, 24% not well, 5% not at all).
0.6% of residents speak other language at home (30% very well, 26% well, 44% not well).
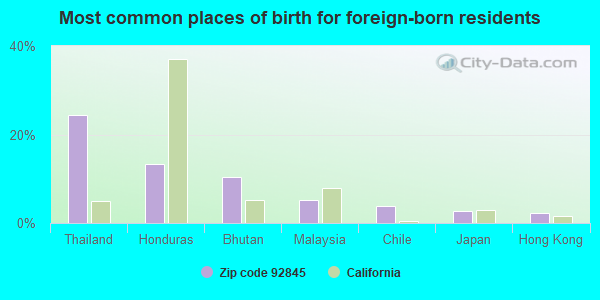
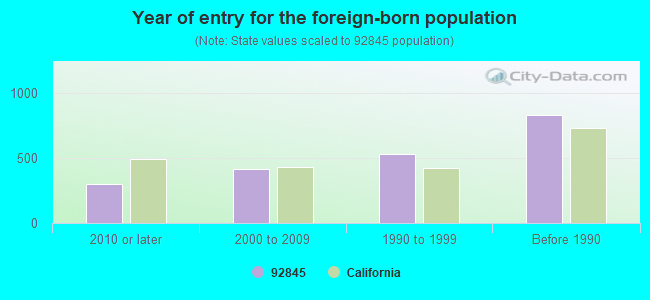
Foreign born population: 2,006 (13.0%) (76.9% of them are naturalized citizens)
Facilities with environmental interests located in this zip code:
FLEET TRANSPORTATION INC (12812 VALLEY VIEW ST STE 9 in GARDEN GROVE, CA)
STATE MASTER (California - Hazardous Waste Tracking) - HAZARDOU WASTE PROGRAM TRANSPORTER (Resource Conservation and Recovery Act (tracking hazardous waste)) - notification USED OIL PROGRAM (Resource Conservation and Recovery Act (tracking hazardous waste)) Organizations: KEVIN SUTTON (CONTACT/OWNER)
ENDERS ELEMENTARY (12302 SPRINGDALE ST. in GARDEN GROVE, CA)
(National Center for Education Statistics) - STATE ID-6028500 Organizations: GARDEN GROVE UNIFIED (SCHOOL DISTRICT)
GARDEN PARK ELEMENTARY (6562 STANFORD AVE. in GARDEN GROVE, CA)
(National Center for Education Statistics) - STATE ID-6028401 Organizations: GARDEN GROVE UNIFIED (SCHOOL DISTRICT)
BARKER (LOYAL) ELEMENTARY (12565 SPRINGDALE ST. in GARDEN GROVE, CA)
(National Center for Education Statistics) - STATE ID-6028609 Organizations: GARDEN GROVE UNIFIED (SCHOOL DISTRICT)
EASTGATE SHELL (6022 CHAPMAN AVENUE in GARDEN GROVE, CA)
Conditionally Exempt Small Quantity Generators, less than 100 kg/month of hazardous waste (Resource Conservation and Recovery Act (tracking hazardous waste)) - notification Organizations: CHARLES WILLY (CONTACT/OWNER)
ECONO LUBE N TUNE (6962 WEST CHAPMAN AVENUE in GARDEN GROVE, CA)
Small Quantity Generators, between 100 kg and 1000 kg of hazardous waste/month (Resource Conservation and Recovery Act (tracking hazardous waste)) - notification Organizations: KHOSROW GHALIB RASHTABDI (CONTACT/OWNER)
EASTGATE MEDICAL CENTER (11848 VALLEY VIEW NO A in GARDEN GROVE, CA)
Small Quantity Generators, between 100 kg and 1000 kg of hazardous waste/month (Resource Conservation and Recovery Act (tracking hazardous waste)) - notification Organizations: RICHARD J WINKLE MD (CONTACT/OWNER)
MIKE SHILL PAINTING (12872 VALLEY VIEW SUITE 6 in GARDEN GROVE, CA)
Small Quantity Generators, between 100 kg and 1000 kg of hazardous waste/month (Resource Conservation and Recovery Act (tracking hazardous waste)) - notification
Housing units lacking complete plumbing facilities: 0.4% Housing units lacking complete kitchen facilities: 1.1%
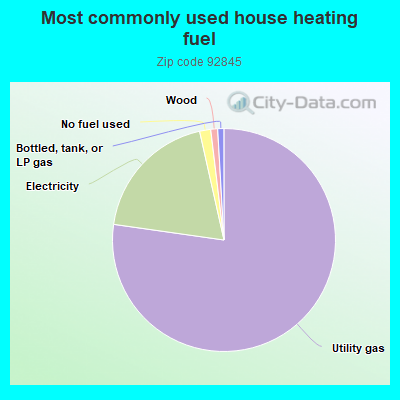
77.1%Utility gas
19.2%Electricity
1.6%No fuel used
1.0%Wood
0.9%Bottled, tank, or LP gas
Place of birth for U.S.-born residents:
This state: 10,670
Northeast: 714
Midwest: 888
South: 492
West: 490
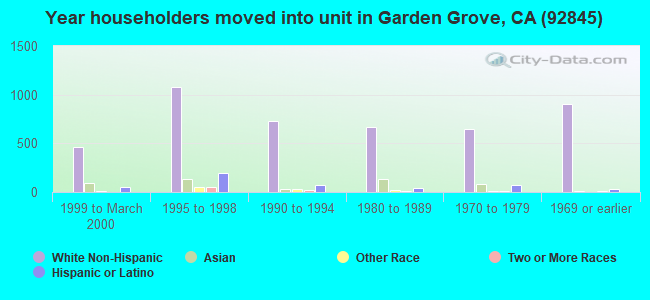
61% of the 92845 zip code residents lived in the same house 5 years ago. Out of people who lived in different houses, 68% lived in this county. Out of people who lived in different counties, 50% lived in California.
93% of the 92845 zip code residents lived in the same house 1 year ago. Out of people who lived in different houses, 63% moved from this county. Out of people who lived in different houses, 31% moved from different county within same state. Out of people who lived in different houses, 5% moved from different state. Out of people who lived in different houses, 3% moved from abroad.
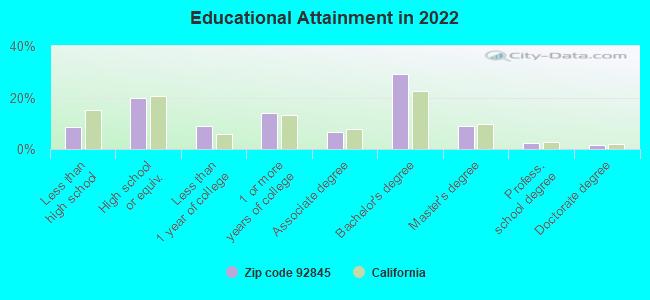
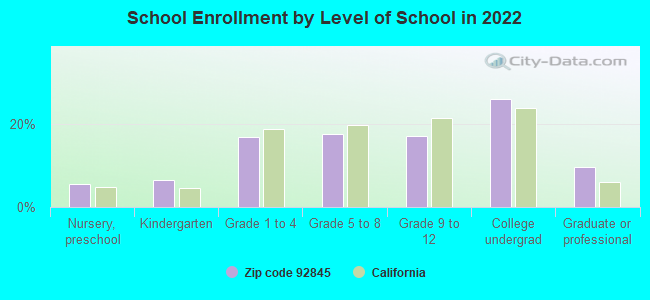
Private vs. public school enrollment:
Students in private schools in grades 1 to 8 (elementary and middle school): 98
Here:
7.7%
California:
10.5%
Students in private schools in grades 9 to 12 (high school): 31
Here:
5.0%
California:
8.5%
Students in private undergraduate colleges: 187
Here:
19.4%
California:
15.9%
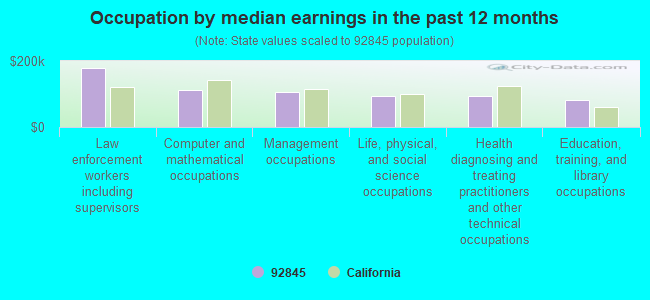
Occupation by median earnings in the past 12 months ($)
178,024Law enforcement workers including supervisors
111,446Computer and mathematical occupations
107,188Management occupations
93,972Life, physical, and social science occupations
92,975Health diagnosing and treating practitioners and other technical occupations
81,703Education, training, and library occupations
Companies with federal contracts located in this zip code:
CAL-POWER CORPORATION (12812 VALLEY VIEW ST STE 8 in GARDEN GROVE, CA) : $1,004,434 in 14 contractsfrom 1999 to 2005
Contracts for Electrical Control Equipment by Defense Logistics Agency Signed by year:2000: $0; 2001: $352,950; 2002: $173,280; 2003: $133,575; 2004: $71,925; 2005: $130,120; 2006: $0.
Biggest contracts:
$142,584 with Defense Logistics Agency for Electrical Control Equipment. Signed on 1999-10-18. Completion date: 2000-04-17.
$130,120, same as above.Signed on 2005-06-20. Completion date: 2006-01-03.
$86,010, same as above.Signed on 2001-03-06. Completion date: 2001-12-10.
$86,010, same as above.Signed on 2001-03-05. Completion date: 2001-12-10.
BOWIE & ASSOCIATES (6042 TRINETTE AVE in GARDEN GROVE, CA; small business) : $206,015 in 3 contractsfrom 2001 to 2002
$95,934 with Navy for Hose and Flexible Tubing. Signed on 2002-06-03. Completion date: 2002-07-01.
$59,055 with Navy for Hose, Pipe, Tube, Lubrication, and Railing Fittings. Signed on 2001-11-15. Completion date: 2001-12-13.
$51,026 with Navy for Hose and Flexible Tubing. Signed on 2002-12-10. Completion date: 2003-01-13.
CHAMBER SERVICES INC (6362 CHAPMAN AVENUE in GARDEN GROVE, CA; small business)
$168,000 with Army for Trailers. Taking place in AZ. Signed on 2005-09-16. Completion date: 2006-01-31.
Top industries in this zip code by the number of employees in 2005:
Administrative and Support and Waste Management and Remediation Services: Temporary Help Services (100-249 employees: 1 establishment, 1-4 employees: 3 establishments)


 Nearest zip codes: 90680, 90630, 90720, 92841, 92683, 90740.